Categories
Forex Basic Strategies

Create a Powerful Forex Strategy In Only Five Steps

One of the first things that can happen to you when you start trading forex is seeing that it is possible to earn money without having a fixed course. This will create a false feeling that trading is easy and you don’t need anything else. Then, the market will put you in your place. But of course, you’ll get pretty high for the previous gain and then the fall will be harder. Then the frustration will be such that you will want to quit trading and think that everything is manipulated and against you. Does it ring a bell?

Why is this happening? You were lucky to start and you don’t have a clear strategy that allows you to trade without those ups and downs as if you were on a roller coaster. If you spend time creating one or more strategies and adjust the risk so that market movements don’t leave you with KO, you can put the odds in your favor.

How can you create a trading strategy? It is very simple, nowadays there are many tools that allow you to create systems and automate them without learning to program. As easy as having to follow a series of steps to make sure you have everything defined and that you don’t leave anything in the air. I tell you the five steps to set up a trading strategy.

Define A Time Period

Your trading strategy needs to be well defined over time. Set when to open a position and when to close it. The exact moment in time or circumstance. In addition to the frequency. if for example will not operate on Fridays or during a strip at night. This is especially useful in some intraday strategies to limit that no trades are made during rollover, as spreads are usually higher and we pay more for each trade. Also interesting not to trade for example on Sundays at the opening or when there is volatility as when macro data is published.

If you do day trading you will look for small time frames trades with the aim of looking for intraday movements in the price, while if you do swing trading you will look for wider ranges in the price and your time horizon will be wider.

Input and Output Indicators

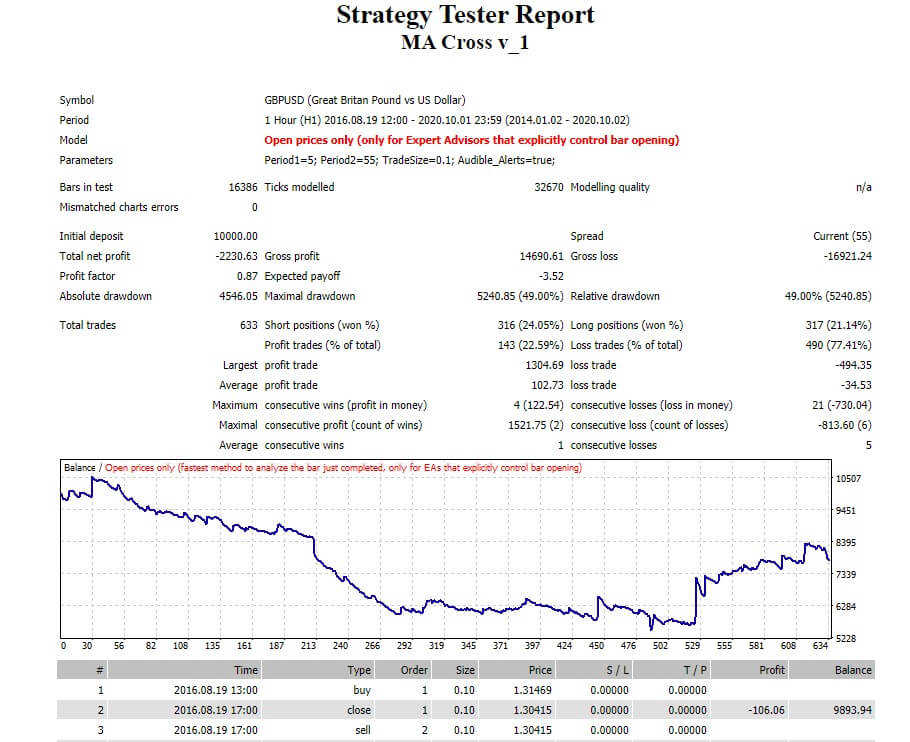
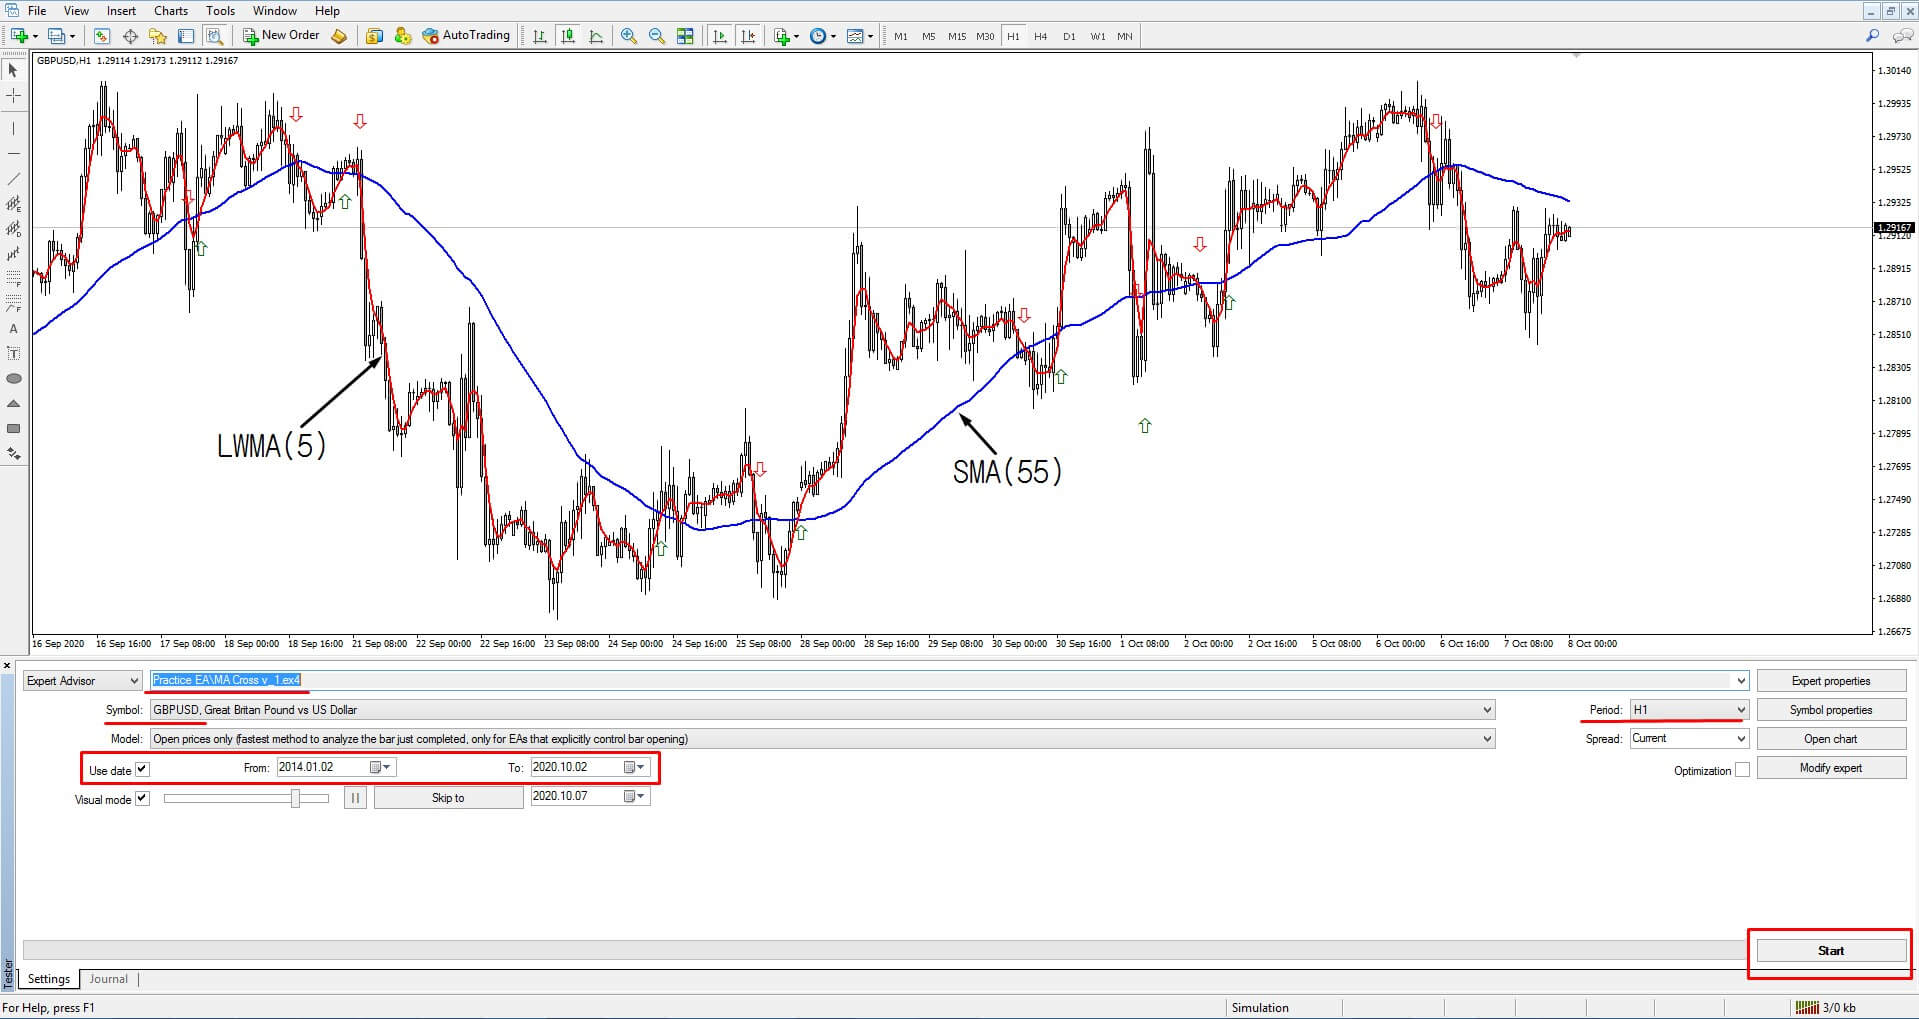
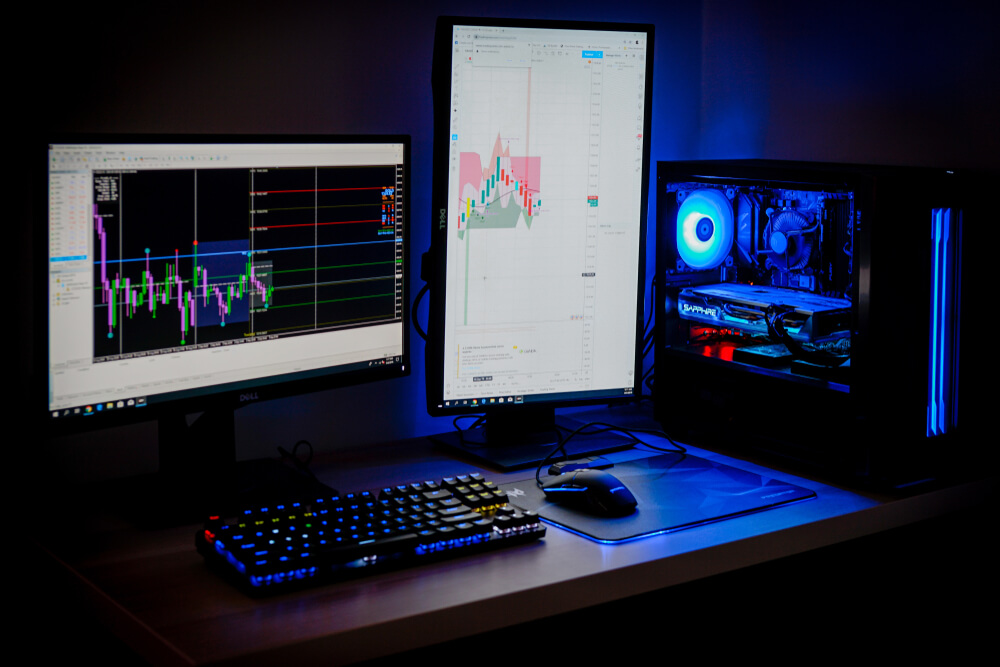
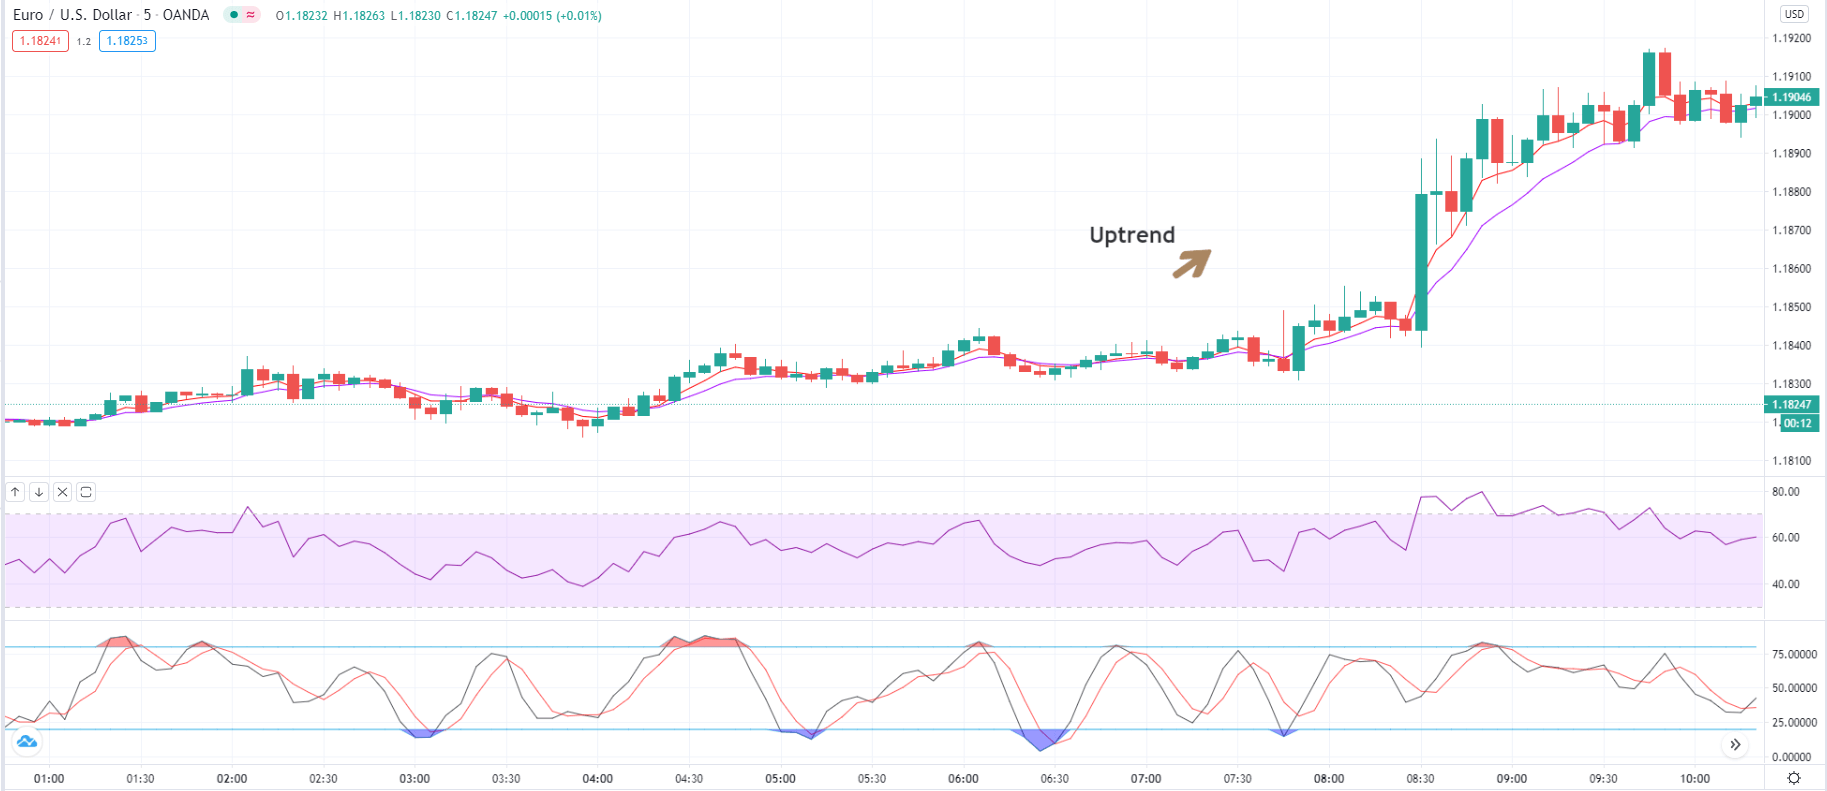
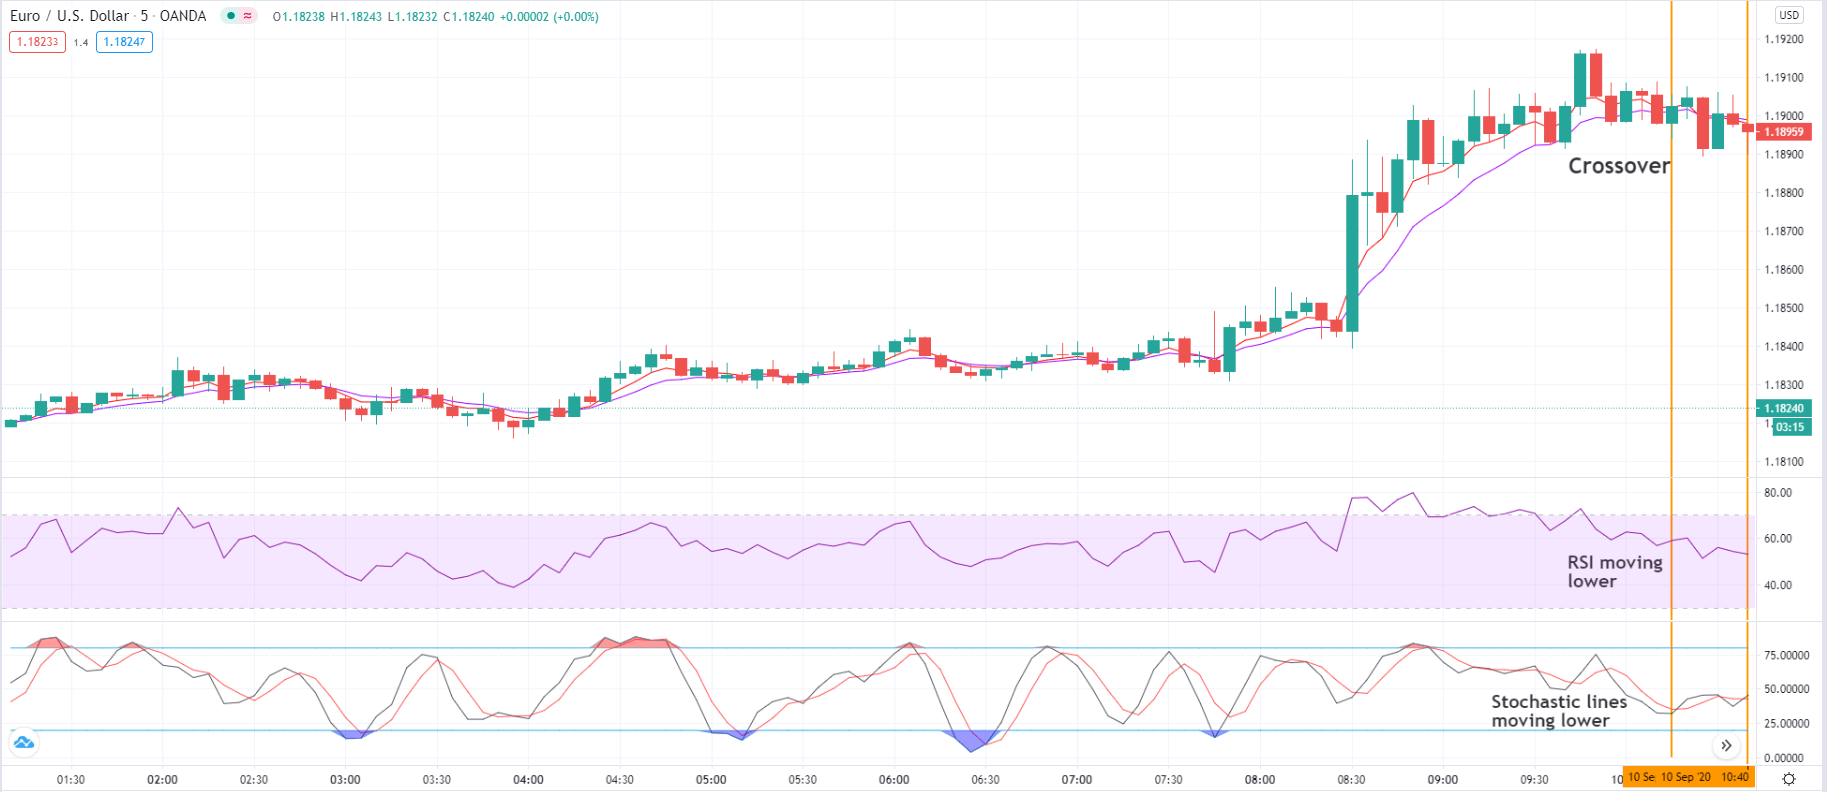
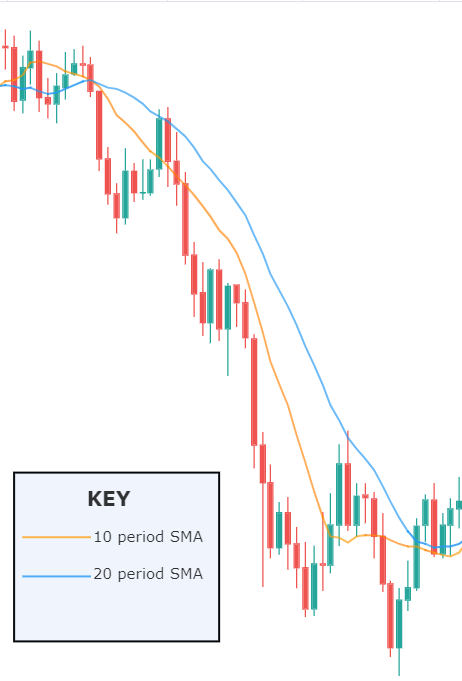
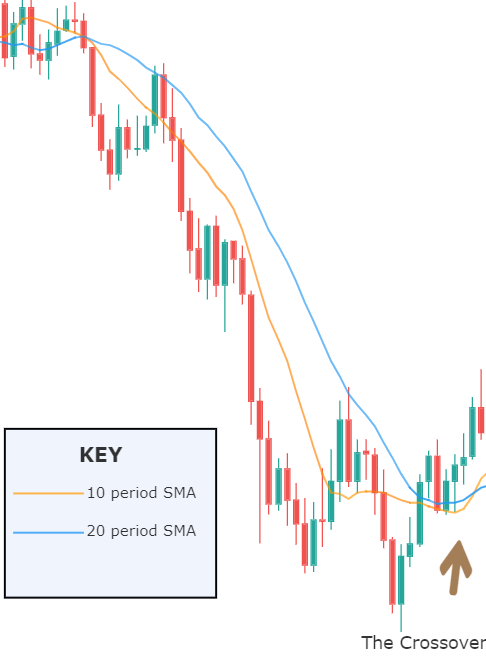
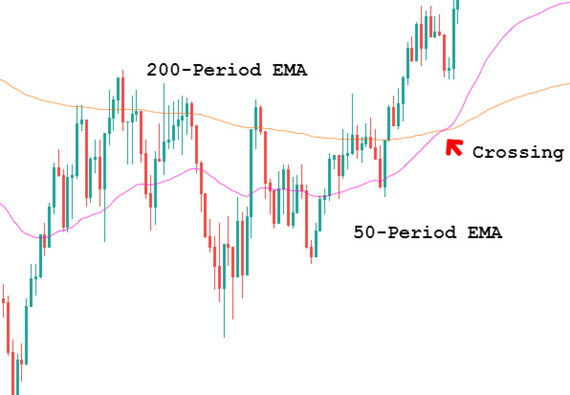
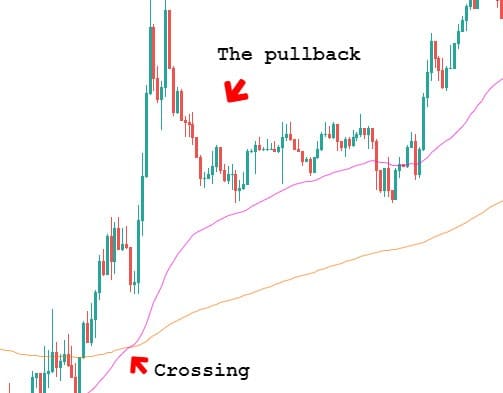
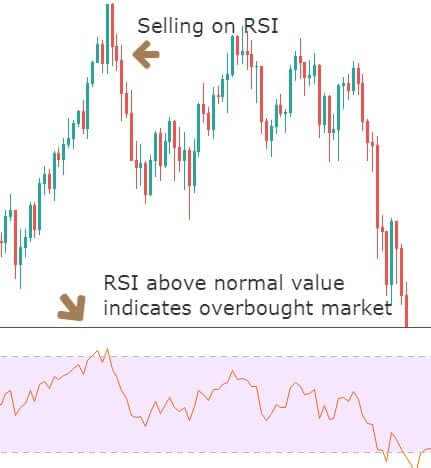
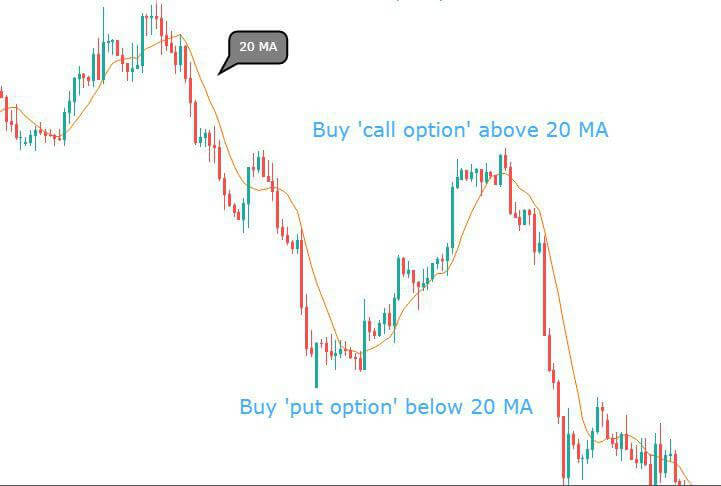
Indicators, as their name indicates, will act to give an input or output signal from a position. An indicator can be simple as a moving average or more complex and personalized. Really indicators with very simple rules work very well over time. For example, we can define in our trading strategy that when the opening price in an hour of EUR/USD exceeds its 20-period weighted moving average, buy and close the position when subsequently, the opening price in one hour is below this average.

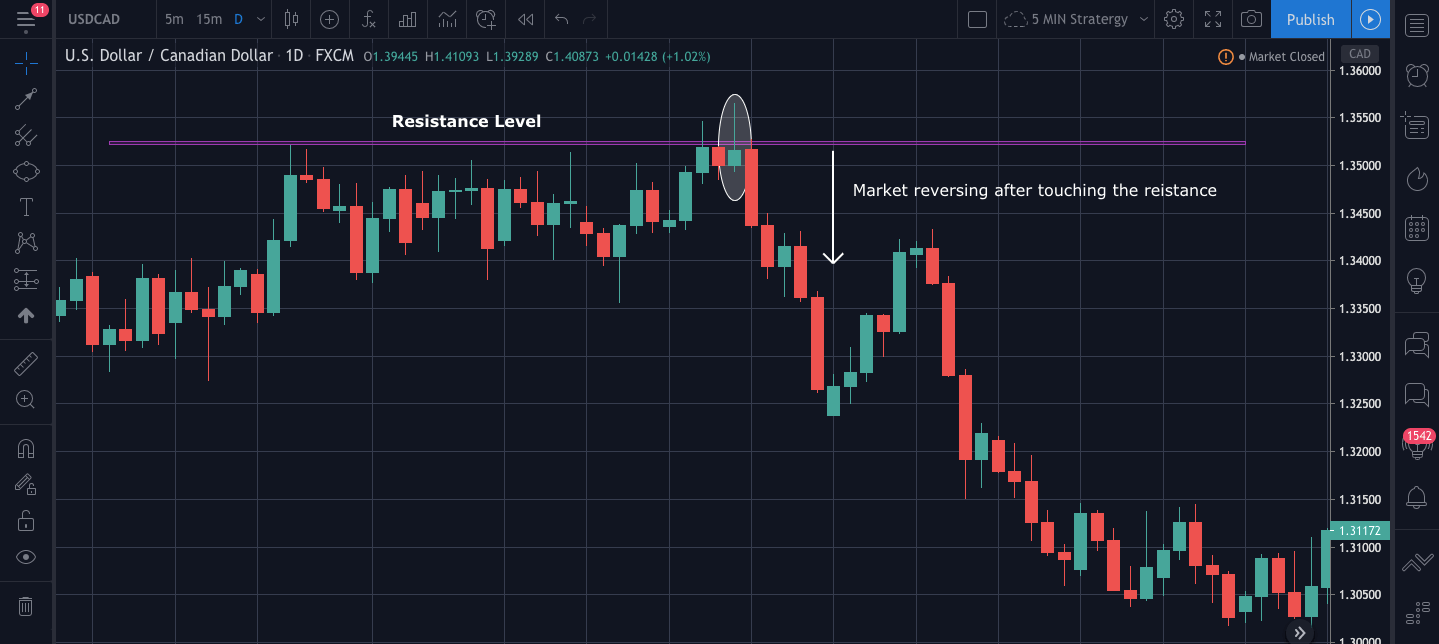
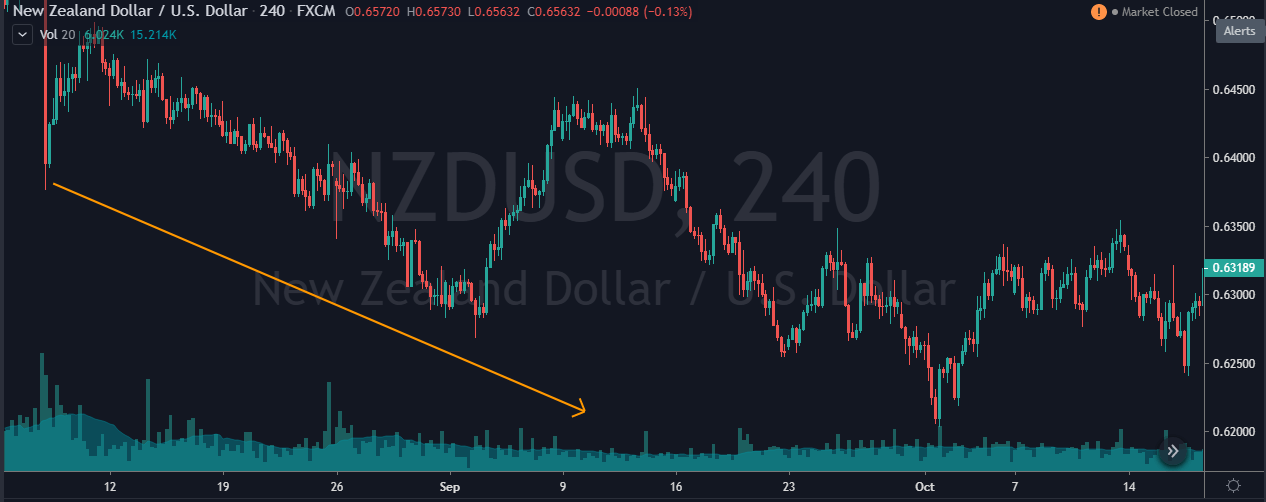
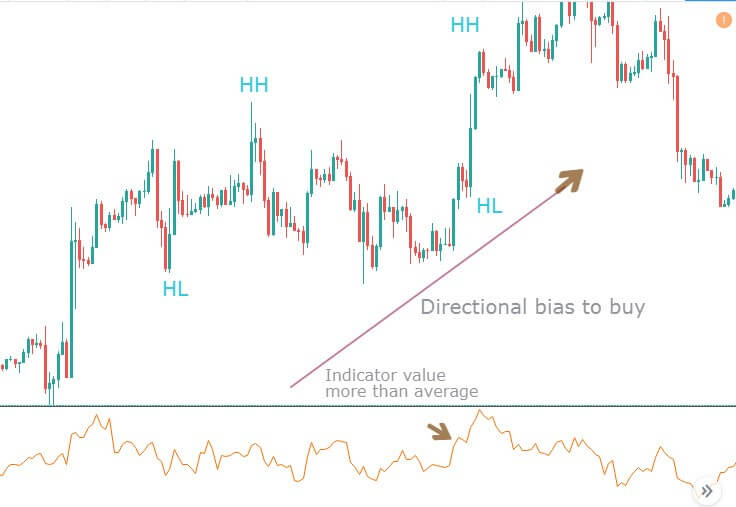
The objective of an indicator is to serve as a reference, for example, to detect a trend. Indicators are not the panacea or magic, they are just markers on the way to reach our goal. You have to see it as clues so that everything develops in the best way and get an advantage, but remember that the key is to work with different systems.

Defining Risk Strategy

Defining risk in our trading strategy is not that it is important, it is that it is basic and fundamental. Your system should consider how much you will buy or sell an asset and how much is the maximum you can lose. The maximum amount you can lose can be calculated in euros or dollars or you can calculate it in % of your account. I recommend that you do it in percentage terms to avoid constantly adjusting.

Many traders start to consider how much they can lose once it’s happening, as at first, they believe it’s something that won’t even happen. Incredible but true. This puts them at risk for more money than they can actually assume. Set a maximum percentage you can lose in your trading strategy (depending on your actual risk tolerance), it will help you keep your feet on the ground.

Configuration of Parameters

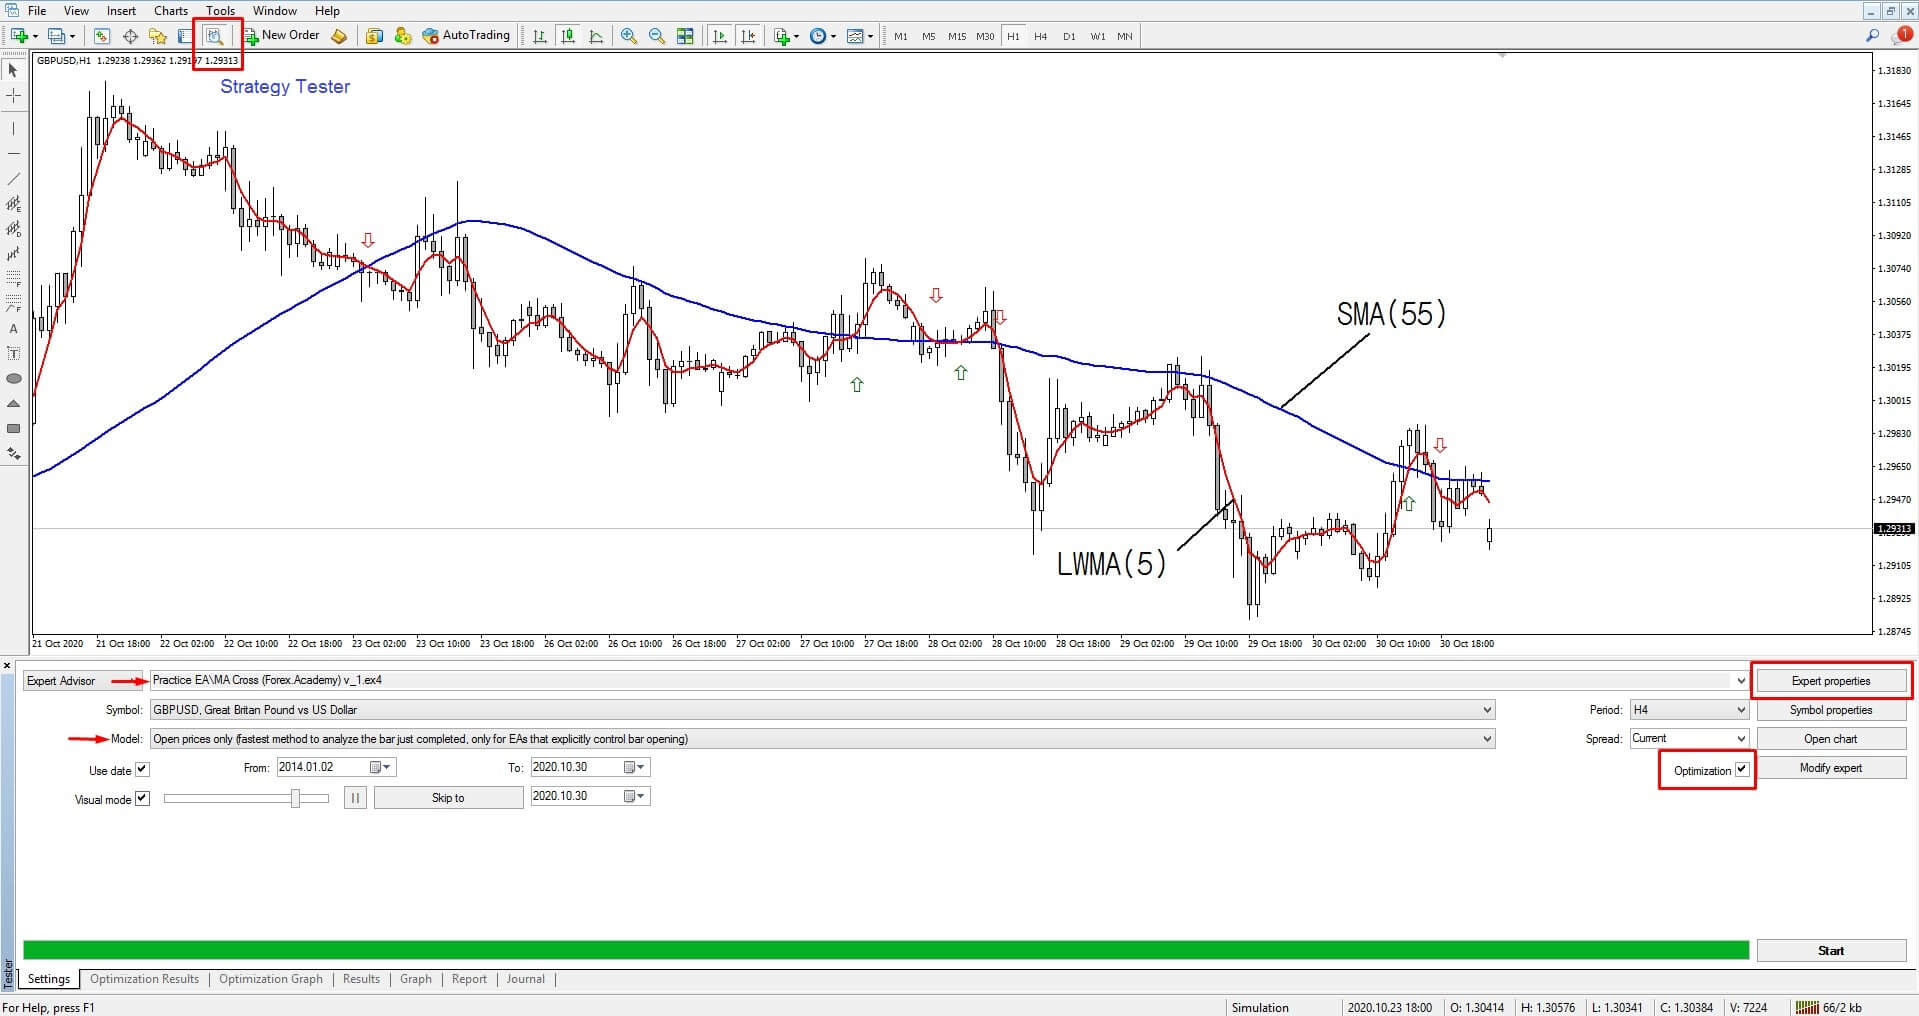
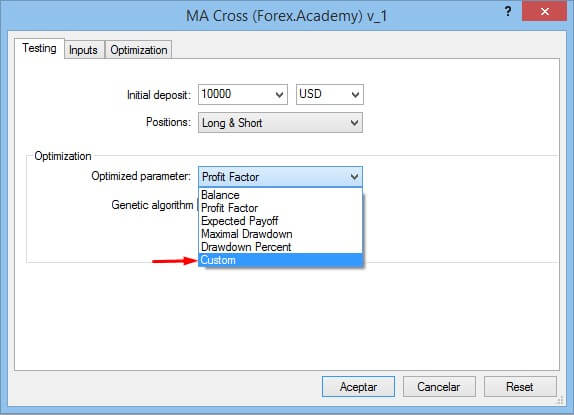
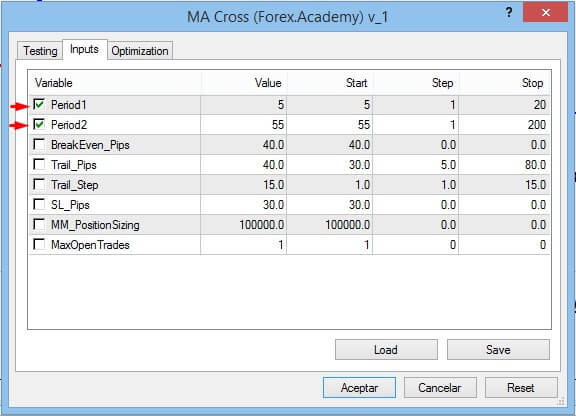
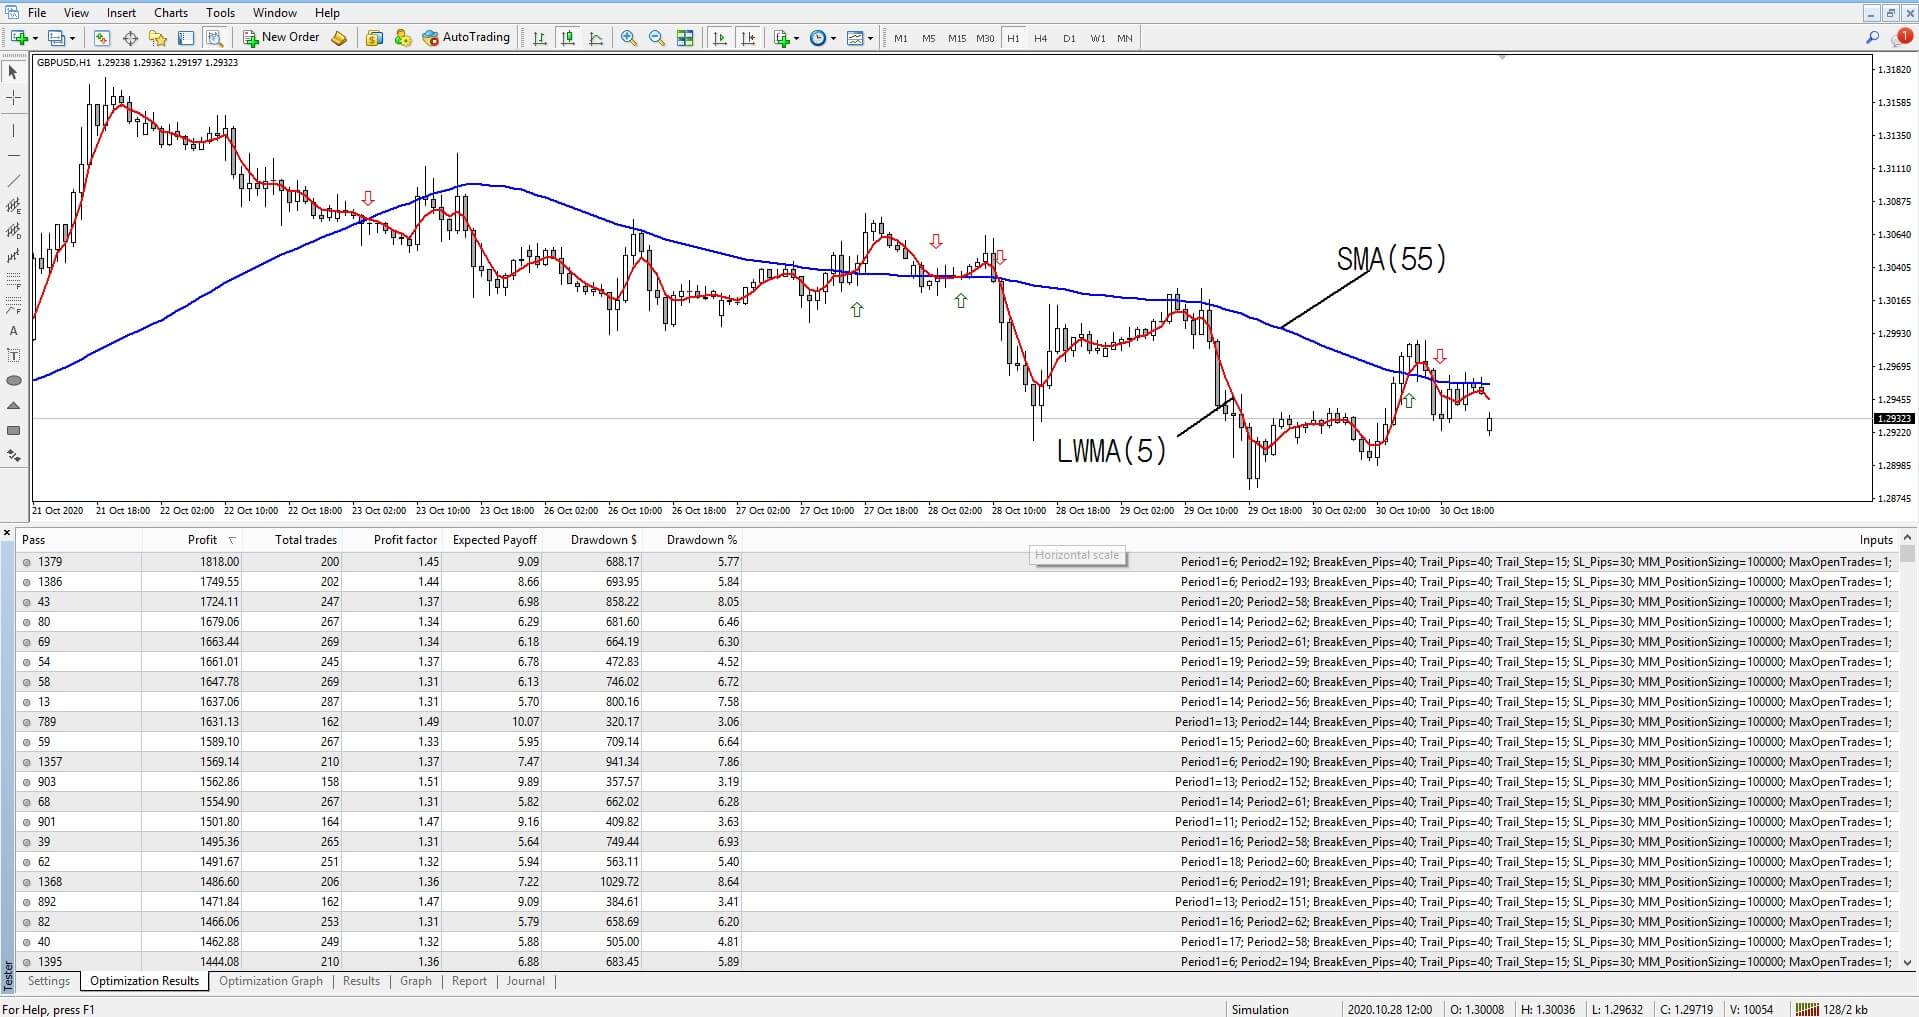
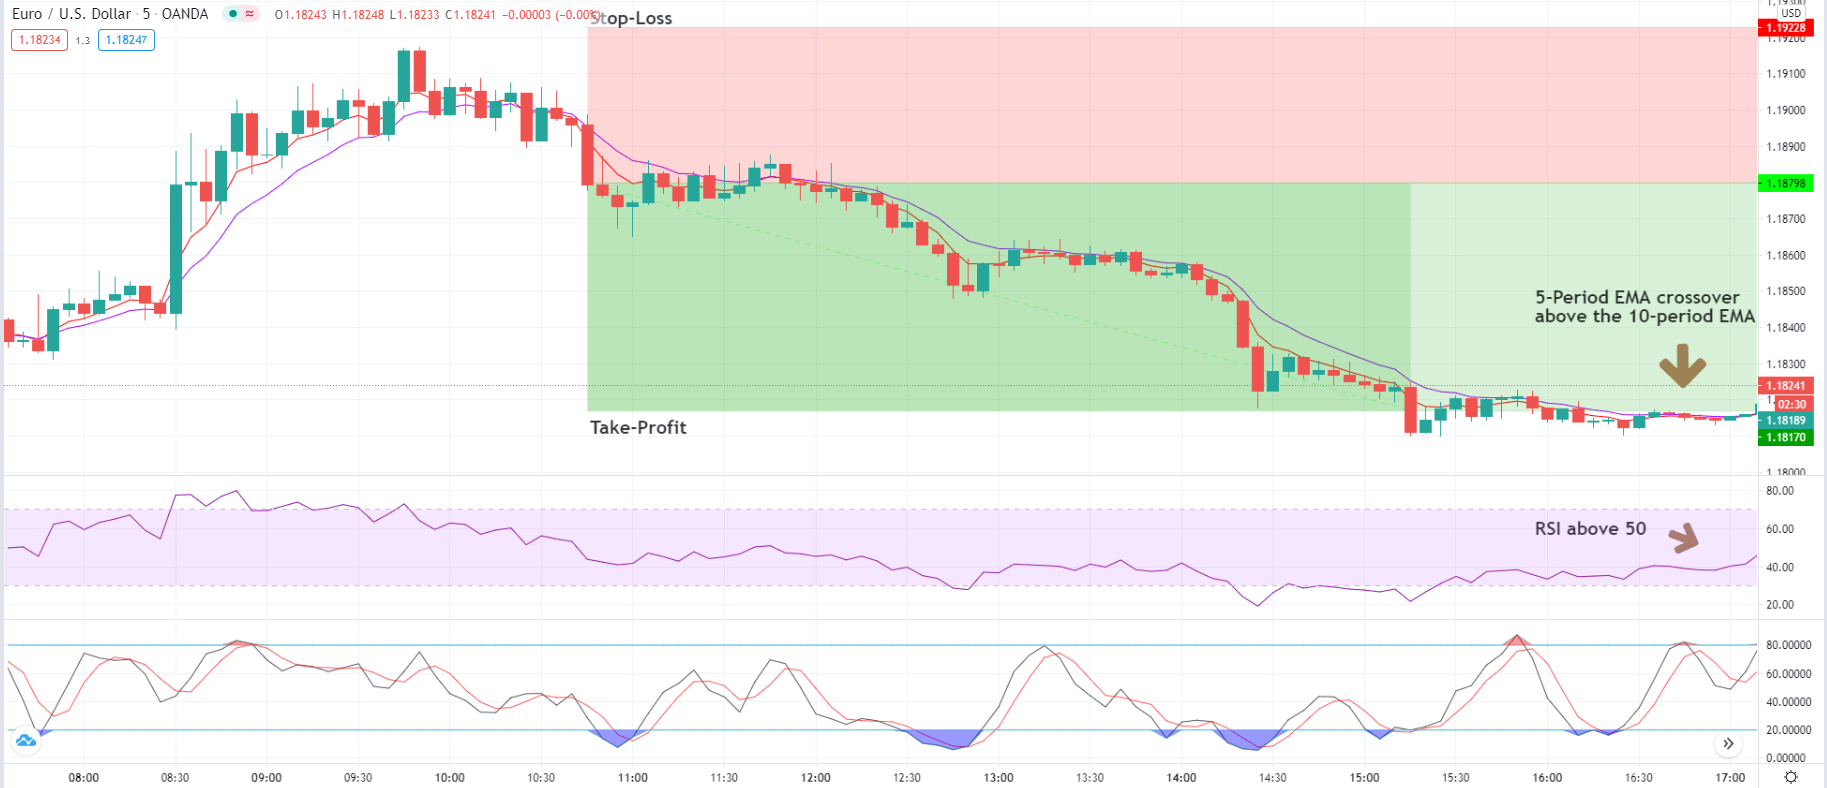
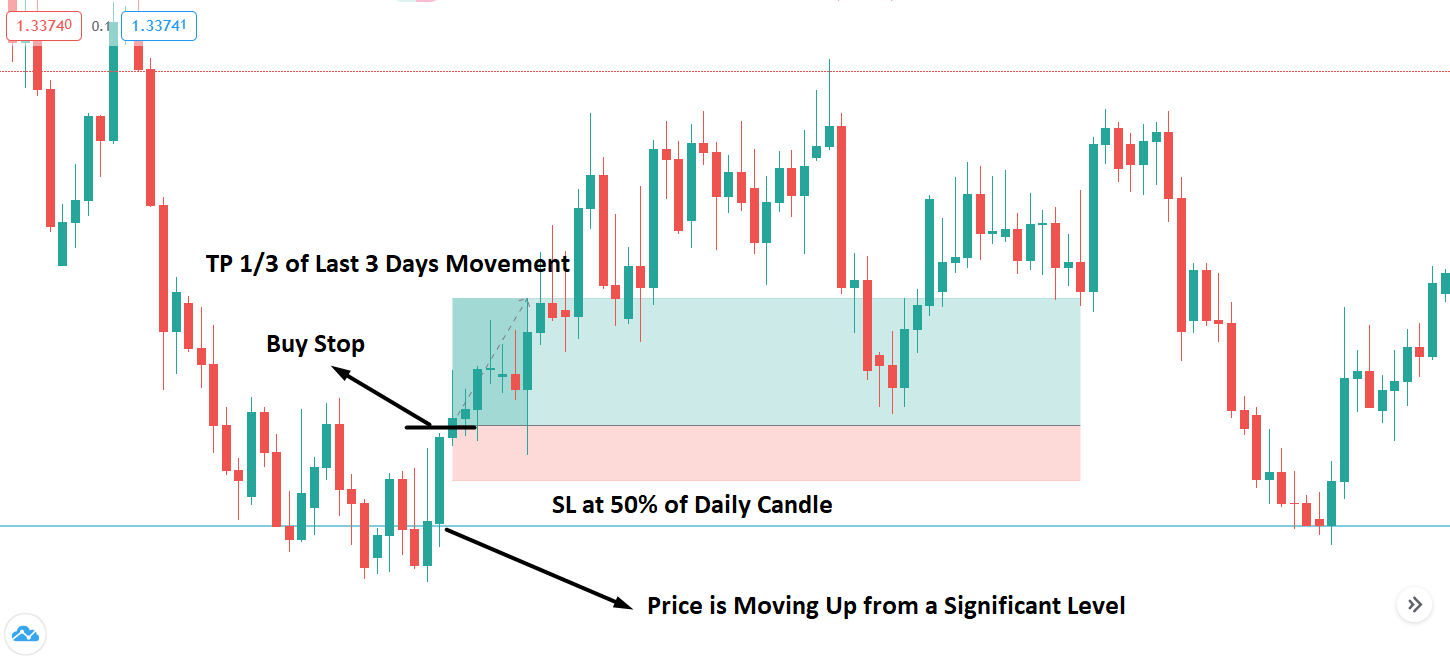
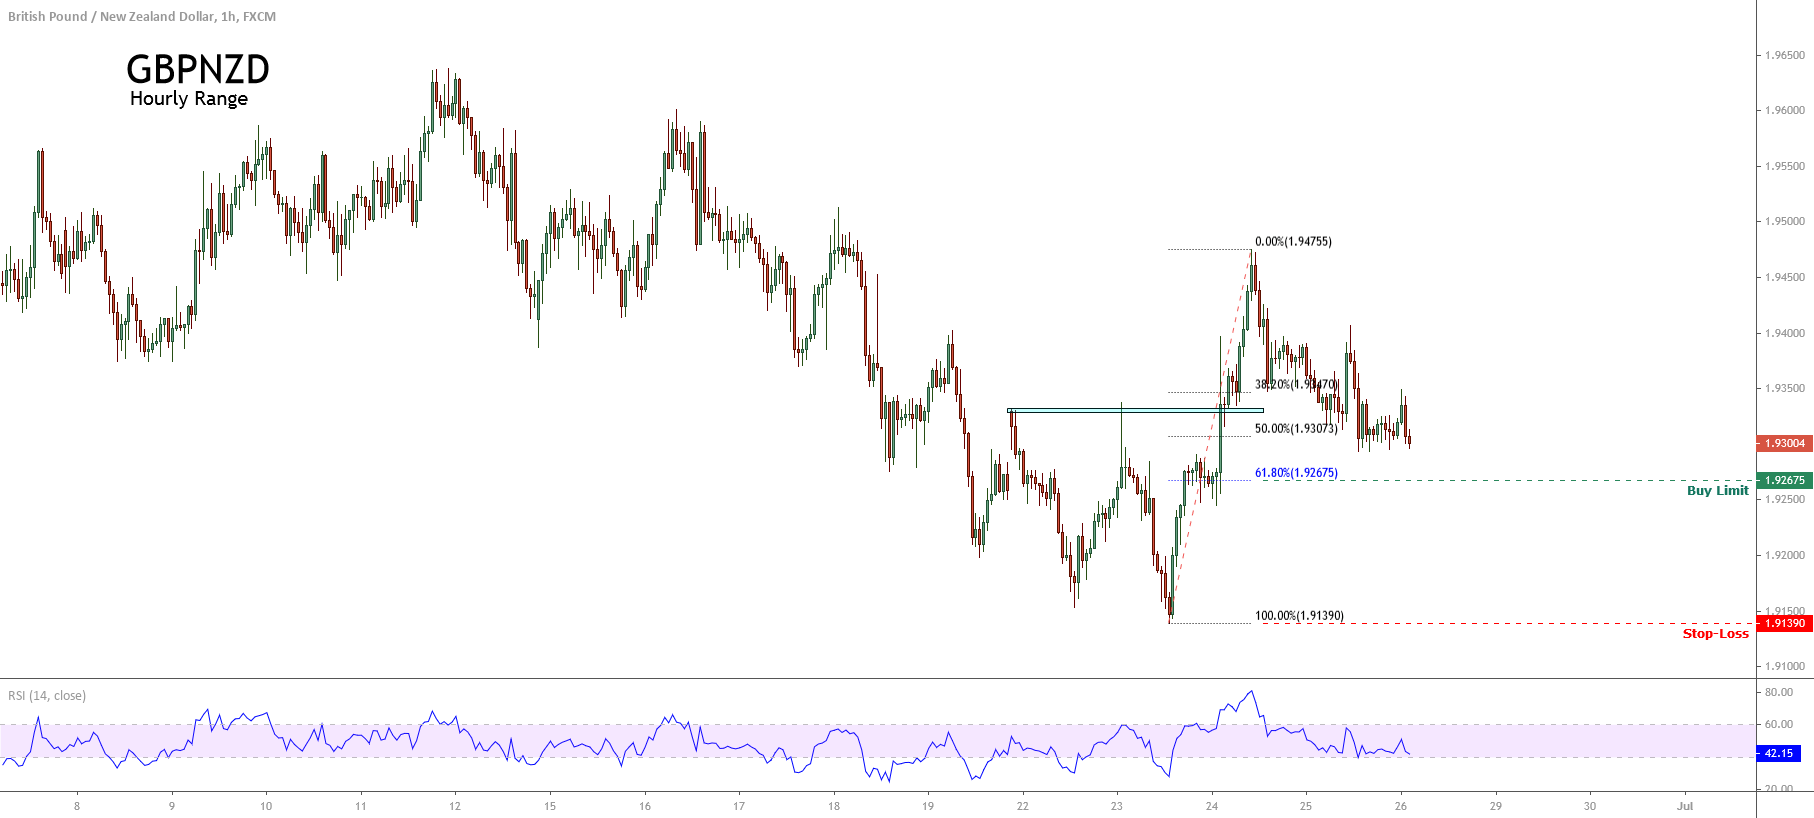
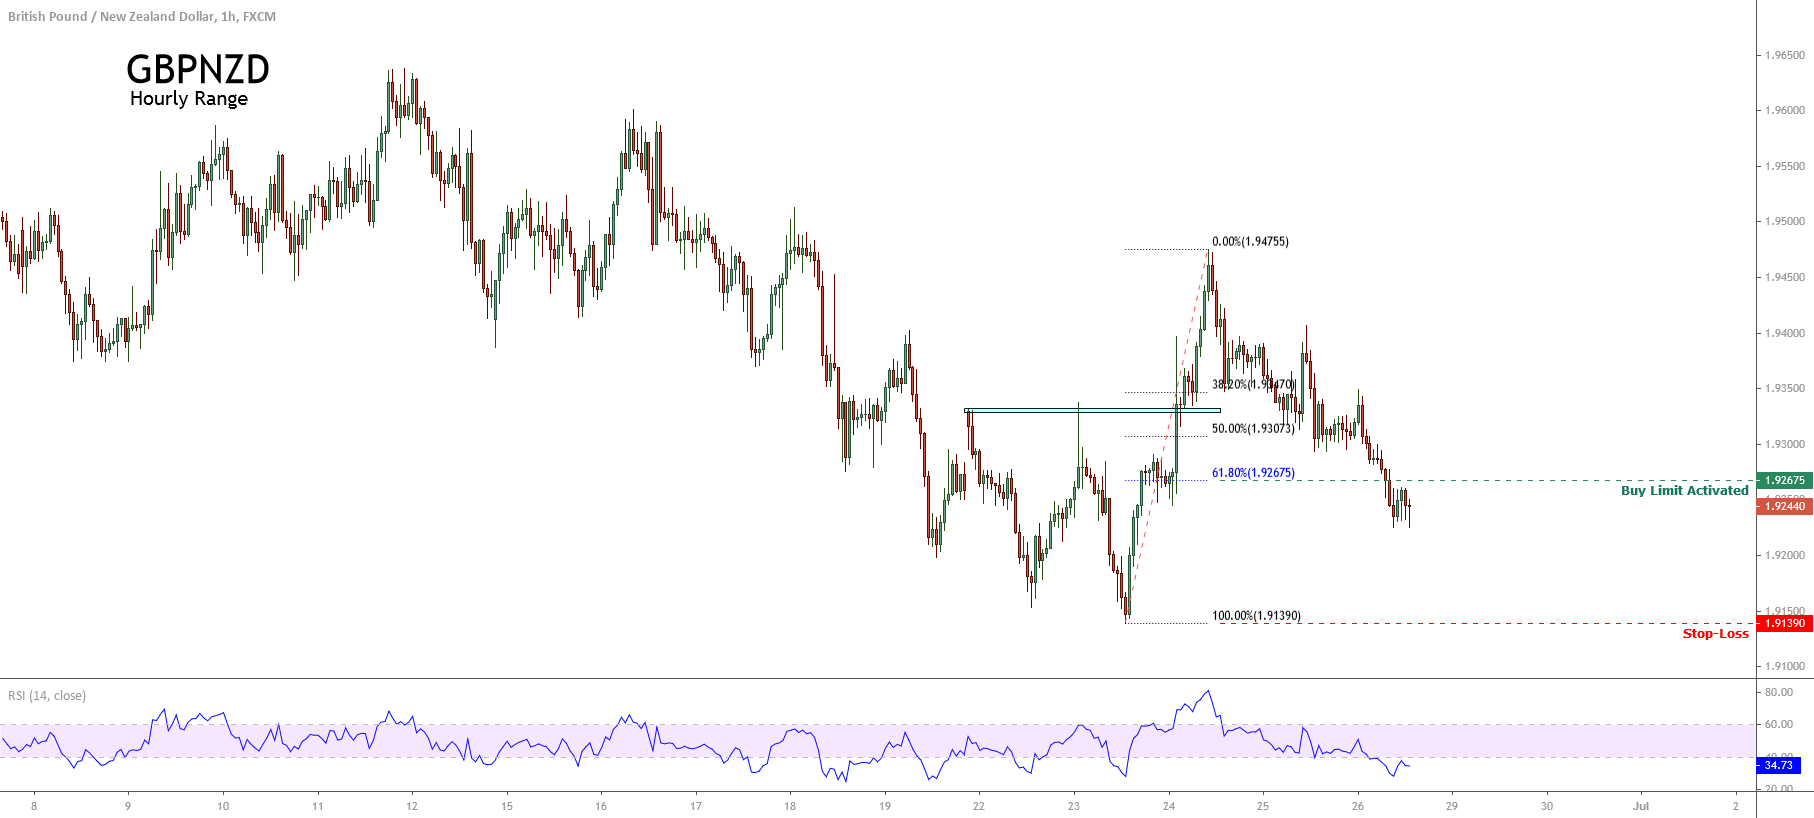
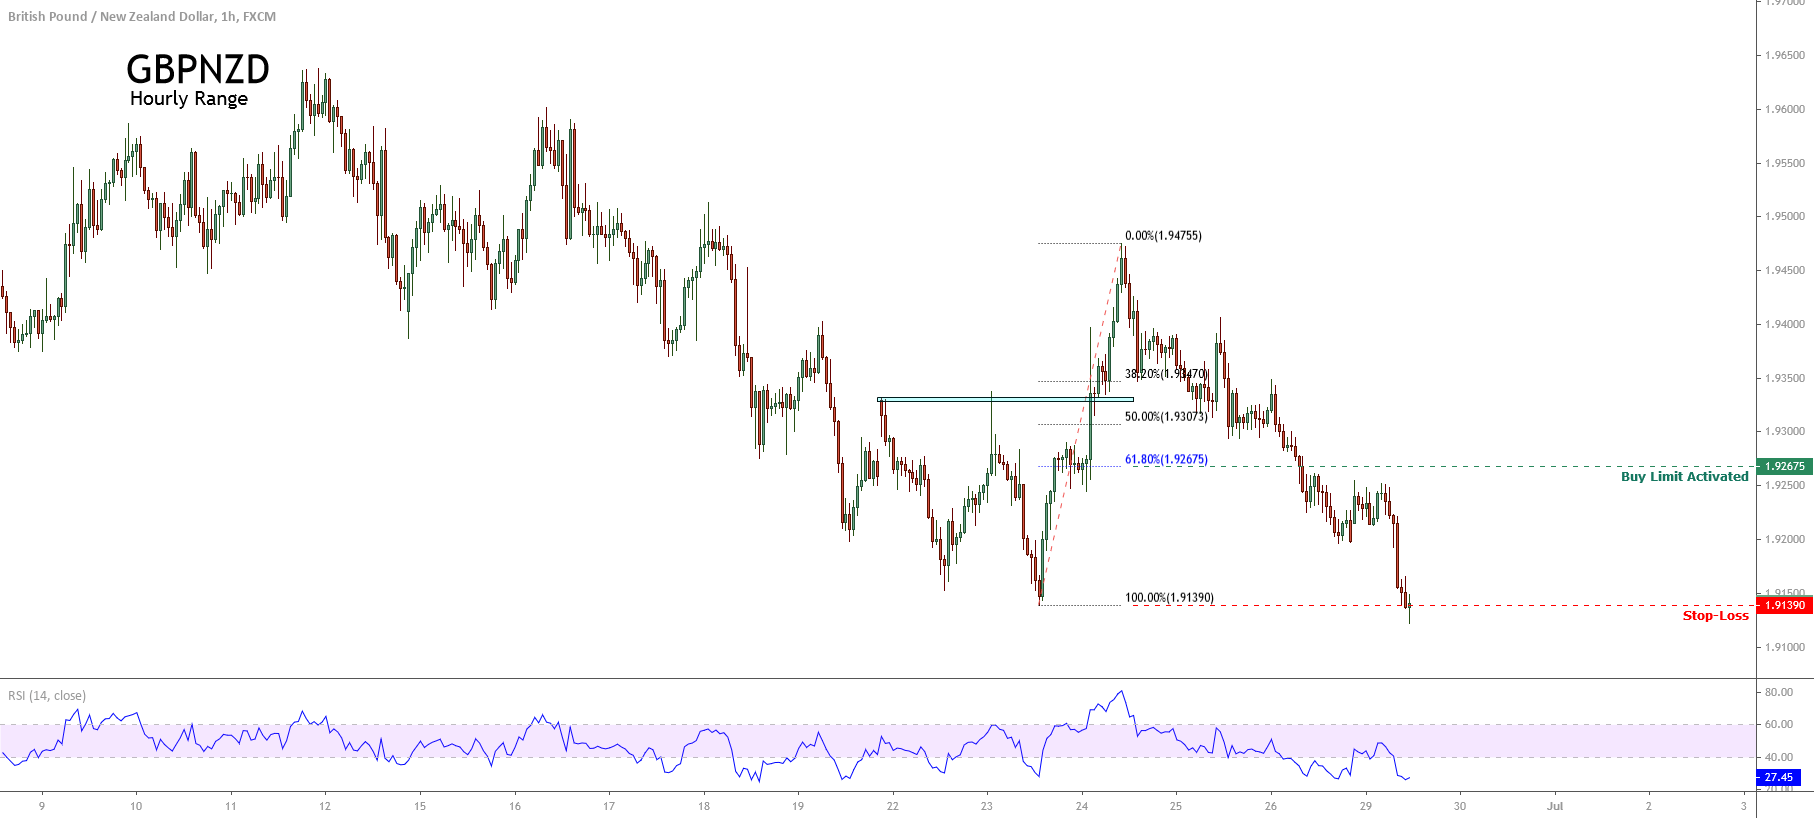
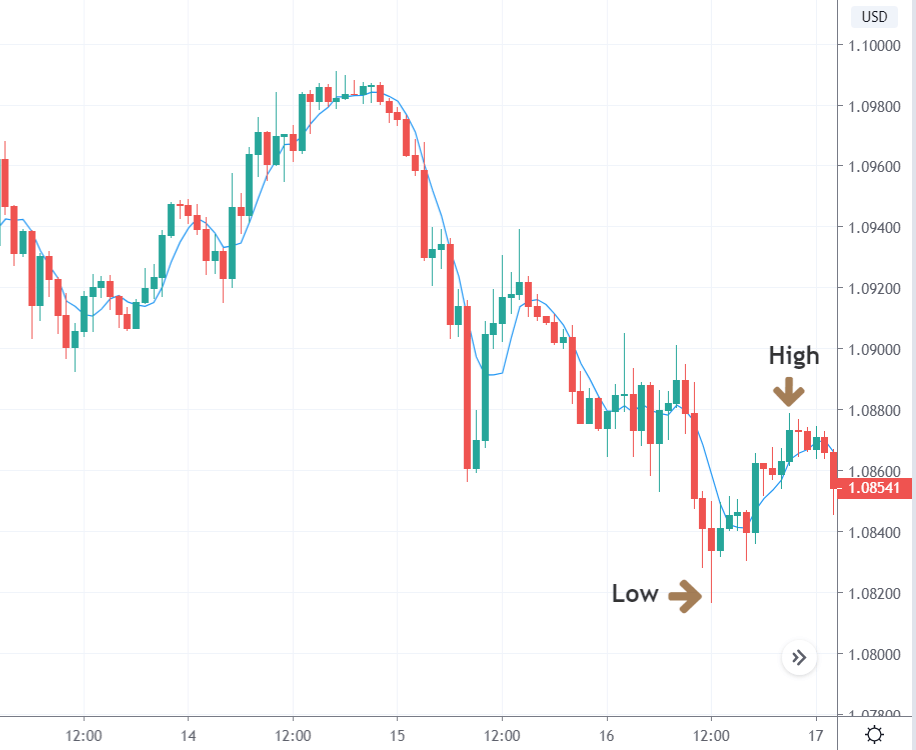
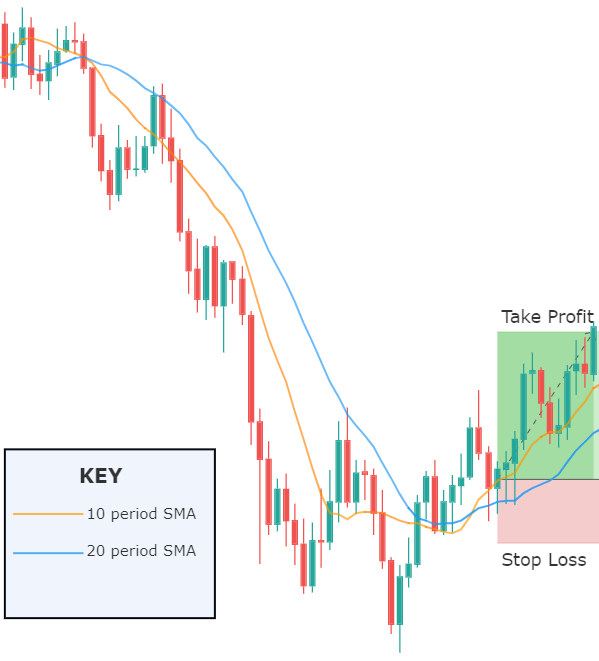
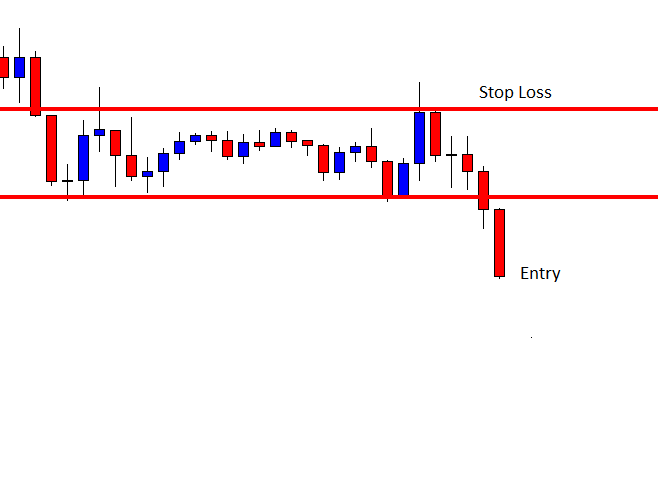
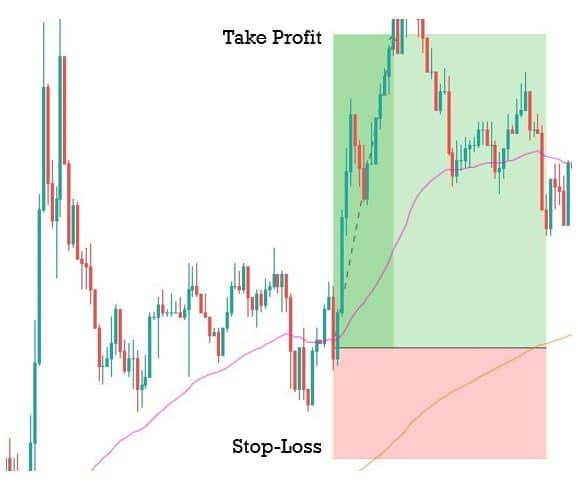
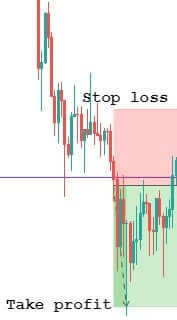
Where will you place the stop loss? And the take profit or target of each operation? What will be the settings of the indicators you will use? For example, if as I said in the previous example you use a moving average. How many periods will it be? It is important that all of this is well-set, clear, and objective. This way you will have a perfectly defined trading strategy that will not make you think or doubt its execution.

Write Your Strategy

Could you explain your strategy to someone in a simple way? One thing that is often said is that your strategy should be able to enter a post it. Maybe it’s a little radical, but in essence, the shorter and simpler, the more robust and more likely it will work over time.

Writing your strategy is something that will help you understand it. Imagine if you had to tell someone to program it for you. You should be very objective and avoid statements like “much, high, little or low”. You will have to define very well how much is that much, that high, that little, or that low. That will help you not to sabotage yourself and to have the mental clarity to act accurately in reality. Whether you’re operating manually or automated.

[Extra] Keep Track of Your Operations

Many traders create a strategy and simply execute it. If it goes well they raise the amount until they can’t take any more risk, the position goes against them by little, and by going so exposed they blow the account. Others simply carry it out and if it is not profitable at first, abandon it.

Winning traders do not do this, they work with different strategies that monitor proper risk management. This means that your perception is not focused on a single strategy and that you will play everything to one card. You will have a more panoramic view, but remember that you must follow your strategies.

This point is important because it will help you establish criteria where you disconnect strategies that are not working. It’ll help you limit your losses considerably. Many traders live clinging to the idea that they need to be strong no matter what and stay true to your system. But of course, what if your strategy is no longer profitable? This is nothing new, there are trading systems that no longer have a statistical advantage in the market. That’s why working with a wallet is the smartest thing. So you can have some on the bench to replace the headlines when they flounder.

If you operate manually and you are starting to apply a system, quiet, it is good to start, but keeping control of each operation and its result can help you a lot and is basic. You can do this by connecting your account with platforms such as myfxbook, fxblue, etc.

Now you have a roadmap to follow to create your own system (without forgetting to monitor it). Remember that there are tools that make life easier for us and that can do all this for us.

Categories
Forex Basic Strategies

Undeniable Proof That You Need A Trading Strategy

If you are new to trading or are simply thinking about joining and have spoken to another trader, they most likely would have asked you what strategy you are using. While for many it is quite a straightforward question to answer, for others it is not quite so simple. There are thousands of different strategies out there, and some traders even trade a hybrid of more than one strategy at the same time. What is important though, is that you have a strategy, no matter what it is, it is imperative that you have one, and we are going to be looking at why it is so important to have a strategy, no matter what it is.

Gambling Is A Loser’s Game

If we are to trade without a strategy, we are effectively just gambling. There is no other way to describe it. You are taking a wild guess at what the markets will do or you are using a hunch, but that hunch is based on no real facts or figures. Due to this, you are simply placing your bet and hoping that the markets go the right way. The problem with this is that the markets like to move how they want to move and they do not always move in one direction for long enough for a gamble to be effective. What’s worse is that if your first trade losses, you will simply place another trade with no real reason behind that one either. You need to lose a strategy, the strategy gives you rules to follow and ensure that your trades have the best opportunity to profit, rather than simply placing trades and hoping that it is a loser’s game through and through.

Strategies Give You Rules

One of the things that a strategy will give you are rules, house rules are there to ensure that your trades are consistent and that the trades that you are putting on have the best opportunity to be profitable. When we have a strategy in place when we place a trade that is not in line with the rules that we have set out we consider it a bad trade. We are trading outside our strategy and so the profitability factor or risk and reward ratio of that strategy is no longer accurate making it far harder for us to keep track of how well the strategy is doing or how well we are doing as traders as a whole. Once you have set rules, stick with them, this is the best thing that you can do in order to ensure that you remain profitable.

Strategies Give You Stability

The rules that we set out above are there to give us stability. Those are the main reasons behind them, and due to that, using a strategy gives us a lot of stability when it comes to our trading. It makes us consistent in the trades that we are making. It ensures that we are always placing good trades and ultimately it can make our profits and overall capital a lot more stable.

Strategies Protect Us

A major part of any strategy is the risk management that comes with it. The risk management part of strategies are there to help protect your account, they include things like your risk to reward ratio, stop loss locations, and other elements like that. All designed to limit the amount that you can lose with each trade and to ensure that you do not blow your account too quickly. We need to trade with risk management within our strategies, if we don’t, no matter how good a strategy actually is, a single trade can actually cause you to completely blow your account.

Strategies Help You to Focus

One fantastic thing that strategies help us to do is to focus, they help us to avoid distractions and they help us to concentrate on what it is that we need to be doing, rather than looking elsewhere. We know what we are looking for in the markets, and exactly what we need to do. This really helps us to focus on what we are doing which in turn can make us a lot more efficient in our trading.

They Can Save You Time

When you use a trading strategy you will know what you have to do. This will help to save you time from analysing or looking at things in the arts that you certainly don’t need to. Much like when we mentioned keeping focus above, using a strategy can help you to save time as you are focused on what you are doing. It also helps you to avoid some distractions. There have been plenty of times then we have wasted a lot of our time by looking at things that are completely irrelevant to our actual trading, the strategy helps you to avoid doing this. At least not all day like we have been guilty of before, ending up with no trades for the entire day.

They Help You Learn

Many people think that strategies are only there to help us to trade, but they also help us to learn. They help us to better understand why the markets may be moving the way that they are and they help us to better understand the way that we trade. The more strategies that you learn and understand, the more of an understanding of the overall markets you will have. Multiple strategies also give you more of an opportunity to trade in different trading conditions, allowing you to be far more profitable throughout the year than you would using just one or even no strategy at all.

Those are just some of the reasons why you should be using a trading strategy, they can be relay helpful in your trading, your results and overall they are what make us traders, as long as you are using one you should be on a positive step towards being profitable, just try to avoid trading without one, that is simply gqambling and will only lead to losses in the long run.

Categories
Forex Basic Strategies

The Most Reliable 5-Minute Forex Scalping Strategy

Introduction

Scalping is a type of trading that involves placing many trades in a single day to profit from minor price changes in the Forex market. Traders who use this strategy are known as scalpers. It is crucial to have a robust exit strategy for scalpers to earn large gains from small market moves.

Scalping strategies are mostly applied to the intraday markets, and the trade holding duration can vary from a few seconds to minutes. For novice Forex traders, this type of trading is not recommended as scalping involves a fast-paced activity that requires precision in timing and execution.

We must always use a smaller timeframe such as a 5-min or 1-min for scalping the Forex market. We can use various reliable indicators for scalping, but in this article, we’ll learn how to scalp the 5-minute timeframe using Bollinger Bands.

Why Bollinger Bands?

Bollinger Bands is a technical analysis tool that was developed by John Bollinger. This indicator is composed of three lines as follows – A Simple Moving Average, which is the Middle band, the Upper Band & the Lower Band. The usage of Bollinger Bands indicator goes like this – the closer the price action moves to the upper band, the more overbought the market. Likewise, the closer the price moves to the lower band, the more oversold the market. The bands in this indicator widen and contract based on the market volatility. They expand when the market activity is increased and contract in choppy or less volatile markets. Let’s use this indicator in the 5-min timeframe to identify potential trading opportunities.

Scalp Trading With Bollinger Bands

We must go long when the price hits the lower band and look out for short-selling opportunities when prices hit the upper band. This is the traditional way of trading the market using Bollinger bands which is still being used by scalp traders across the world. The reason why this strategy is famous is because of its ease of usage and its ability to milk quick buck from the market.

Scalping Ranges – Example 1

In the below price chart, you can see that we have taken five buying and four selling trades in the EUR/NZD Forex pair. In this example, we have applied this strategy in a ranging market. When the price approached the support line, and when it also hit the upper Bollinger band, it is an indication for us to go long. Similarly, when the price goes near the resistance line in a range, it is an indication for us to close our long positions and look for selling opportunities.

By doing this, we have been continuously engaged in the market and made some consistent profits overall.

Example 2

Below is another example of scalp trading the Forex market when it is in the consolidation phase. Typically in a range, both the parties have equal strength. Also, it is a known fact that it is comparatively hard to trade the consolidation markets than the ranging markets. However, using this strategy, we have managed to take five buying and three selling trades in the GBPJPY Forex pair.

Scalpers typically go long or short when the price approaches the upper or lower range lines. This is the right approach, but by pairing that strategy with an indicator like Bollinger band can drastically increase the probability of those trades. The USP of the Bollinger band indicator is that it works well in all the types of market situations. It really doesn’t matter whether you scalp the ranges, channels, or even trends; this strategy will always provide reliable trading opportunities.

Example 3

In the below price chart, the price was dragging towards the upside, indicating a buying momentum, but it ended up forming a channel. In a channel, both parties hold equal power and us being scalpers; it is easy to make money from both sides. Below we can notice that if we go either long or short, we can make an equal amount of money if we are right. This is the major benefit of using Bollinger bands in channel conditions.

Scalping Trends – Example 1

Below is the price chart of the AUD/JPY currency pair in an uptrend. As you can see, during the pullback phase, the market gave us the first buy trade. When the price action approached the upper Bollinger band, the price immediately moved in the opposite direction. As a scalper, prepare your mind for these kinds of quick moves. Follow the rules of the strategy to the point, and if any trade goes three to four pips against you, immediately exit and wait for the next opportunity.

Our third buy trade also performed, but it didn’t go for bigger targets. Instead, the price action immediately reversed, which end up generating a sell signal. The next buy trade was also ended u with minor profits. For scalpers, even a profit of 8 to 10 pips can be considered good in a single trade.

Example 2

Below is an example of buying and selling trades in an uptrend in the AUD/JPY pair. We are saying this pair is an uptrend after analyzing its higher time frame. In the lower timeframe, the market may seem to be ranging, but since we know that this pair is up-trending overall, we must consider buying opportunities over sell signals.

The markets gave us five buying and three selling trades in this pair. Even though we have identifies many sell signals, we recommend not to enter those unless you have confirmation. Always remember that trend is your friend and trade according to the trend. This is the essence of scalp trading the trending markets. Therefore, when scalping trends, always go for bigger targets by following the trend. Also, expect less accuracy on counter-trend trades.

Conclusion

It requires a lot of practice to master scalping. Since the time frame is small, you must be quick in everything you do while scalping. Also, talking additional confirmations is not possible in this form of trading because of its swift nature. Please practice these strategies on a demo account before you apply them on the live markets. All the best. Cheers!

Categories
Forex Basic Strategies

FX Strategy Selection Is Everything: Here’s How to Choose Wisely…

Are you a new trader that’s still trying to figure out which strategy will work best for you? Or perhaps you’ve been trying something that just isn’t working well and you’re looking for a strategy that works better with your own personal trading style. Below, we will outline some of the most popular trading strategies, along with their pros and cons to help inspire any trader that needs to switch up their strategy. In this article, we will talk about the following strategies:

  • Price action trading
  • Range trading
  • Trend trading
  • Position trading
  • Day trading
  • Scalping
  • Swing Trading

First, you’ll need to understand that each strategy is unique in its own way. Some strategies require more of a time investment, while others won’t require as much time in front of your computer. You’ll also find more trading opportunities and different risk to reward ratios, depending on the strategy you choose. 

Price Action Trading

Traders that use this strategy typically look at historical price data on charts in order to form more technical trading strategies. In some cases, traders look at fundamentals like economic events, but they usually stick with historical data. The technique can be used alone or in combination with indicators. Traders use Fibonacci retracement, candle wicks, indicators, trend identification, and oscillators in order to define support/resistance levels for entry and exit points when using this strategy. One of the benefits of using this strategy is that it can be incorporated over short, medium, or long-term time periods, and several other options on our list fit within this category. 

Range Trading

Range trading traditionally uses technical analysis in order to define support and resistance levels that inform traders where to enter and exit trades. Traders often use oscillators in combination with this strategy, with RSI, CCI, and stochastics being the most popular choices. This is yet another method that can work with any time frame, but it does require a lengthy time investment per trade. There are some things to look out for, as the strategy is most successful when the market is calm with no detectable trend and it is very important to have a strong risk-management plan in case breakouts occur. On the bright side, there are many trading opportunities and there is a good risk-to-reward ratio with range trading.

Trend Trading

Trend trading is considered a simpler trading strategy with the goal of making profits by exploiting the market’s directional momentum. Traders using this strategy calculate their entry points using oscillators, while exit points are based on the risk to reward ratio. Multiple timeframes can be used, although this strategy most commonly used medium to long-term timeframes. 

Position Trading 

Position trading mainly focuses on fundamental factors and especially economic circumstances without paying attention to minor market fluctuations. This is a long-term strategy that judges entry and exit points based on technical analysis and other strategies. 

Day Trading

This popular strategy involves opening and closing one or more trades within the same trading day, making it a short-term strategy in which trades are opened from minutes to hours within the same day. Traders use different means to determine entry and exit points when using this strategy.

Scalping

Scalpers try to profit from small price changes by placing multiple positions per day. This short-term strategy prefers more liquid forex pairs because they generally come with tighter spreads. Scalpers define entry and exit points by defining the trend, often in addition to using indicators and oscillators.

Swing Trading 

Swing traders hold positions anywhere from a few hours to a few days while attempting to profit from trending markets and range bound. Traders typically favor long-term trends as they provide more of an opportunity to capitalize. Once again, indicators and oscillators are primarily used to calculate entry and exit points.

Categories
Forex Basic Strategies

This Momentum Strategy Is Nothing Short of Amazing

Momentum is hard to catch. It’s like when you want to go to a party, you arrive and you see a queue of people to get in, you think the party must be great and you pay a pretty expensive entrance to get through. Then you come in, you order a drink and three minutes later the music stops and the party’s over. And there you are, looking silly, seeing how many have had a very “good time” but finding that you’ve missed it.

With a momentum strategy, if you don’t manage it well, it’s pretty much the same. You enter the market with expensive prices and a stop-loss that is far away so that a few candles after the supposed trend is over. Then, in this article we will analyze this type of strategies, to be able to adjust our radar better and thus take advantage of the party as long as possible.

What Is a Momentum Strategy?

A momentum strategy is part of the set of trend strategies. Following a momentum strategy is basically investing (taking long positions) in those financial assets that are showing a clear increase in their price. Those assets that are strongly bullish are bought in hopes that this bullish fortress will continue. In momentum strategies, the strength of movement is the key.

When to Choose a Momentum Strategy

The theory is that all assets have their momentum, you just have to know how to catch it in time. Following the simile of the party, in a city there are several discotheques, but curiously there are only some that – for various reasons- are fashionable and is where there are more people. The fashionable discos take turns, the one that was fashionable last summer, this one is no longer fashionable, but maybe it will be fashionable again in three years. The idea is to be able to find out what the reasons are that make a disco fashionable, or that a financial asset begins to rise so that they can enter in time.

Similarly, going back to the world of investment, we can see that momentum is not a permanent effect. Its duration is limited in time. This forces us to evaluate and alternate the elements of a momentum portfolio on a regular basis.

Absolute Momentum and Relative Momentum

If you analyze the momentum you can distinguish two situations. On the one hand, we have the impulse of the asset for itself ( time-series momentum), and on the opposite side, the impulse of the asset with respect to other values ( relative momentum).

Time-Series Momentum: Autocorrelation in Time Series

The autocorrelation level in an asset tells us if its past and future profitability are correlated. Put simply: the idea is that today’s profitability is related to yesterday’s profitability. In this case, if the degree of autocorrelation is high, it can be interpreted that we can estimate future performance.

Cross-Sectional Momentum or Relative Momentum

In this case, what counts is the profitability plus when we compare different assets. The idea is that those shares or assets that have a higher relative return continue to maintain this advantage over time.

One type of momentum is independent of the other. We can find that an asset shows a positive relative momentum (it is stronger than the others), but nevertheless has an absolute negative momentum (it is in a bearish trend). Conversely, you can also give an asset a positive absolute momentum but still have a negative relative momentum as there are other assets that are rising even further.

How to Measure Momentum?

Do not confuse a momentum strategy with the Momentum indicator. You can use the Momentum indicator to follow a momentum strategy, but you can also use other indicators of technical analysis (such as RSI, ROC, moving averages, etc.) or directly the price analysis.

The Momentum Indicator

This indicator simply shows the price difference between the current candle and the N candle days ago. The value of the Momentum indicator is expressed in absolute terms ( how many € or USD of difference in the quotation). If you prefer to express this difference in relative terms, then use the ROC ( Rate of Change).

The graphical representation of the Momentum indicator is an oscillator that fluctuates around a 0-neutral line. In technical analysis, attention is often paid to the oscillator crossings with line 0 and to the divergences between the Momentum oscillator and the price.

Momentum Strategy Values

In general, a momentum strategy will have good results in assets showing trend behavior. For example raw materials, some currencies, low capitalization stocks… According to some studies, the momentum has a longer duration and impact on those actions with lower capitalization and a lower BTM ratio ( book to market).

One way to know if an asset has a trending behavior, and then it might be a good idea to apply a momentum strategy, is to do the test that is detailed in this entry “Tendencial or antitendential system Which one to choose? “

Advantages and Disadvantages of a Momentum Strategy

Momentum is not a permanent effect. It’s not some kind of “buy and hold” strategy. We have to assess the assets on a recurring basis and if necessary modify the items we have in the portfolio.

  • Consequence 1: It is a strategy that needs regular attention.
  • Consequence 2: Attention to commissions according to the broker you work with.

In the case of following a momentum strategy with actions, the key is in diversification and in managing the risk of each position (as an example you can see this Momentum System for trading with actions). You don’t have stable returns. Investing in momentum is a long-term strategy. In some years it works and in others, it doesn’t.

Examples of Momentum Strategies

A simple example is to use the RSI – relative strength index – to signal inputs and outputs. Now we see that the purchase is made at the time the RSI is greater than 70 and the position is closed when the RSI is less than 30.

This other strategy applies the logic of momentum to commodity futures, rebalancing the portfolio of futures once a month: Momentum Effect in Commodities. Use momentum indicator crosses: Purchase order when the momentum indicator cuts up the 0 line and sale when the indicator cuts down. Strategies of “Dual momentum” where the absolute moment is combined with the relative one.

How? in this case it is started by using a relative momentum strategy while avoiding assets with negative absolute return (comparing the difference in return of the asset with respect to short-term bonds).

Categories
Forex Education Forex System Design

How to Optimize a Trading Strategy

Introduction

Once the developer successfully ends both the multi-market and multiperiod test of a trading strategy, he can move to the optimization process. However, there are some risks associated with its execution that the developer should recognize.

In this educational article, we’ll present the different stages of a trading strategy’s optimization process.

Preparing for the Optimization

After passing the multimarket and multiperiod test, the developer has verified that the trading strategy works. Therefore, he could move toward the next stage that corresponds to the trading strategy optimization.

Optimization is used to determine the optimal parameters for the best result of a specific process. In terms of trading strategy, the optimization corresponds to selecting the most robust parameter set of a strategy that would provide the peak performance in real-time markets. 

Nevertheless, selecting the highest performance that provides the most robust set of parameters can result in challenging work. This situation occurs because each set of parameters will correspond to a specific historical data range used in each simulation.

In this regard, the developer’s top parameter selection must be part of a set of evaluation criteria defined before executing the optimization process.

Risks in Optimization

The optimization has pitfalls that the developer must consider at the time of its execution; these traps can lead to increased risks when applying the trading strategy.

The first risk is overconfidence that the results obtained during optimization will produce the same market results in real-time. The developer must understand the strategy and each effect of the results obtained in each part of the optimization stage.

The second risk involves excessive overfitting of the strategy’s parameters. This risk is due to the execution of the optimization without considering the guidelines and appropriate statistical procedures.

Finally, using a wide range of parameters can lead to obtaining extremely positive backtested results. However, such positive returns generated during the optimization stage do not guarantee that they will happen in real-time markets.

Optimizing a Trading Strategy in MT4

In a previous educational article, we presented the development process of a trading strategy based on the crossings of two moving averages, which corresponds to a linear weighted moving average (LWMA) of 5 periods and a simple moving average (SMA) of 55 periods. 

This example considers the execution of an optimization corresponding to both moving averages, and the optimization’s objective will be to find the highest profit.

Before executing the optimization, the developer must select the Strategy Tester located in the toolbar, as illustrated in the next figure.

Once picked the trading strategy to optimize, it must select “Expert Properties,” where the developer will identify and define the parameters to optimize.

The next figure illustrates the “Expert Properties” box. In the first tab, the developer will select the Testing properties, where the “Custom” option will provide a broad range of outputs for each scenario obtained during the simulation stage. 

After the Testing selection criteria, the developer can select the parameters to optimize during the historical simulation. In the example, the parameters to optimize will be the fast (LWMA(5)) and the slow (SMA(55)) moving averages. The developer must consider that as long as it increases the parameters to optimize simultaneously, the simulation will increase its length of time.

Once the “Start” button is pressed, the Strategy Tester in the “Optimization Results” tab will reveal each parameter variation’s output. In the case illustrated in the following figure, the results are listed from the most to less profitable. 

The results also expose the Total Trades, Profit Factor Expected Payoff, Drawdown ($), and Drawdown (%), and the inputs for each historical simulation.

In conclusion, the trading strategy based on the cross between LWMA(6) and SMA(192) in the historical simulation returned $1,818 of profits with a Drawdown equivalent to 5.77% or $688.17. Likewise, these parameters are valid only for a 4-hour chart

Nevertheless, analyzing the criteria described by Robert Pardo, which considers that a trading strategy should provide three times the drawdown, the strategy should generate three times the dropdown, in this case, the parameters applied into the model returned 2.64 times more profits over the drawdown. 

Next Tasks After the First Optimization

Once the first optimization was performed, the developer should analyze the trading strategy behavior with non-correlated assets and its performance in other timeframes. 

If the strategy passes this stage, the developer could make a walk-forward analysis. Among other questions, the strategist should answer whether the strategy will make money in real-time trading.  He also should evaluate the strategy’s robustness, where he would determine if the strategy is sufficiently robust and ready to trade in real-time.

Finally, once these stages are successfully passed, the trading strategy should be tested with paper money before its implementation in the real market.

Conclusions

In this educational article, we presented the steps for executing a simple optimization corresponding to a trading strategy based on the cross between two moving averages.

Before starting to optimize a trading strategy, the developer must weigh both the risks involved by the optimization process and the optimization analysis’s objective as the results that the study will generate.

Finally, although the optimization process reveals that the trading strategy is robust, the developer must continue evaluating if it can generate real-time trading profits.

Suggested Readings

  • Jaekle, U., Tomasini, E.; Trading Systems: A New Approach to System Development and Portfolio Optimisation; Harriman House Ltd.; 1st Edition (2009).
  • Pardo, R.; The Evaluation and Optimization of Trading Strategies; John Wiley & Sons; 2nd Edition (2008).
Categories
Forex System Design

Starting the Testing Process of a Trading Strategy

Introduction

The development of a trading strategy requires steps to evaluate its reliability during its execution in real markets. To achieve this, the developer must develop a testing process to determine its robustness and viability as a previous step before its optimization.
In this educational article, we’ll introduce the steps of a trading strategy’s testing process.

Getting Started with Testing the Trading Strategy

Once the developer completed the programming of a  candidate trading strategy, it’s time to confirm if the strategy works as the conceptual model assumes. In this regard, the strategist should follow the following steps:

  1. Verify the preliminary profitability of the trading strategy.
  2. Assessing the robustness delivered by the strategy.

The robustness concept relates to the ability to continue generating substantial profits despite adverse market conditions, such as trend changes or extremely volatile conditions. An alternative method for verifying the strategy’s robustness is by assessing if it continues being profitable under a wide basket of markets.

Another critical part of the testing process is to verify the trading rules. As the strategy’s complexity increases, rules also increase in complexity. In this context, the developer must validate that the execution of the buy and sell signals happens at the levels triggered by the strategy’s rules. The verification of entry and exit signals will allow the developer to identify any programming error.

Analyzing Profitability

Once the programming stage is verified, the developer should estimate the trading strategy’s profitability considering a reasonably lengthy historical price series. 

As a guide, a short-term strategy may be tested using two years of price data, a mid-term would need up to four years, and a long-term up to eight years of historical data. Nevertheless, the window size may vary depending on the strategy type or the market conditions.

With this information, the strategist will have a panoramic overview of the trading strategy’s profitability and risk. In this regard, if the strategy’s performance is deemed acceptable, the developer could advance to the next stage of the testing process.

Nevertheless, if the strategy has a poor performance, the developer should judge if it could be redesigned or discard it.  

Finally, for a proper evaluation, the strategy must be run using a standard one unit trading size. This way, the profits would result in multiples of the risk.

The Multimarket and Multiperiod Test

The multimarket and multiperiod test corresponds to the last stage of the testing strategy’s performance. During this historical simulation, the developer must study a set of parameters of the strategy considering a small basket of diversified markets over a broad range of historical periods. In other words, the developer must develop a historical simulation taking a group of different assets using different timeframes.

The developer must select a small portfolio of non-correlated assets; in other words, markets that don’t relate to each other. An example of a non-correlated portfolio is a mix of a commodity, a bond, and a stock index.

Concerning the length of the test period, Robert Pardo suggests that to obtain solid results, the developer should use ten years of historical data for each market. However, it could start from five years of historical prices. Pardo’s figures are related to long-term stock trades using daily timeframes. Intra-day trading systems, as already stated, would require smaller data ranges.

The results obtained from the historical simulation will provide an objective overview of the trading strategy’s profit and risk.  Depending on the results obtained, the developer may terminate if the strategy is robust and produces reasonable returns or if it performs poorly and should be rejected. Likewise, the strategist may observe that the strategy presents mixed results, so it should not be rejected entirely.

Conclusions

During the testing process of a trading strategy, the developer must evaluate a broad range of aspects that ensure the correct work during its evaluation.

For example, the developer must verify if the opening and closing trades’ programming rules execute as the strategy requires. After this step, the robustness degree will drive the strategist to conclude if it is viable in real markets, needs improvements, or should be rejected.

Finally, on a multimarket and multiperiod test, the developer must evaluate the strategy’s performance in a small non-correlated portfolio using different timeframes. Once this historical simulation is made, the strategist would be able to confirm if the strategy is robust and viable or reject it before continuing with the optimization stage.

Suggested Readings

  • Jaekle, U., Tomasini, E.; Trading Systems: A New Approach to System Development and Portfolio Optimisation; Harriman House Ltd.; 1st Edition (2009).
  • Pardo, R.; The Evaluation and Optimization of Trading Strategies; John Wiley & Sons; 2nd Edition (2008).
Categories
Forex Education Forex System Design

How to Determine the Size on a Historical Simulation

The simulation of a trading strategy requires a historical data series to assess the stability of the strategy’s results over time. Likewise, the strategist must consider the strategy before determining the window’s size before starting the historical simulation.

This educational article presents the concepts that will allow developers to estimate the data requirements to assess a trading strategy’s stability through a historical simulation process.

Setting the Requirements of Historical Data

As said, the strategy’s simulation process requires historical price data. Of this data, the developer must select a test window to perform the evaluation.

In this regard, in deciding the size of the historical data window, the strategy developer should consider both the statistical robustness and the relevance of the data for the trading system and the market.

However, these requirements will not accurately determine the test window’s size, either in hours, days, or even months. Instead, they provide a guideline for selecting a range of data suitable for developing the historical simulation process.

Suffice to say that the data window selection will have a significant influence on the results of a historical simulation.

Statistical Requirements

In statistical terms, the data window’s length must be large enough for the trading strategy to develop a sufficiently large number of trades to allow the strategy developer to reach meaningful conclusions about its performance. 

On the other hand, the data window should be large enough to allow sufficient degrees of freedom for the number of variables used in the trading strategy.

The standard error is a measure used in statistical analysis. The strategist can use this value as a measurement of the sample size impact in the historical simulation.

A high standard error suggests that each trade’s result is far from the strategy’s average profit. On the contrary, a low reading would indicate that the variation in an individual trade result will be closer to the average of the strategy’s benefits.

In other words, the standard error provides the strategy developer with a measure of the reliability of the average win based on the number of winning trades.

Quantifying the Required Amount of Trades 

According to the statistical theory, the larger the sample size is, the more reliable the trading strategy’s historical simulation results will be. However, several technical factors, such as data availability, avoids getting as many trades as the developer would like. 

The number of required trades increases in long-term systems, which tend to trade less frequently. In this case, the best option is to search for a sufficient amount of trades; another option is to make the data window wider.

In this regard, the statistical theory asks for a minimum sample size of 30 observations to be statistically acceptable. However, the strategy developer must aim for a much larger number of trades because the minimum of 30 samples requires the phenomenon under observation to follow a gaussian distribution, with is unlikely the financial markets would do.

Stability and Frequency of trades

The stability of a trading strategy corresponds to its results’ overall consistency during the strategy’s execution. In this way, as the strategy becomes more stable, it will tend to be more reliable over time.

The developer can distinguish the trading strategy’s stability by verifying whether the trades are distributed uniformly within the test window. Likewise, the strategist can confirm that the strategy is more stable as the standard deviation of the size and duration of the profits/losses shortens.

The frequency of trades will influence the length of the trading window. Thus, the higher the trading frequency, the shorter the historical data needed for historical simulation. 

In other words, a fast trading strategy running in markets with high volatility will require a small data window, which could reach up to three years. By contrast, a slower trading strategy, such as daily trend following, will require a larger data window, exceeding five years. 

One rule of thumb is: The strategist should make sure the trading system be tested under all market conditions, Bull, bear, sideways markets – under high, medium, and low volatility.

Conclusions

The execution of a trading strategy’s historical simulation requires a data size enough for the developer to evaluate its profitability and stability.

A high-frequency trading strategy will require less data than a long-term strategy, which will require a significant quantity of data, which could exceed three years of data.

The standard error can be used to evaluate the simulation’s results and determine the historical data window’s validity.

The strategist should ensure the trading system is tested under all market conditions: Bull, Bear, Sideways, and under all volatility types in which it is supposed will be used live.

Suggested Readings

  • Jaekle, U., Tomasini, E.; Trading Systems: A New Approach to System Development and Portfolio Optimisation; Harriman House Ltd.; 1st Edition (2009).
  • Pardo, R.; The Evaluation and Optimization of Trading Strategies; John Wiley & Sons; 2nd Edition (2008).
Categories
Forex Education Forex System Design

Seeking Accuracy in the Historical Simulation

Introduction

A historical simulation may seem like a simple process to perform; however, it goes beyond creating trading rules and introducing them into the simulation software. Within the software itself, some limitations can diminish the accuracy of the results and, in this way, overestimate or underestimate the possible results that the strategy would achieve in the real market.

This educational article explores the importance of precision in the simulation process and some simulation software problems.

Importance of the Accuracy 

The developing process of a trading strategy that systematically creates trades can be tested on a historical simulation procedure with relative confidence and accuracy. However, like all software, it can be affected by precision and lead to errors, which can increase, especially when looking for a historical simulation.

In this regard, the developer should not rule out a possible error in the simulation software, nor can it leave to chance the computer simulation’s lack of precision, as this may drag unpleasant results to the investor. In consequence, the developer should address the software errors in the best possible way.

The developer must seek to make the simulation as realistic as possible to address the accuracy problem. To achieve the desired accuracy, the historical data exchange must be as close as possible to real-time executions.

Thus, according to Robert Pardo (2008), achieving greater accuracy in the historical simulation will require two things: understanding software limitations and using conservative assumptions about costs and slippage in their various forms.

Software Limitations

Ignorance of historical simulation software limitations can lead the developer to a false confidence sentiment or be overly pessimistic about the historical simulation results. The most common constraints are:

Rounding of Data

The absence of the actual market price for the use of data rounding may have a cumulative effect on market entry and exit orders, which could lead to a cumulative effect, both positive and negative, on the trading strategy’s performance.

The problem of rounding in the historical simulation may lead to recording orders that, on a real market, would not have been executed or orders that would have been executed in real-time but not recorded by the simulation. A second error is a recurring understatement or overstatement in the strategy’s profits due to rounding.

The developer must determine if the historical simulation results are consistent with its real market results.

Finally, rounding errors will significantly impact a strategy that seeks small profits per trade. On the contrary, the impact will be less on those strategies that are slower or longer-term.

Price on Limit Orders

This error is a recurring problem in simulation software, and, in particular, it is presented in counter-trending strategies, which use pending orders to enter the market. In other words, the countertrend strategy places a buy limit when the market is falling and a sell limit when it is developing a rally. Contrary to a stop order, the execution of the limit order is not guaranteed.

The problem arises when the developer performs the historical simulation, and the software assumes that all limit orders will be executed during the simulation. However, according to Perry Kaufman (1995), up to 30% of all limit orders are not filled.

Faced with this problem, the strategy developer must define a security level to ensure that the order will be filled, increasing the probability of execution in the real market. This additional rule might consider that the price penetrates an additional distance to consider the order as executed.

Finally, this rule will not necessarily ensure that all limit orders will be executed; however, it will produce a more realistic approach to the simulation process.

Conclusions

The historical simulation process may present some problems generated by the code that the developer should be aware of. These inaccuracies can create false confidence by overestimating the results or drive it to be too pessimistic due to underperformance. These problems are mainly price rounding and limit-order executions.

In the first case, price rounding may induce the simulation software to execute input or output orders at levels other than those filled in the real market. To overcome this limitation, the developer must verify whether the strategy’s results are the same as the strategy would obtain in the real market.

The second error arises from counter-trend systems making use of limit orders. In this case, the developer must consider that not all limit orders are filled in the real market. Thus, the simulation could lead to overestimating the strategy’s results, creating a false optimism of the obtained performance. To mitigate this problem, the developer could introduce an additional requirement of an extra distance that the price should penetrate for the limit order to be executed.

Finally, in view that historical simulation software has limitations, the strategy developer should verify whether the simulation results are similar to those obtained in the real market.

Suggested Readings

  • Pardo, R.; The Evaluation and Optimization of Trading Strategies; John Wiley & Sons; 2nd Edition (2008).
  • Kaufman, P.J.; Smarter Trading – Improving Performance in Changing Markets; McGraw Hill; 1st Edition (1995).
Categories
Forex System Design

How to Read a Simulation Report

Introduction

When the developer performs the trading strategy design, it evaluates through a historical simulation process to overview its results under certain conditions. However, once finished the simulation, the software delivers a series of data that could confuse the developer with a broad kind of information provided by the report.

In this educational article, we will present the main elements of the historical simulation report.

Essential Data of the Historical Simulation Report

Within the wide variety of platforms that allow historical simulations, there is a set of essential data that the software provides at the end of the simulation process. These data are grouped into three large blocks: Performance Summary, Equity Chart, and Trades List.

The following figure shows the example of a report of a historical simulation performed in Strategy Tester of MetaTrader 4.

The report presents three blocks, which are detailed as follows.

Performance Data Summary

This section provides summarized statistical data from the historical simulation of the trading strategy. The key performance indicators are as follows:

  • Total Net Profit: This is the financial result of all trades executed during the simulation period. This value corresponds to the difference between the “Gross Profit” and the “Gross Loss.” A reading above zero is indicative of a trading strategy with positive mathematical expectation.
  • Maximal Drawdown: This is the highest local maximum loss expressed in the deposit currency and percentage of the deposit. In general terms, this value should be as low as possible. The criterion of maximum permissible drawdown will depend on the risk target of the trading strategy developer.
  • Total Trades: Corresponds to the total number of trades executed during the historical simulation. The developer might consider this value to assess the level of aggressiveness of the strategy. Also, it can use it to value the strategy in terms of its operational costs. For example, a strategy with a high number of trades could be more aggressive for a conservative investor. In turn, it implies a high operational cost in terms of paying commissions.
  • Percentage of Trades Winners: This is the number of profitable trading positions divided by the total number of positions. 
  • Profit Factor: This is the relationship between Gross Profit and Gross Loss. A reading lower than 1 suggests that the strategy generates more losses than gains. On the contrary, if it is greater than 1, then the strategy provides more profit than losses for each currency unit invested.
  • Sharpe Ratio: Some historical simulation platforms of trading strategies provide the Sharpe Ratio. This indicator represents the expected return on a risk-adjusted investment of an asset. In general, investors tend to consider as risk-free return the rate of the United States Treasury bond. A reading of less than 1 suggests that the trading strategy provides more volatile results. In other words, the developer could assume that the trading system is riskier than another with a ratio greater than 1.

Balance Curve

The balance curve chart presents the cumulative result of the trading strategy using a line chart. The information provided in this chart represents the result of the strategy execution under conditions and parameters in which the developer carried out the historical simulation.

Considering the investor’s objectives, the developer could improve its performance by optimizing the initial parameters.

List of Trades

This section of the report shows in detail each trade that the strategy performed during the simulation period. This list usually shows the following data:

  • Date of entry.
  • Type of order (buy, sell).
  • Entry price.
  • Size of the position.
  • Date of close.
  • Closing price.
  • Profit or loss of the trade.
  • Profits and losses accumulated or Balance.


Conclusions

The historical simulation process provides an overview of trading strategy behavior according to the developer’s parameters initially defined. This information is reflected in the simulation report, which provides a wide variety of information about the strategy’s performance under predetermined conditions.

Within the information provided at the end of the historical simulation, there are key data that the developer should not fail to value these are: Total Net Profit, Maximal Drawdown, Total Trades, Percentage of Trades Winners, Profit Factor, and Sharpe Ratio, which some simulation software does not provide it. However, the lack of availability of this data is not a limitation for assessing the strategy’s performance but will depend greatly on the criteria and experience of the developer of the trading strategy.

The developer can use this information to confirm that the trading strategy is proceeding as specified initially. Also, it can use this data to understand the strategy’s behavior during each trade.

This information is also important to spot potential improvements in the strategy. For instance, you could detect that several large losses may be trimmed with a better stop-loss replacement. You could also find out that a good portion of the trades was closed at a less than optimal level. The developer may conclude that the system would greatly improve with a better take-profit algorithm.

Also, the information gathered from the simulation may help improve the entries. For instance, you could find out that there are large losses at the beginning of the trade most of the time. That could signal the entries flag too quickly, or you may notice that the strategy would benefit from early entries to improve profits.

Finally, according to the developer’s objectives and the information analysis, the developer could attempt to adjust and optimize the needed parameters that could improve the strategy’s performance.

Suggested Readings

  • Pardo, R.; The Evaluation and Optimization of Trading Strategies; John Wiley & Sons; 2nd Edition (2008).


Categories
Forex Education

Getting Started with your First Historical Simulation

Introduction

In the previous section, we learned the steps to create a trading strategy. At this stage of the trading strategy development, we will focus on the strategy’s simulation process using historical data.

What is the Historical Simulation?

The simulation is defined as a mathematical representation that describes a system or process, making it possible to generate forecasts of such a system.

As the years have advanced, computational technologies have evolved to allow many processes simultaneously performed.  Compared to what a processor could do 40 years ago, a mere smartphone outruns any of them. In this context, the trading strategies simulation has also done so, moving from the simulation using printed paper charts to the current computer systems we observe today.

By running a historical simulation on a trading strategy, the developer should be able to estimate the gains and losses the strategy would have generated under historic market conditions within a given period.

However, while the benefit of executing a historical simulation enables one to estimate the profits and losses and whether the strategy is profitable or not, this statement should be analyzed by the developer throughout the trading strategy developing process.

Getting Started

Once the developer has completed a trading strategy, including entry and exit rules, as well as the definition of risk management and position sizing, it is necessary to formulate the rules of the strategy using a computer language. This way, the trading simulation software will execute the rules algorithm and apply it to the study’s financial dataset.

Several programming languages are able to carry out the trading strategy simulation, such as MQL4 of MetaTrader, Easy Language of Trade Station, or Python. However, for this educational article, we will continue to use the MetaTrader MQL4 language.

First Steps in the Simulator

MetaTrader 4 offers its Strategy Tester to simulate trading strategies. In the following figure, we observe the Strategy Tester terminal, in which we can develop a historical simulation of any trading strategy under study. 

The figure highlights that Strategy Tester has a user-friendly and intuitive interface for the developer, who can select the Expert Advisor that will contain the trading strategy to simulate. Similarly, the user can choose both the financial market, the timeframe, and the date span in which the simulation should run.

Running the First Simulation in Strategy Tester

In this example, we will continue using a moving-average-crossover-based trading strategy. To recap, this strategy is based on the following rules:

  • A buy position will be opened when the 5-hour weighted moving average (LWMA) crosses above the 55-hour simple moving average (SMA). 
  • A sell position will be activated when the 5-hour LWMA crosses below the 55-hour SMA.
  • The buy position will be closed when the LWMA 5-hour has crossed below the SMA 20-hour.
  • The sell position will be closed when the LWMA 5-hour has crossed over the SMA 20-hour.
  • The position sizing will be a constant 0.1-lot.
  • Only one trade at a time is allowed.

The criteria for the execution of the historical simulation are as follows:

  • Market to simulate: GBPUSD pair.
  • Timeframe: 1 hour.
  • Simulation range: from January/02/2014 to October/02/2020.

From the simulation’s execution, we observe the following result provided by the Strategy Tester at the end of the simulation.

From the above figure, we note that the balance line was reduced by $2,230.63 from the initial balance of $10,000, reaching a final balance of $7,769.37. This result leads us to conclude that the average-crossover strategy is not profitable. However, this is just a preliminary result.  It is still possible that we could make this strategy profitable through an optimization process, where we will assess what parameter values perform the best.  We could also add stop-loss and take-profit targets that statistically boost the system into profitable territory.

Conclusions

In this educational article, we have seen the first steps to perform a historical simulation. This process provides the developer with an overview of the strategy’s performance in a given financial market under certain conditions. We highlight that the performance conditions could repeat in the future. For this reason, once evaluated the strategy feasibility in terms of profitability, the developer should test the trading strategy during a specific period with paper money in real-time.

On the other hand, the profitable or non-profitable result is just a snapshot of the strategy’s performance. During the optimization process, the developer will investigate the parameters that provide higher profitability or lower risk for the investor.

The next educational article will review the simulator’s information in detail once the historical simulation has been executed.

Suggested Readings

  • Jaekle, U., Tomasini, E.; Trading Systems: A New Approach to System Development and Portfolio Optimisation; Harriman House Ltd.; 1st Edition (2009).
  • Pardo, R.; The Evaluation and Optimization of Trading Strategies; John Wiley & Sons; 2nd Edition (2008).
Categories
Forex Basic Strategies

Generating Profitable Forex Signals Using The ‘Indicator-Price Action’ Combo Strategy

Introduction

Few strategies discussed previously focussed on chart patterns and indicators. Now let us a strategy that is based on two of the most powerful indicators in technical analysis. We already know how to trade using these indicators separately. But using any technical indicator in isolation will not generate a great amount of profit.

Therefore, it becomes necessary to combine at least two indicators and use them in conjunction to produce signals. In today’s article, we not only combine two indicators but also provide a price action edge to it that will make this one of the best strategies of all time. This particular strategy gives traders an insight into both volatility and momentum in the forex market.

The two indicators we will using are Bollinger Band (BB) and MACD. Using the two indicators together can assist traders in taking high probability trades as they gauge the direction and strength of the existing trend, along with volatility. Let us find out the specifications of the strategy and how we imbibe concepts of price action here.

Time Frame

The strategy is designed for trading on longer-term price charts such as the 4 hours and ‘Daily.’ This means the strategy is suitable for the swing to long-term traders.

Indicators

As mentioned earlier, we use Bollinger Band and MACD indicators in the strategy with their default settings.

Currency Pairs

We can apply this strategy to both major and minor currency pairs. However, pairs that are not volatile should be avoided.

Strategy Concept

In this strategy, we first identify the trend of the market and see if the price is moving in a channel or not. When looking for a ‘long’ setup, the price must move in a channel below the median line of the Bollinger band. The lesser time price spends above the median line of the Bollinger band better for the strategy.

The reason behind why we chose to have the price below the Bollinger band is to verify that the price is moving into an ‘oversold’ zone. When price moves into the zone of ‘overbought’ or ‘oversold,’ it means a reversal is nearing in the market. Similarly, in a ‘short’ setup, the price should initially move in an upward channel above the median line of the Bollinger band. This indicates that the price is approaching an ‘overbought’ area.

The MACD indicator shows when a true reversal is taking place in the market. The histogram tells about the momentum and strength of the reversal. Depending on the level of the bars, we ascertain the strength of the reversal. Not only is the strength of the reversal important, but also the ’highs’ and ‘lows’ it makes. Once price crosses previous highs and lows, we enter the market at an appropriate ‘test.’ Let us understand in detail about the execution of the strategy.

Trade Setup

In order to execute the strategy, we have considered the 4-hour chart of the GBP/JPY pair, where we will be illustrating a ‘long’ trade. Here are steps to execute the strategy.

Step 1: Firstly, we have to identify the trend of the market. In a ‘long’ trade setup, we need to look for series of ‘lower lows’ and ‘lower highs’ below the median line of the Bollinger band, and in a ‘short’ trade setup, we need to look for series of ‘higher highs’ and ‘higher lows’ above the median line of Bollinger band. When this is confined in the channel, the trend becomes very clear, and reversal can easily be identified.

Step 2: We say that an upward reversal has taken place when we notice a bullish crossover in MACD along with a positive histogram. While in an uptrend, we say that a reversal has occurred when we notice a bearish crossover in MACD along with a negative histogram. Once reversal becomes eminent in the market, it is necessary to confirm that the reversal is ‘true,’ and thus, we could take a trade in the direction of the reversal.

The below image shows a downtrend reversal, as indicated by MACD.

Step 3: In this step, we should make sure that the price makes a ‘high’ that is above the previous ‘lower high,’ in an upward reversal. While in a downward reversal (reversal of an uptrend), the price should make a ‘low’ that is lower than the previous ‘higher low.’ When all these conditions are fulfilled, we can say that the reversal is real, and now we will look to trade the reversal.

We enter the market for a ‘buy’ or ‘sell’ when price ‘tests’ the median line of the Bollinger band after the reversal and stays above (‘buy’) or below (‘sell’).

Step 4: Finally, after entering the trade, we need to define appropriate levels of stop-loss and ‘take-profit’ for the trade. The rules of stop-loss are pretty simple, where it will be placed below the lowest point of the downtrend in a ‘long’ position and above the highest point of the uptrend in a ‘short’ position. ‘Take-profit’ will be set such that the risk-to-reward (RR) of the trade is at least 1:1.5. Once the price starts moving in our favor, we will put our stop-loss to break-even and extend our take-profit level.

Strategy Roundup

The combination of the Bollinger band and MACD is not suitable for novice traders. Since it involves complex rules and indicators, we need prior experience of using the indicators and charts before we can apply the strategy successfully. Traders should pay attention to every rule of the strategy to gain the maximum out of it. As there many rules and conditions, there is a tendency among traders to skip some rules, but it is not advisable.

Categories
Forex System Design

Designing a Trading Strategy – Part 4

Introduction

In our previous article, we presented diverse types of filters, which work as additional rules. We also showed how to incorporate these filters into a trading strategy so that they can help improve its performance. 

In this educational article, the fourth section of the series dedicated to developing a trading strategy, we will discuss the profit management.

Profit Management

Profit management is an aspect of risk management that characterizes by its high level of complexity. The difficulty lies in that profit management seeks to preserve the profits obtained during the trade and also to prevent a premature exit from a market that still moves in a trend not over yet.

There are two available methods with which the trading strategist may manage the profits realized in an opened position. These are the trailing stop and the profit target order.

Trailing Stop

This type of order is dynamic. It moves only in the same direction of the position as it moves in the direction of the trend. In other words, a trailing stop will move upward in a buy positioning and downward in a sell trade. 

Another characteristic of the trailing stop is that it steadily advances during the life of the trade. It will never retrace when the price develops a movement against the trade’s direction.

The trailing stop has two components, which are detailed as follows:

  • Trailing stop: corresponds to the number of pips in which the stop loss order will move once the price moves in the trade direction. For example, if an order has set a 40-pip stop-loss, and the price advances 30 pips in favor of the trend, the new stop-loss will shift to 10 pips below the opening price. In general, there are several ways to establish a trailing stop: by fixed pip variation and by volatility using the Average True Range (ATR) indicator, or using SAR (Stop and reverse) stops. 
  • Step: this corresponds to the variation in pips that the dynamic stop will move behind the price when it has been activated.

Profit Target Order

The second mechanism to manage profits is by using a profit target order. This type of order is conditioned to the prince advance to a predetermined level. Likewise, compared with the trailing stop case, this order is not affected by the price decrease. However, its activation is subjected to the price reaching a specific level.

 A profit target order can be set using a specific number of pips, by a multiple of the Average True Range (ATR), a percentage of price increase ( or decrease), specific levels of resistance or support, or a specific dollar gain.

Using the Trailing Stop in a Trading Strategy

This example illustrates the impact of using a trailing stop with a two moving averages crossover strategy, corresponding to LWMA(5) and SMA(55) periods using the EURUSD pair.

 We have evaluated the performance of a 40-pip trailing stop with a variable step from 1 to 15 pips. The results are as follows.

In the table above, we distinguish the impact on drawdown reduction with respect to the base scenario, after the incorporation of a trailing stop rule to the MA crossover strategy. The base case, on which the exit rule is the MA cross in the opposite direction to the opening of the position, exhibits a 22.66% drawdown. However, the addition of trailing stops led to a reduced 10.44% drawdown and a net profit of -525.88 (USD).

Each trailing stop step variation scenario, including the base exit scenario of the trading strategy, is shown in the following figure.

Finally, we observe that a 7-pip step provides the lowest losses. We also highlight that as the step increases, the drawdown also increases, confirming the growing losses.

Conclusions

The application of Profit Management represents a significant challenge for the developer of the trading strategy. This complexity arises due to a wide variety of combinations that can be used to ensure the strategy’s gains as each trade moves in the trend direction.

In this context, as we have seen, the parameter setting to be considered, the trailing stop, profit target orders, or its combination, should be carefully evaluated before applying them to the trading strategy, to ensure the optimal settings.

In the next educational article, we will present the fifth and last part of the series dedicated to developing trading strategies that will explain the position sizing process.

Suggested Readings

  • Jaekle, U., Tomasini, E.; Trading Systems: A New Approach to System Development and Portfolio Optimisation; Harriman House Ltd.; 1st Edition (2009).
  • Pardo, R.; The Evaluation and Optimization of Trading Strategies; John Wiley & Sons; 2nd Edition (2008).
Categories
Forex Education Forex Indicators Forex System Design

Designing a Trading Strategy – Part 3

Introduction

In our previous article, we presented the first component of a trading strategy, which corresponds to the market entry and exit rules. Likewise, we exposed the case of a basic trading system based on the crossing of two moving averages.

In this educational article, we will present the filters and how they can help the trader refine a trading strategy.

Setting Additional Filters in Trading Strategy

Signals originated in a trading strategy can use filters to improve the entry or exit signals that the system generates. The purpose of incorporating filters is to improve both the accuracy and reliability of the strategy. 

A filter can be an indicator’s level or additional instructions to the initial entry, or exit rules. Some examples of filters can be:

  1. Avoid buy entries if the reading of the 60-period RSI oscillator is less than 49. 
  2. Allow Buy entries if the price closes above the high of the previous day or allow sell-short signals if the price closes below the last day’s low.

Also, rules can be established to control the strategy’s risk, and preserve the trading account’s capital. In this context, two elements that can help to manage the risk are:

  1. Initial stop-loss, which can be a fixed amount of pips or depending on some previous periods’ volatility. In turn, this rule can be fixed or dynamic, its level moving as the trade progresses through time.
  2. limiting the number of simultaneously opened trades. This rule can be useful, mainly when the market moves in a sideways path.

Measuring the Risk of Strategy

The risk of trading strategy corresponds to the amount of capital that the investor risks with the expectation of a possible return on the financial market by applying a set of rules with positive expectations.

One way to measure the risk of trading strategy is through the maximum drawdown, which corresponds to the maximum drop in equity from the peak of the equity value to the subsequent equity low.

The developer can obtain this measure as well as other strategy performance indicators by running a historical simulation.

Incorporating Additional Rules into Trading Strategy

The following example corresponds to the addition of rules to the trading strategy formulated and developed in the previous article, based on  moving averages crossovers with 5 and 55 periods. 

Before incorporating additional rules and evaluating their subsequent impact on the trading strategy, we will display the results of a historical simulation, developed using the EURUSD pair in its hourly timeframe. Likewise, the size of each trade position corresponded to 0.1 lot in a $10,000 account.

The following figure illustrates the strategy’s performance in its initial condition, which executed 652 trades providing a drawdown level of 22.66% and a net profit of -$716.93.

The additional proposed filter rules are as follows:

  • The strategy must have an initial stop loss of 30 pips. This stop will limit the possible maximum amount of loss per trade.
extern double SL_Pips = 30;
  • We propose using a Break-Even rule to ensure the opened trades’ profits, which will be used when the price advances 40 pips. Likewise, the strategy will apply a Trailing Stop of 40 pips of advance and a 3-pips step
extern double BreakEven_Pips = 40;
extern double Trail_Pips = 40;
extern double Trail_Step = 3;

The function that computes the Trailing Stop is as follows:

void TrailingStopTrail(int type, double TS, double step, bool aboveBE, double 
aboveBEval) //set Stop Loss to "TS" if price is going your way with "step"
  {
   int total = OrdersTotal();
   TS = NormalizeDouble(TS, Digits());
   step = NormalizeDouble(step, Digits());
   for(int i = total-1; i >= 0; i--)
     {
      while(IsTradeContextBusy()) Sleep(100);
      if(!OrderSelect(i, SELECT_BY_POS, MODE_TRADES)) continue;
      if(OrderMagicNumber() != MagicNumber || OrderSymbol() != 
Symbol() || OrderType() != type) continue;
	  RefreshRates();
      if(type == OP_BUY && (!aboveBE || Bid > OrderOpenPrice() + TS + aboveBEval)
 && (NormalizeDouble(OrderStopLoss(), Digits()) <= 0 ||
 Bid > OrderStopLoss() + TS + step))
         myOrderModify(OrderTicket(), Bid - TS, 0);
      else if(type == OP_SELL && (!aboveBE || Ask < OrderOpenPrice()
 - TS - aboveBEval) && (NormalizeDouble(OrderStopLoss(), Digits()) <= 0 ||
 Ask < OrderStopLoss() - TS - step))
         myOrderModify(OrderTicket(), Ask + TS, 0);
     }
  }
  • Also, the strategy must allow a maximum limit of one trade at a time.
extern int MaxOpenTrades = 1;

In this context, the code that will determined the limit reached will be as follows:

   //test maximum trades
   if((type % 2 == 0 && long_trades >= MaxLongTrades)
   || (type % 2 == 1 && short_trades >= MaxShortTrades)
   || (long_trades + short_trades >= MaxOpenTrades)
   || (type > 1 && type % 2 == 0 && long_pending >= MaxLongPendingOrders)
   || (type > 1 && type % 2 == 1 && short_pending >= MaxShortPendingOrders)
   || (type > 1 && long_pending + short_pending >= MaxPendingOrders)
   )
     {
      myAlert("print", "Order"+ordername_+" not sent, maximum reached");
      return(-1);
     }
  • The trading strategy must preserve the account equity using a position size that should be proportional to 1 lot per $100,000 of equity.
extern double MM_PositionSizing = 100000;
double MM_Size() //position sizing
  {
   double MaxLot = MarketInfo(Symbol(), MODE_MAXLOT);
   double MinLot = MarketInfo(Symbol(), MODE_MINLOT);
   double lots = AccountBalance() / MM_PositionSizing;
   if(lots > MaxLot) lots = MaxLot;
   if(lots < MinLot) lots = MinLot;
   return(lots);
  }

Now, the entry rules with the Stop-Loss rule will be as follows:

   //Open Buy Order, instant signal is tested first
   if(Cross(0, iMA(NULL, PERIOD_CURRENT, Period1, 0, MODE_LWMA, PRICE_CLOSE, 0) >
 iMA(NULL, PERIOD_CURRENT, Period2, 0, MODE_SMA, PRICE_CLOSE, 0)) 
//Moving Average crosses above Moving Average
   )
     {
      RefreshRates();
      price = Ask;
      SL = SL_Pips * myPoint; //Stop Loss = value in points (relative to price)   
      if(IsTradeAllowed())
        {
         ticket = myOrderSend(OP_BUY, price, MM_Size(), "");
         if(ticket <= 0) return;
        }
      else //not autotrading => only send alert
         myAlert("order", "");
      myOrderModifyRel(ticket, SL, 0);
     }
   
   //Open Sell Order, instant signal is tested first
   if(Cross(1, iMA(NULL, PERIOD_CURRENT, Period1, 0, MODE_LWMA, PRICE_CLOSE, 0) <
 iMA(NULL, PERIOD_CURRENT, Period2, 0, MODE_SMA, PRICE_CLOSE, 0))
 //Moving Average crosses below Moving Average
   )
     {
      RefreshRates();
      price = Bid;
      SL = SL_Pips * myPoint; //Stop Loss = value in points (relative to price)   
      if(IsTradeAllowed())
        {
         ticket = myOrderSend(OP_SELL, price, MM_Size(), "");
         if(ticket <= 0) return;
        }
      else //not autotrading => only send alert
         myAlert("order", "");
      myOrderModifyRel(ticket, SL, 0);
     }
  }

Finally, the position’s closing code including the trailing stop will be as follows:

  {
   int ticket = -1;
   double price;   
   double SL;
   
   TrailingStopTrail(OP_BUY, Trail_Pips * myPoint, Trail_Step * myPoint, false,
 0); //Trailing Stop = trail
   TrailingStopTrail(OP_SELL, Trail_Pips * myPoint, Trail_Step * myPoint, false,
 0); //Trailing Stop = trail
   
   //Close Long Positions
   if(iMA(NULL, PERIOD_CURRENT, Period1, 0, MODE_LWMA, PRICE_CLOSE, 0) <
 iMA(NULL, PERIOD_CURRENT, Period2, 0, MODE_SMA, PRICE_CLOSE, 0)
 //Moving Average < Moving Average
   )
     {   
      if(IsTradeAllowed())
         myOrderClose(OP_BUY, 100, "");
      else //not autotrading => only send alert
         myAlert("order", "");
     }
   
   //Close Short Positions
   if(iMA(NULL, PERIOD_CURRENT, Period1, 0, MODE_LWMA, PRICE_CLOSE, 0) >
 iMA(NULL, PERIOD_CURRENT, Period2, 0, MODE_SMA, PRICE_CLOSE, 0)
 //Moving Average > Moving Average
   )
     {   
      if(IsTradeAllowed())
         myOrderClose(OP_SELL, 100, "");
      else //not autotrading => only send alert
         myAlert("order", "");
     }

The historical simulation with the inclusion of the additional rules to the trading strategy  is illustrated in the next figure and reveals a reduction in the Drawdown from 22.66% to 10.49%. Likewise, we distinguish a variation in the Total Net Profit from -$716.93 to -$413.76.

Although the trading strategy continues having a negative expectation, This exercise shows the importance of including additional rules to improve the trading strategy’s performance.

Conclusions

This educational article presented how the inclussion of filters into a trading strategy can improve the performance of two key indicators such as the Drawdown and the Total Net Profit.

On the other hand, we did not consider the parameters optimization during this step. Optimization will be discussed in a future article.

In the next educational article, we will extend the concepts of Profits Management and Position Sizing.

Suggested Readings

  • Jaekle, U., Tomasini, E.; Trading Systems: A New Approach to System Development and Portfolio Optimisation; Harriman House Ltd.; 1st Edition (2009).
  • Pardo, R.; The Evaluation and Optimization of Trading Strategies; John Wiley & Sons; 2nd Edition (2008).
Categories
Forex System Design

Designing a Trading Strategy – Part 2

Introduction

Our previous article presented the three key elements of a trading strategy, which is the base of a trading system. In this second part of the designing process of a trading strategy, we will present the first component of a trading strategy corresponding to the entry and exit.

Trade Positioning and Trading Strategy

trade is made of at least by a buy order and a sell order. In other words, when, for example, the trader places a long position (buy), he should close it using a sell (cover) order.

On the other hand, a trading strategy with a positive expectation can identify and provide both long and short trading opportunities under a specific condition. Similarly, the strategy must be able to determine when to close the trading position and exit the market.

Generating Trading Opportunities

As we have seen in previous articles, a trading strategy is born from an idea that we believe might generate profits in any financial market. In this regard, the entry signals can vary from the simplest to the most complex requirement.

A buy position will arise when the price meets a condition for a bull market. On the contrary, a short position will activate if the market accomplishes the conditions for a bear leg. Some examples of long entries are:

  1. The 5-period fast moving average crosses over the 55-period slow moving average.
  2. The 65-period RSI oscillator closes above a reading of the 52-level.
  3. The price surpasses and closes above the high of the previous day.
  4. The price breaks and closes above the high of the 55-day range.

The definition of the exit rule of the trade must be considered from the basis that an open position in one direction must be closed with a position of equal size and opposite direction. For example, if the trader has opened a long trade, it will be closed with a selling trade. In this way, the developer should define a set of criteria that allow the execution of the closing of the trade. For example:

1) Closing the trade if the price advances 1.5 times the risk of the transaction.
2) The price reaches 3 times the ATR of 14 periods.
3) The rolling average of 5 periods crosses the average of 21 periods.

An example of Trading Signals using Metatrader 4

Metatrader 4 is one of the most popular trading platforms in the retail trading segment. Despite other trading platforms, such as TradeStation, Multicharts, or VisualChart, we will use Metatrader for our example. This platform includes the MetaEditor application, with which the creation of trading strategies can be developed through the programming of custom indicators.

In the following example, we show the creation of a custom indicator based on the crossing of two moving averages. This trading strategy uses a 5-period Weighted Linear Moving Average (Fast LWMA) and a 55-period Simple Moving Average (Slow SMA). 

Now it is time to define the entry and exit rules of our trading strategy as ideas and code rules for MetaEditor of MetaTrader 4.

The setting of each moving average period is as follows:

extern int Period1 = 5;
extern int Period2 = 55;

The entry criterion will occur as follows:

  • buy position will be activated when the LWMA(5) crosses above the SMA(55).
//Open Buy Order, instant signal is tested first
   if(Cross(0, iMA(NULL, PERIOD_CURRENT, Period1, 0, MODE_LWMA, PRICE_CLOSE, 0) >
 iMA(NULL, PERIOD_CURRENT, Period2, 0, MODE_SMA, PRICE_CLOSE, 0)) 
//Moving Average crosses above Moving Average
   )
     {
      RefreshRates();
      price = Ask;   
      if(IsTradeAllowed())
        {
         ticket = myOrderSend(OP_BUY, price, TradeSize, "");
         if(ticket <= 0) return;
        }
      else //not autotrading => only send alert
         myAlert("order", "");
     }
  • sell position will trigger when the LWMA(5) crosses below the SMA(55).
//Open Sell Order, instant signal is tested first
   if(Cross(1, iMA(NULL, PERIOD_CURRENT, Period1, 0, MODE_LWMA, PRICE_CLOSE, 0) <
 iMA(NULL, PERIOD_CURRENT, Period2, 0, MODE_SMA, PRICE_CLOSE, 0)) 
//Moving Average crosses below Moving Average
   )
     {
      RefreshRates();
      price = Bid;   
      if(IsTradeAllowed())
        {
         ticket = myOrderSend(OP_SELL, price, TradeSize, "");
         if(ticket <= 0) return;
        }
      else //not autotrading => only send alert
         myAlert("order", "");
     }
  }

The exit criterion will occur as follows:

  • buy position will be closed if the LWMA(5) crosses below the SMA(55).
//Close Long Positions
   if(iMA(NULL, PERIOD_CURRENT, Period1, 0, MODE_LWMA, PRICE_CLOSE, 0) <
 iMA(NULL, PERIOD_CURRENT, Period2, 0, MODE_SMA, PRICE_CLOSE, 0) 
//Moving Average < Moving Average
   )
     {   
      if(IsTradeAllowed())
         myOrderClose(OP_BUY, 100, "");
      else //not autotrading => only send alert
         myAlert("order", "");
     }
  • sell position will be closed if the LWMA(5) crosses above the SMA(55).
//Close Short Positions
   if(iMA(NULL, PERIOD_CURRENT, Period1, 0, MODE_LWMA, PRICE_CLOSE, 0) >
 iMA(NULL, PERIOD_CURRENT, Period2, 0, MODE_SMA, PRICE_CLOSE, 0) 
//Moving Average > Moving Average
   )
     {   
      if(IsTradeAllowed())
         myOrderClose(OP_SELL, 100, "");
      else //not autotrading => only send alert
         myAlert("order", "");
     }

Until now, we have not defined a money management rule or the position size for our trading strategy, just entries, and exits.

Conclusions

Entry and exit criteria are the basis of a trading strategy, which arises from an idea. The trading strategy’s essential objective is to obtain an economic profit from applying specific rules in both long and short positioning in the financial market.

In this educational article, we presented the case of a trading strategy based on two moving averages crossovers. In particular, we used the LWMA(5) as the signal moving average with an SMA(55) as the slow m.a.

In the following article, we will present some filters to avoid false signals.

Suggested Readings

  • Pardo, R.; The Evaluation and Optimization of Trading Strategies; John Wiley & Sons; 2nd Edition (2008).
  • Jaekle, U., Tomasini, E.; Trading Systems: A New Approach to System Development and Portfolio Optimisation; Harriman House Ltd.; 1st Edition (2009).
Categories
Forex Basic Strategies

Learning The ‘Intraday Strategy’ To Trade The Forex Market

Introduction

In today’s article, we present to you a fairly simple but reliable trading strategy that can be used by all types of traders, irrespective of their style. It is believed that when markets are strongly trending in one direction, it gets impossible to catch the stalling point. It is only difficult to catch the ‘top’ or ‘bottom’ of the market, but it also carries a huge amount of risk. We are going to discuss a trading strategy that is contrary to this common belief. We shall try to catch the highest or the lowest point in the market by using some of the most powerful technical indicators and techniques.

Time Frame

The strategy can be used on the 5 minutes, 15 minutes, and 1-hour time frame chart. An intraday trader would apply the strategy on the 5 or 15 minutes chart, whereas a positional trader would open the 1-hour chart.

Indicators

We use the following indicators in the strategy:

  • 5-period Exponential Moving Average (EMA)
  • 10-period Exponential Moving Average (EMA)
  • 14-period Relative Strength Index (RSI)
  • Slow Stochastic Oscillator
  • K and D period – 3

Currency Pairs

This strategy can only be applied on major currency pairs of the forex market. Some of the preferred pairs include EUR/USD, GBP/JPY, GBP/USD, USD/CAD, USD/JPY, EUR/GBP, etc.

Strategy Concept

The rules of the strategy are quite simple and straightforward. We enter the market for a ‘long’ when the 5-period EMA crosses above the 10-period EMA after a prolonged downtrend. But this isn’t enough. Along with this, the RSI should be above the level of 50, and Stochastic slow and fast lines should move in the same direction (upward). Here we need to make sure that the Stochastic does not enter the overbought zone. Similarly, if the 5-period EMA crosses below the 10-period EMA after a prolonged uptrend, we prepare to enter ‘short.’ In this case, the RSI should be below the level of 50, and Stochastic lines should be moving downwards.

We exit the trade when 5-period EMA crosses beyond the 10-period EMA, where this is confirmed by the close of a candle beyond the latter. Another way to exit the trade is when the RSI drops below the 50 level. The several conditions which must be fulfilled in order to execute a trade make the strategy a good filter for trade entries. However, the two EMAs have a drawback as they can get choppy and generate false signals. We can avoid this by carefully monitoring the movement of EMA lines along with the other indicators. When the strategy is executed by following every rule of the strategy, wrong ‘trades’ can be eliminated to a great extent.

Trade Setup

In order to explain the strategy, we have considered the 5 minutes chart of EUR/USD, where we will be illustrating a ‘long’ trade. Here are the steps to execute the strategy.

Step 1: The first step is to identify the trend of the market and plot all the indicators on the chart, as mentioned in the above section. An easier way to identify the trend is by looking at the price concerning 5 and 10 period EMA. If the 5-period EMA is above the 10-period EMA, we say that the market is an uptrend. Whereas, if the 5-period EMA is below the 10-period EMA, the market is said to be in a downtrend.

In the example considered, it clear from the below image that the market is in an uptrend, and at the end, the trend seems to be weakening.

Step 2: This is the most critical step where we combine all the rules of the strategy. Once the trend has been identified, we should wait for a crossover of the 5-period EMA below the 10-period EMA, during the reversal of an uptrend. We say that the market has made a ‘top’ when both RSI and Stochastic lines start moving lower after the crossover. We should make sure that RSI does not move into the oversold zone. In order to catch the reversal of a downtrend, we should see a crossover of the 5-period above the 10-period EMA. At the crossover, the RSI and Stochastic lines should head upwards but so much that they move into the overbought zone.

The below image shows the crossover of both the EMAs that is accompanied by a ‘moving down’ RSI and Stochastic.

Step 3: Let us discuss the ‘entry’ of the strategy. We enter the market after a confirmation candle in the direction of the reversal. That means we enter ‘short’ after the close a bearish candle below both the EMAs. Similarly, we go ‘long’ after the appearance of a bullish candle, where the price closes above both the EMAs.

We can see in the below image that we are entering the market for a ‘sell’ right after at the close of the price below the 10-period EMA.

Step 4: In this step, we determine the stop-loss and take-profit for the strategy. The stop-loss is pretty straight forward where we place it just above the ‘highest’ or ‘lowest’ point. We take our profit and exit the position based on the signal provided by RSI. There two ways to exit the strategy. The first signal provided by the market to exit is when the crossover of the EMAs takes place. The second way to exit is when the RSI starts moving higher and crosses above the level of 50.

In the case of EUR/USD, as shown below, we take our profits when both the indicators indicated a reversal of the trend.

Final Words

The strategy actually generates various entry signals, and each of them can at least result in a profit for scalpers, by running very tight stops and keeping risk low. Thus, the strategy makes a reliable reversal trading system which relatively accurately pinpoints reversal points at the end of a trend and, more importantly, the ability to provide high risk-to-reward (RR) trades.

Categories
Forex Education Forex System Design

Designing a Trading Strategy – Part 1

Introduction

In a previous article, we introduced the basic concepts that should include a trading strategy. In this context, a trading strategy tends to be confused with a trading system. In this educational article, we start to present a series focused on developing a trading strategy that could end as a trading system.

The Trading Strategy Concept

Before advancing in designing a trading strategy, it is necessary to explain the difference between a trading strategy and a trading system.

trading strategy is a set of objective and formalized rules, such as parameters from a mathematical formula; these values can vary in different types of markets. Additionally, this set of rules are characterized by being independent of the emotional trader’s behavior. 

trading system is a systematic application of a trading strategy designed to achieve a profitable return by positioning in long or short financial markets. The main advantage of using a tested and validated trading system is significant confidence in producing profits.

Trading strategies can vary from the simplest to the complex rules criteria. Some classical trading strategies are moving average crosses, channel breakouts, bar patterns, candlestick patterns, and strategies based on oscillators such as MACD or RSI.

According to the complexity level of the trading strategy, as complexity increases, the construction, testing, optimization, and evaluation process will become more difficult. In this context, if the system developer does not control the trading strategy complexity, the optimization process results can become challenging, even could lead to the over-fit of the trading strategy.

The Basic Components

Each trading strategy must contain three essential components identified as follows:

Entry and Exit: Both entry and exit are the core of a trading strategy. The entry and exit criterion can vary in its complexity level. Similarly, the strategy could consider an entry in a specific price as a pending order (limit or stop), a market entry, open, or the closing price. On the other hand, the exit criteria could use a broad kind of methods such as percentage of price advancement or key support/resistance levels. As the reader may realize, the possibilities on entries and exits are unlimited.

Risk Management: It is a fact that any trading strategy will generate losing trades. In this regard, all trading strategies must contain a set of objective rules to reduce the risk. Risk management’s main objective is to limit losses in the trading account while allowing the trader to continue trading despite losing streaks.

Position Sizing: The third element a trading strategy must include is the amount to be traded. The position size may correspond to a fixed number of units, such as contracts, lots, shares, etc. The problem of position sizing becomes critical, especially when the trading strategy is profitable. In this context, Pardo suggests that it is more effective to allocate resources to improve the strategy’s entries and exits.

Conclusions

In this educational article, we have introduced the difference between a trading strategy and a trading system. In this regard, we can understand a trading strategy as the basis of a trading system.

A trading strategy can be based on the simplest or the most sophisticated criteria. However, as the complexity level of the strategy increases, the level of complexity in the trading system’s development will also increase.

On the other hand, a trading strategy must contain three elements, which are as follows:

  1. Entry and Exit.
  2. Risk Management.
  3. Position Sizing.

Finally, in the next educational article, we will expand the concepts of inputs and outputs in a trading strategy.

Suggested Readings

  • Pardo, R.; The Evaluation and Optimization of Trading Strategies; John Wiley & Sons; 2nd Edition (2008).
  • Jaekle, U., Tomasini, E.; Trading Systems: A New Approach to System Development and Portfolio Optimisation; Harriman House Ltd.; 1st Edition (2009).
Categories
Forex Basic Strategies

The ‘Daily High Low’ Based Forex Trading Strategy

Introduction

The daily high low based forex trading strategy is a breakout trading strategy from the high and low prices in the daily timeframe. In forex trading, the daily timeframe is crucial as most of the significant market players use this time table in their trading. As a result, any trading strategy in the daily time frame provides better trading results compared to the lower time frame.

On the other hand, when the price creates a rally by breaking the high and low price of the daily timeframe will indicate a significant market momentum. If you can avoid the range market, the high low based strategy can provide a reliable trading result. If you can implement the trading strategy well as per the rule mentioned below, you can make a decent profit from it in any currency pair.

The Daily High Low Based Trading Strategy

The daily high low based forex trading strategy has a simple concept:

  • If the price breaks below the low of yesterday’s candle, it may move further low.
  • If the price breaks above the high of yesterday’s candle, it may move further high.

It is a standard brief of this trading strategy. Let’s have a look at the image below:

In this image above, the price has made a new higher high once it breaks above the candle high in the market area. However, there is some market condition where price moves to a range and violates the movement above or below the candle high.

If you are trading the breakout of a daily candlestick that is larger than the earlier candlesticks, you might be caught by the mean reversion of the price. In the forex market, it is often difficult to predict how long a trend could stay. Almost 70% of the time, the market moves within a range; therefore, you should find a location of the price where the breakout from a daily candle would be reliable.

The basic concept of making a good profit from the forex market is to buy from low and sell from high. Therefore, any bullish breakout from a significant support level in a daily timeframe would indicate a reliable daily breakout strategy compared to a trade setup from the middle of a trend. Let’s have a look at the image below, how the price moved up once it got a breakout from a daily candle from a significant support level.

Now look at the image below and see how the price violates the daily breakout to the upside once it reached above 50% of the possible trend.

How to Trade the High Low Breakout Strategy?

This trading strategy is simple as you can make most of the trading decision a day before the movement is expected. The main of this trading strategy is to place two pending orders above or below the yesterday candle. Therefore, you can catch any movement either upside or downside from the previous day’s candle.

Timeframe

We should consider the daily timeframe to determine the high and low prices. Later on, move to the lower timeframe (usually H4) to enter the trade. However, for new traders, it is recommended to stick to the daily timeframe.

Currency Pairs

This trading strategy works well in all currency pairs, including EURUSD, GBPUSD, USDJPY, or AUDUSD. However, sticking to the major and minor currency pairs would provide a better trading result. Moreover, you should avoid exotic pairs as there is a risk of the false move by hitting the high or low and reverse back.

Breakout Rules

  • Identify the currency pair that is moving within a trending environment. You can predict the direction of the price based on the market context or support and resistance.
  • For example, suppose the price is aggressively creating a higher high or lower low. In that case, the price will likely continue the current momentum until it reaches the next resistance or support level. Moreover, any breakout from a significant key level often creates a fresh move either upside and downside.
  • When the daily candle of the previous day closes, place a buy stop above the daily high, and a sell stop below the daily low to catch the breakout.
  • Move your stop loss at 50% of the daily candle.
  • For the take-profit level, you can consider the average price of the last three days’ movement. For example, if the daily candle of the last three days shows the movement of 100 pips, 50 pips, and 100 pips, the total movement would be 250 pips (100+50+100). Therefore, the average price of the last three days would be 83 pips (250/3).

Example of Daily High Low Based Trading Strategy

The image below represents the graphical view of the daily high low based trading strategy:

  • In the image above, we can see the price moved up from a significant support level with a daily close above it. A buy Stop is taken once the price had a bullish daily close from the key support level. A similar concept will apply to the bearish market once the price has a daily close from a significant resistance level.
  • The next day, the buy stop is taken, and the price moved to the take profit level. The take profit level is taken by calculating the average price of the last three candles.
  • The stop loss is set at 50% of the previous day’s candle. If the stop loss hit, it will indicate that the price will reverse or consolidate more. In that case, we should wait for a further breakout or move to another currency pair.

Summary

Let’s summarize the daily breakout trading strategy:

  • Identify the currency pair that is moving within a trend or likely to start a new trend.
  • Set buy stop above the candle if the price is moving up from a support level and put a sell stop if the price is moving down from a resistance level.
  • Stop-loss should be at 50% of the previous day’s candle.
  • Take profit will be the average price of the last three days’ movement.

In this trading strategy, the challenge is to avoid correction and choppy market. In that case, you should read the price action to determine the possible movement by measuring the price momentum. Moreover, to get the maximum benefit from this trading strategy, follow strong money management rules.

Categories
Forex Basic Strategies

Learning To Trade The ‘Order Block’ Forex Strategy

Introduction

Order block is a market behavior that indicates order collection from financial institutions and banks. Prominent financial institutes and central banks drive the forex market. Therefore, traders must know what they are doing in the market. When the market builds the order block, it moves like a range where most of the investing decisions happen.

The market makes a sharp move towards both upside and downsize once the order building is completed. The key term of the order block trading strategy is that it includes what the institutional traders are doing. As they are the key price driver, any strategy that includes institutional trading might

What is the Order Block?

Financial institutes do not make a sudden investment in any trading instrument. They spend a lot of money on analysis to get the best trading result. Furthermore, they play with the money that is often impossible to arrange by retail traders.

Smart money makes several steps in their trading based on the availability of the price. For example, if a bank wants to buy $100M EURUSD, it will take trade-in three or four steps. In the first step, they will take $20M, in the second step, $50M, and in the third step $30M. The price usually makes a movement when the full quota of $100M completes.

Order block seems like a range, but every range is not an order block. Moreover, we don’t know when and where the smart money moves. Therefore, we will rely on the best location and price action to identify a suitable order block.

Besides the order block, we have to know what the order flow is. Once the price starts a movement from an order block, it provides an order flow towards any direction. Order flow from a higher timeframe indicates a market direction, and we have to find the order block towards the direction of it.

Order Block Trading Strategy

From the above section, we have seen what the institutional order block and order flow is. In this trading strategy, we will use 1 hour- 4 hours or the daily timeframe to enter the trade and weekly timeframe to identify the order flow. Furthermore, we will use the Fibonacci to identify the potential location from where the market is expected to move.

Timeframe

  • One hour to 4 hours to identify the entry-level.
  • Weekly timeframe to measure the order flow.

Currency Pair

The best part of this trading strategy is that it can provide profitable trades in all currency pairs. However, we have done extensive research and found that it works well in all major currency pairs, including EURUSD, GBPUSD, and USDJPY.

Identify the Order Flow

In the weekly timeframe, we will look for the price that tested an order block and moving higher or lower. Once it completes the test and starts the movement will find the direction.

In the image above, we can see that the price moved higher and came back sharply towards the order block with an impulsive bearish pressure but did not break the lowest. After the rejection candle, we will wait for the price to move higher with a candle close. Once the candle closes, we found our weekly order flow.

Later on, we will move to the H4 or daily timeframe and identify the order block to trade towards the direction of the order flow.

Location of the Order Block

Move to the H4 timeframe and draw the Fibonacci retracement from upside to downside. While you draw the Fibonacci level, make sure to draw from the last available price, not more than 200 candles. Furthermore, for a buy trade, draw the Fibonacci from the highest price to the lowest price.

After drawing the Fibonacci level, you should consider order blocks residing below the 50% Fibonacci retracement levels. Any price below the 50% Fibonacci retracement level is the discount price and any price above the 50% retracement level is the premium price.

In the bullish order block trading strategy, you should consider the discount price and, in a bearish order block trading strategy, consider the premium price only.

Entry

Wait for the price to break above or below the order block, win an impulsive bullish or bearish pressure. Later on, the price will make new highs or lows, but you should wait when it comes back to the order block. In most cases, the price will come back to the order block and test the 50% level before making the final movement.

Therefore, if you don’t want to monitor the price, you can take a pending order at a 50% level of the order block. However, the best practice is to enter the trade once it starts moving from the order block with a candle close above or below it.

Stop Loss and Take Profit Level

The stop loss level should be below or above the order block with some buffer. In most of the cases, use 10 or 15 pips buffer to avoid unexpected market behavior.

On the other hand, the ordinary take profit level would be towards the order flow with 1:1 risk: reward ratio. However, the final take profit level is Fibonacci 0%, which is usually the top of the available price in a bullish condition and the bottom of the price in a bearish condition.

Summary

Let’s summaries the order block trading strategy:

  • Identify the weekly order flow and consider the direction.
  • Identify the premium and discount zone level with the Fibonacci retracement levels.
  • Move to H1 to H4 timeframe and find the order block within Fibonacci 50% to 100% levels.
  • The price should move towards the order flow directly from the order block, but it should come down to test the order block again.
  • Enter the trade as soon as the price rejects the order block with a reversal candlestick.

The order block trading strategy is profitable in most of the currency pairs. However, it is essential to keep in mind that the forex market is very uncertain. We, as a trader, anticipate the price, and that’s why we use stop loss. No trading strategy can assure a 100% profit. Although the Order block is a very profitable trading strategy, you should use appropriate trade management and money management rules to avoid unexpected market conditions.

Categories
Forex Education

Improving a Trading Strategy Based on Fibonacci Retracement

Introduction

In our latest educational article, we discussed how a trading strategy based on a unique criterion as the 61.8% level of the Fibonacci retracement could increase the strategy’s risk.

In this article, we will extend and propose alternatives that could help the technical trader improve its strategy performance.

Recognizing the Risk of the 61.8% Level as a Unique Criterion

In his work, Fischer and Fischer discovered excessive risk, obtaining significative losses in a trading strategy based on a unique entry-criterion. Fischer and Fischer defined the 61.8% level of the Fibonacci retracement as the right level to place an order. When the price retraces and touches the 61.8%, an entry order is activated. The stop loss of this entry setup should be located below the recent low.

To illustrate this entry setup, consider the following chart exposing the GBPNZD cross in its hourly timeframe.

From the figure, we observe the price surpassing the recent previous highs, which could lead us to expect a new rally. Considering the 61.8% criterion, we should place a buy limit order at 1.92675 and the stop-loss at 1.91390. The retracement observed after the impulsive upward movement could lead us to increase our confidence in the pending buy limit order.

The following figure shows the descending continuation of the GBPNZD cross, which activated the buy limit order. Although the price didn’t bounce from the 61.8% level, the trade setup remains valid.

The next chart shows the price piercing down the stop loss level placed at 1.91390, as defined by the trade setup rule.

This situation leads us to observe that the entry setup could be improved through the use of an entry filter to reduce the false entry risk.

Tools to Filter Entries

In previous articles, we presented different trade setups that the technical trader can generally find in the real market. An example of potential filters for trade entries are listed as follows.

Engulfing Pattern

Morning / Evening Star

Three Ascending Valleys / Descending Peaks

The technical trader should consider that this list is not exhaustive or mandatory to optimize its trading entry criterion.

Example

The following figure corresponding to the GBPNZD in its hourly chart illustrates a retracement after the cross developed a rally once the upward breakout of a double bottom pattern, is confirmed. According to the 61.8% criterion, the technical trader should place a buy limit at 1.91141.

The chart below reveals that the corrective movement didn’t pierce the 61.8%, either the 38.2% zone, which leads us to observe that the technical trader could have missed a trade opportunity if the entry criterion were only the Fibonacci ratio level. However, the incorporation of a filter could aid the entry setup and reduce the risk in the trade.

In the chart, we distinguish a three-ascending valley formation marked with circles in yellow and a bullish engulfing pattern. When putting all this together the arguments for a long-side position increase.

Conclusions

In this educational article, we discussed how the incorporation of filters as chart or candle patterns could improve and reduce the risk of a trade setup based on a unique criterion. In this context, the technical trader should practice pattern recognition before applying it in the real market.

Finally, the incorporation of a statistical study of the backtest could increase confidence in the trading strategy developed by the technical trade.

Suggested Readings

  • Fischer, R., Fischer J.; Candlesticks, Fibonacci, and Chart Patterns Trading Tools; John Wiley & Sons; 1st Edition (2003).
Categories
Forex Education

Improving a Trading Strategy using Fibonacci Retracements

Introduction

In previous educational articles, we presented a wide variety of trading setups that tell us what market to trade, the trade’s invalidation level, and where we will take profits. However, the question that arises is how we can improve its performance? 

Considering that price action produces a vast quantity of false signals, how we could enhance the entry timing toward the market? This educational article will review how the integration of Fibonacci tools with chart patterns and candle formations could improve the trading strategy.

The Fibonacci Level 61.8% Problem 

In a previous article, we discussed using the 61.8% Fibonacci as a criterion to set the market entry. However, considering that the price momentum does not always retrace until 61.8, and with this situation, the technical trader could not catch potential trades, “leaving money on the table.

On the other hand, there exist two Fibonacci ratios that tend to be used by traders; these ratios are 38.2% and 50%. However, the use of those ratios as potential entry levels could reduce the risk to reward ratio.

The following figure illustrates the GBPUSD pair in its 4-hour chart, from where, we distinguished that once the price competed for each advance, the retracement developed in three of our five observations the Cable retraced until 61.8%. In the other two cases, the price didn’t surpass 50% of the previous movement.

This situation leads us to observe that the technical trader could miss two opportunities. At the same time, it is essential to consider that the technical trader should practice and backtest the trading strategy before putting in action with real money. 

In this context, Fischer and Fischer developed a simulation using this entry maker criterion. The study’s results revealed that seven out of nine trades using the 61.8% of entry criterion resulted in a loss. 

Improving the 61.8% Entry Rule

To face the poor performance of the trading strategy based entries after the price reaches the 61.8% level, Fischer and Fischer propose using a filter to reduce the risk of loss. This additional criterion is based on candlestick patterns and three-point formations. 

In their work, Fischer and Fischer determined that the incorporation of candlestick patterns and three-point formations as an additional entry criterion allowed reducing the entries and increasing the percentage of winning trades.

Conclusions

 In this educational article, we presented how the incorporation of an additional rule in the market entry as the candlestick formation or a three-point pattern can represent a confirmation signal, which at the same time, reduces the possibility of a bad trade

Although the promising results are obtained by introducing the improvements presented by Fischer and Fischer, the technical trader should practice and evaluate the accuracy of these criteria before jumping into the market.

Finally, traders must remember that there is no trading strategy without losses. In this regard, it is critical to use a stop-loss to manage the risk.

Suggested Readings

  • Fischer, R., Fischer J.; Candlesticks, Fibonacci, and Chart Patterns Trading Tools; John Wiley & Sons; 1st Edition (2003).
Categories
Forex Basic Strategies Forex Daily Topic

Stop Hunting – The Strategy That Is Used By Most Of The Investment Banks

Introduction

Currently, there is a strategy that is followed by most investment banks around the world, and that is known as Stop Hunting. It attempts to force some market participants out of their positions by driving an asset’s price to a level where many retail traders set their stop-loss orders. The triggering of many stop losses at once generally leads to high volatility, and this can present opportunities to some smart traders who seek to trade in such an environment.

The fact that the price of a currency pair can experience sharp moves when many stop losses are triggered is exactly why many traders engage in stop hunting. Traders who are aware of this fact and have observed this phenomenon of the market try to make of this opportunity by being patient and conservative. The strategy we will be discussing today takes advantage of this sudden rise in volatility due to what is known as ‘stop-hunting.’

Timeframe

The beauty of this strategy is that it can be employed on all timeframes. However, it is not recommended in extremely small timeframes as there is a lot of noise in those timeframes, which may lead to confusion and misunderstanding. Hence, if one wants to profit greatly from this strategy, he/she should trade in 15 minutes or a higher time frame.

Indicators

We will be using just one technical indicator, and that is ‘Simple Moving Average (SMA)’ with 5 or 10 as it’s period. No other indicators are used in this strategy.

Currency Pairs

The strategy is suitable for trading in all currency pairs, including major, minor, and some exotic pairs. However, illiquid currency pairs should be avoided as the price action patterns are not reliable in these pairs.

Strategy Concept

In this strategy, we will be using the concept of previous highs and lows instead of support and resistance to act as our reference points. This is easy to understand and easier to spot in a chart. We will then anticipate these highs and lows as our support and resistance areas, which could break out of. Lows on a price chart are points where the price found support and started to go up.

In other words, this is a price point where there were ready sellers. When price revisits that area, sell orders get triggered, and the price starts to fall. However, during a breakout scenario, the momentum of the price is so much that it breaks the previous high and continues moving south. The Opposite is true for the breakdown of previous lows.

At times it is seen that even when the previous high or low is broken, the price doesn’t always continue in the direction of the breakout or breakdown. The price immediately retreats and bounces off the high or low. We will call these scenarios as fake-out or ‘stop-loss hunt.’ When price retraces back immediately, there is a high chance that it will continue in the same direction, at least until the latest hurdle. Let us explore the steps of the strategy.

Trade Setup

To explain this strategy, we will consider the EUR/USD currency pair and find a trade that fulfills all the criteria of the strategy. In this example, we will be analyzing the 1-hour time frame chart and look for appropriate price action patterns in the pair.

Step 1

The first step of the strategy is to look for highs and lows from where the market has traveled a fair amount of distance. Spotting for such areas in the direction of the major trend is preferred as the risk is lower in such trade setups. For instance, look for buying opportunities at lows of an uptrend and selling opportunities at the highs of a downtrend. This step is very important from a risk aversion point of view. Thus, one should give a lot of importance to this step of the strategy.

Step 2

The next step is to look for a fake-out price action pattern at the low, marked in the previous step. This is the first confirmation that buyers or sellers have come back into the market, and the banks have cleared out all the strategies that were placed below the low and above the high.

The below image shows how the price goes slightly below the previous low clearing all the stops of retail traders, and the last candle closes with a great amount of bullishness.

Step 3

In this step, we see where we take an entry in the market. We take an entry right after the price starts moving higher or lower and closes above or below the simple moving average (SMA), respectively. Conservative traders can wait for the price to retrace to the SMA and then take an entry while aggressive traders can enter right at the close of the candle.

The arrow mark in the below image shows that the entry is made at the close of the second bullish candle after the fake-out.

Step 4

We have one take-profit and one stop-loss point for this strategy where we take profit at the high or low as we had marked in the first step of the strategy while stop loss is placed below or above the low and high, respectively. If one is trading in the direction of the major trend, he/she can take profits at new highs or lows. However, one needs to be conservative while taking counter-trend trades.

Strategy Roundup

Stop-loss hunts are becoming as common as breakouts. By including this strategy in our trading arsenal, we will have something that we could use when we notice such patterns in the market where other traders are looking for breakouts. In this strategy, we have put a significant amount of stress on price action, which makes this strategy very reliable and consistent. One can use trailing stop-loss to protect their profit even when the target isn’t reached. All the best!

Categories
Forex Basic Strategies

Best Way To Trade The ‘Pin Bar’ Forex Chart Pattern – The Pin Bar Reversal Strategy!

Introduction

Price action or Candlestick analysis combined with some of the factors and confirmations is more reliable as they work out even without using too many indicators on the price chart. Using many indicators on the charts makes it difficult for traders to see the bigger picture (opportunities) in the market. We have numerous candlestick patterns in trading, but there are few on which many traders have their eyes on. One of those is the Pin bar candlestick pattern.

The pin bar candle is mostly used as a reversal pattern. A pin bar typically consists of a price bar with a long wick or shadow. The region between the open and close of the pin bar is called its real body, and a long tail is known as the wick. Pin bars generally have small real bodies in comparison to their long wick. The body of the pin bar is one-third of the total size of the candle. The long wicks of the candle show the area of the price that was rejected and signifies that the price will now move in the opposite direction of the wick.

The psychology behind trading a pin bar candle is that when a price is moving in one direction and reaches significant support or resistance level, it gets rejections. Rejection in a downtrend signifies that the seller pressure (supply) in the market is decreasing, and the buyer pressure (demand) has started increasing and vice versa. The pin bar, either bullish or bearish, signifies that the price does not want to go more down or up and want to reverse from that strong support or resistance level.

Understanding The Bullish & Bearish Pin Bars

Every time a pin bar candle occurring at a strong level does not always mean that the market is going to reverse from that level. To make this valuable, we must see that the overall picture and not just a single candle. In this trading strategy, we will see how we can analyze the overall market near that confluence level. Before that, let’s understand the two types of pin bar candlestick patterns.

Bullish Pin Bar Reversal Pattern

The bullish pin bar candle occurs when the price comes near a strong support level; this leads to the formation of a long wick of the pin bar and shows rejection from that level. This candle usually forms at the end of a downtrend and signifies that there can be either a short-term uptrend or a full reversal forming a strong uptrend.

Bearish Pin Bar Reversal Pattern

The bearish pin bar candle occurs when the price comes near a strong resistance level; this leads to the formation of a long wick of the pin bar and shows rejection from that level. This candle usually forms at the end of an uptrend and signifies that there can be either a short-term downtrend or a full reversal forming a strong downtrend.

Trading Strategies

Pairing The Pin Bar candles With Support & Resistance Levels

As already mentioned, just finding a pin bar candle at the support and resistance level is just not sufficient to trade. We have to figure out what the market is exactly trying to show us. When we see the candles approaching a strong support or resistance level, we have to analyze all the previous candles carefully. If the candles are very big and the momentum is very high, it is less likely to bounce back from that particular level. So, what we have to do is carefully track the candles with wicks. Candles with wicks show that the particular trend momentum is getting weak, and the pressure is reducing as the level is approaching.

After we see candles with wicks and some weaker candles, we will wait for our pin bar candle. As soon as we see the pin bar candle, we have to wait for the next candle to close above the pin bar’s high. We can then buy or sell in the market and place our stop loss 2-3 pips below the pin bar’s low.

In the below USDCAD 1Hr chart, we can see that the market touches the support level 3 times, the first time the candle was a long and strong bearish candle, and so we must take trades as the picture is still not clear. The second time when the market reaches the support, we see the candles have small bodies and more wicks. This tells us that the seller pressure is decreasing. Finally, for the third time, the market started getting rejections even before touching the support level, and we can also see so many long wicks in the candles. Finally, we see a pin bar candle touching the support level and getting the rejection, and then we see so good bullish momentum.

Below is the chart of USDCAD 1hr, market getting a rejection from the resistance level.

Pin Bar Pattern + Bollinger Bands

We are already familiar with one of the famous indicator called the Bollinger band that is used to measure the volatility of the market. We will now use a pin bar with the Bollinger band and understand how we can find some good trades opportunities.

The below chart is USDCAD 1Hr time frame over here. We can see that the market has not pierced the lower band since a long time as mostly the price is between the upper and the lower band. Moving forward, when the candles come close to the lower band, we see a pin bar occurring after the market gets rejection. After the formation of a pin bar candle, we can see the market getting the buying momentum, and it becomes bullish.

Trading With The Confluence Level

As from the above strategies, we are clear how the market behaves when a pin bar occurs at strong support and resistance level and the extreme level of Bollinger band. Now we will see what happens when a pin bar occurs at confluence level. A confluence level is an area that is on the radar of many traders, and many technical indicators generate the same signal. This trading concept is used by price action traders to filter their entry points and spot high probability signals in the market.

The below example is the pin bar forming at the extreme lower band and a strong support level. We can see that as the market reaches the support level, the bodies of the candles get weaker and smaller, forming longer wicks. Also, the pin bar pierces the lower band near that support level giving us a better signal for a buy.

Talking about the entry and exit points, our entry will be the point when the next candle crosses the high of the pin bar candle. As we see, it is a bullish pin bar; we can be sure that our entry is good if it crosses the high with good momentum. Our exit here will be the next strong resistance level. If you use a trailing stop loss, then we can move the stop loss to breakeven and be in the trade as long as you see the higher high higher low as, after a trend reversal, the candles move very fast and gives more profit and risk to reward ratio.

Conclusion

Trading with a pin bar candle has been proven to be one of the most effective trading strategies. As we saw, we must have a watch on all the candles when it approaches a confluence level because a single candlestick will not give us much information about what market is going to do next. The reliability of these candles is more with the higher time frame as it omits the noises on the chart, and we can have a clear picture. If you are a day trader, then you can 30min or 1hr time frame for executing the trade. Cheers!

Categories
Forex Course

75. Using Moving Average Crossovers To Take Trades

Introduction

In the previous article, we learned how to use the moving average for determining the direction trend. The Moving Average lines not only helps us in identifying the direction of the market but also tells us when a trend is about to end and potentially reverse. In today’s lesson, we will see how the moving averages can be used to enter trades at the reversal of a trend.

The principle of the strategy is to discover the crossover of the two moving averages on the chart. When the moving averages crossover, it is a sign of market reversal halting the existing trend. So at this point, we need to find a suitable ‘entry.’

Moving Average Crossover Strategy

Let us consider an example to explain the above-discussed strategy. Below, we have a daily chart of USD/CHF on which we have plotted the two moving averages (10-Period & 20-period). We can see the market being in a strong downtrend, and it is also confirmed by the two moving averages, where the ‘faster’ MA is below the ‘slower’ MA.

The next step is to find the overlap of ‘faster’ MA with the ‘slower’ MA from above, which is also known as the crossover of MAs. Once the crossover happens, there is a higher chance of the trend reversing. The below chart shows precisely how the crossover takes place, which means the trend can potentially reverse anytime now.

But, we shouldn’t be directly going long soon after the crossover. We need to confirm the trend reversal. A ‘higher low’ after the crossover validates the trend reversal, and this could be the perfect setup for going ‘long’ in this currency pair.

The below chart shows the ‘higher low,’ which is formed exactly after the crossover. Therefore, we now have confirmation from the market, so we can take some risk-free positions.

As we can see, in the below chart, the trade goes in our favor and hits our initial target. However, aggressive traders can aim for a higher ‘take-profit‘ as the new uptrend can reverse the entire downtrend, which is seen on the left-hand side. The reversal is also confirmed by moving averages where the ‘faster’ MA is above the ‘slower’ MA. The stop-loss for this trade is placed below the identified ‘higher low’ with a take-profit at a new high or significant S&R area.

Conclusion

The crossover strategy works beautifully in both volatile and trending markets, but they do not work that well in ranging markets. This is because the crossover takes place multiple times in the ranging market, and this leads to confusion about the market direction. To find high probability trades, one can also combine the strategy with other technical indicators to get additional confirmation of the trend reversal. In the next article, we shall see how moving averages can act as key support and resistance levels.

[wp_quiz id=”65842″]
Categories
Forex Daily Topic Forex Price-Action Strategies

Manage Your Trade Differently on Different Charts

In today’s lesson, we are going to demonstrate an example of an H1 breakout strategy. Before hitting the target, at some point, the price gets sluggish. Nevertheless, it hits the target in the end. Let us now proceed to find out the lesson it has to offer us.

This is an H1 chart. The price gets choppy within these two horizontal lines. It has a rejection and makes a bearish move upon producing a bearish inside bar. The chart is yet to make a breakout. Until it makes a breakout, it does not have anything to offer to the buyers or the sellers. However, as it stands, the buyers may have an upper hand here. Let us proceed to the next chart.

Here it comes. After a long while, a candle breaches through the level of support closing well below it. The candle has a long lower shadow, but the breakout is explicit. The sellers are to wait for the next candle to close its lowest low to trigger a short entry.

The next candle comes out as a strong bearish candle. This is one perfect looking bearish candle to attract the sellers to trigger an entry. The sellers may trigger a short entry right after the candle closes, setting stop-loss above the level where the trend starts with 1R.

As expected, the price heads towards the South with good bearish momentum. However, look at the last candle. It comes out as a spinning top. In a strong bearish trend, it is not considered as a strong bullish reversal candle. Moreover, it is an H1 chart, and the entry is triggered based on the H1 breakout strategy. Thus, the sellers must hold their position and wait. To be precise, they should not even look at this chart anymore by following the rule of ‘Set and Forget.’

The price hits the target. The next candle, after the spinning top comes out as a bearish candle. However, it closes within consolidation support. If it were an H4 or the daily chart, the sellers would have to close the trade manually. This is the difference between trading on the minor chart and major chart.

If we have a plan to take trading as our fulltime business, we may have to trade on different charts from the 15M to Weekly. Trade management varies from chart to chart. This is what we must remember. In the beginning, we shall master on a particular chart that we are comfortable with. Then, we may start trading on the other charts, preferably on the demo first. Once we are confident, we may trade on that chart in our live account. We must not apply a strategy or manage the trade the same way on the weekly chart that we are successful on the H1 or the 15 Chart.

Categories
Forex Basic Strategies Forex Trading Strategies

How To Trade The Engulfing Candlestick Pattern Using Support/Resistance

Introduction

Engulfing is one of those candlestick patterns in the forex market that provides a useful way for traders to anticipate a possible reversal in the trend. There are two types of engulfing patterns – Bullish Engulfing and Bearish Engulfing. The engulfing candle’s bearish or bullishness is wholly based on its position in relation to the existing trend of an underlying asset.

Understanding The Types

A bullish engulfing pattern can appear anywhere in the trend. But it holds more significance if it appears in a downtrend. This pattern indicates the surge in buying pressure as it shows that more buyers are entering the market, driving the price action further up. This pattern consists of a bearish red candle and the second bullish candle completely engulfs the body of the previous red candle.

Interpretation – Always look for the bullish engulfing pattern in a clear downtrend. For entering a trade, traders must combine this pattern with support resistance levels or with any reliable technical indicator for additional confirmation of the trend reversal.

Bearish engulfing pattern is just the opposite of the bullish engulfing pattern. Instead of appearing at the bottom of the trend, this pattern appears at the top of the trend. We can say that more accurate and reliable signals can be generated when this pattern appears at the top of an uptrend. The bearish engulfing pattern consists of two candles. The first one being the green candle. This one is, next, engulfed by the subsequent red candle. The pattern triggers a reversal in an existing trend. It indicates the buyers are no longer able to push the price higher, and the bears took control of the market.

Interpretation – Always look for the bearish engulfing pattern in a clear uptrend. The second red candle must engulf the green candle ultimately, showing that bears are piling into the market aggressively. For entering a trade, traders must look for additional confirmation, such as support resistance levels or by using any reliable technical indicator.

Pairing the Engulfing pattern with Support/Resistance

Every trader has a unique way of trading the market. Some traders like to go with the trend while some traders only trade counter-trend moves. In this strategy, we have paired the engulfing pattern with support & resistance to show you how to trade the reversals correctly.

Confirm the downtrend first on your trading timeframe 

The first step of this trading strategy is to confirm the trend of any underlying asset. Let’s trade the bullish engulfing pattern. So as discussed, we should be finding the downtrend on the price chart. As you can see in the below NZD/USD currency pair was in an overall downtrend.

Find out the Bullish Engulfing pattern on your trading timeframe

The key to successful trading is to follow all the rules of the trading strategy. The engulfing pattern can be seen all over the price chart, but obviously, we can’t trade all of these patterns. We should be trading only those engulfing patterns that appear in the major support area.

In the below image, the NZD/USD was in an overall downtrend, and price action respects the major support area. Market prints the engulfing pattern at the support zone, which indicates that the buyers are more likely to lead the price.

Entry, Take Profit & Stop loss

Enter the trade right after you see the bullish engulfing pattern at the S&R area. Take-profit targets depend on your trading style. If you are a swing trader or full-time trader, hold your positions for more extended targets. If you are an intraday trader, close your position at the nearest resistance area.

You can also book partial profits at a significant resistance area and close your full position when the market prints the bearish engulfing pattern. In this strategy, we took the buy at a significant support zone, so it’s a healthy practice to put stop loss just below the support area.

Look at the below image; you can see that price action goes above the significant resistance area. But we made sure to close our positions at the resistance area as we don’t want our money to be blocked in a single trade for a long time. Overall it was good 4R trade.

Bottom Line

There are so many different ways to take trades to use the engulfing pattern. Statistically, the engulfing pattern works better when traded at the bottom or top of the trend. So make sure to check their location before placing the trades. One other possible way to trade am Engulfing Pattern is when it is combined with Moving Averages. But even that way, make sure to trade the engulfing pattern at the significant support and resistance areas. Some traders use reliable indicators like MACD to confirm the trend reversals by using the overbought and oversold levels. That’s about the Engulfing pattern strategy. Make sure to find these patterns and trade them in your upcoming trading activities. Let us know if you have any questions in the comments below. Cheers!

Categories
Forex Basic Strategies

The Most Simple Scalping Strategy To Trade The Forex Market!

What is Scalping?

Scalping is one of the trading styles in the forex market, which is gaining popularity with the emergence of artificial intelligence and automated trading systems. Nowadays, there are a set of traders who enjoy scalping than day trading, swing trading, or position trading.

The main difference between scalping and other styles of trading is that in scalping, the trading time frame is very short and face-paced. The holding period does not last more than a few minutes, whereas ‘positional’ traders hold their trades from 1-Hour to few weeks. Scalpers find trading opportunities on very short timeframes such as the 1-Minute and 3-Minutes.

Impulsive traders are the ones who are most attracted to scalping, as they don’t want to wait for a trade to set up on the higher time frame. Sadly, new traders fall into this trap and start scalping the market, totally unaware of the risk it carries.

To scalp, a trader needs to be experienced. We recommend first being consistently profitable on the higher time frame or swing trading and then move on to scalping. Because this form of trading is extremely difficult as it requires a trader to make decisions in mere seconds or minutes.

5-Minute Scalping Strategy

In this section, we’ll cover a simple yet very effective scalping strategy on the 5-minute timeframe. The most suitable time to implement this strategy is during volatile market conditions. This means the best results are obtained during the New York-London session overlap (8:00 AM to 12:00 PM EST). During this time, trading costs are also relatively low, and liquidity is high, which is essential for the scalpers to take a trade.

We will be using two exponential moving averages in this strategy. Below are the indicators that one needs to apply to their charts.

  • 50-Period exponential moving average
  • 200-Period exponential moving average
  • Stochastic indicator

The Strategy

Let us look at the detailed steps involved in the 5-minute scalping strategy.

Step 1️⃣ – Identify the current trend

The two EMAs are used to indicate the trend in the 5-minute chart. To identify the larger trend, a trader will have to change the time frame to 15-minutes. Identifying the bigger trend is crucial to understand the overall direction of the market. The 50-period EMA is much faster than the 200-period EMA, which means it reacts to price changes more quickly.

If a faster (50-period) EMA crosses above the slower EMA (200-period), it means the prices are starting to rise, and the uptrend is more likely to be established. Similarly, a cross of faster EMA below the slower EMA indicates a drop in the price, and that also means a downtrend is about to form. Always make sure to take trades in the direction of the major trend.

Step 2️⃣ – Look for a pullback

Once we determine the current trend on the 5-minute chart based on EMA’s, it is time to wait for a pullback and stabilization of the price. This is one of the most important steps in this strategy as prices tend to make false moves after strong ups or downs. By waiting for the pullbacks, we can prevent ourselves from entering long or short positions too early.

Step 3️⃣ – Confirmation with the Stochastic Indicator

Finally, the Stochastic indicator gives the confirmation signal and helps us to take only highly-profitable trades. A reading above 80 indicates that the recent up move was strong, and a down move can be expected at any time. This is referred to as the overbought market condition. Whereas, a reading below 20 indicates that the recent down move was strong, and an up move is about to come. This market condition is referred to as the oversold market condition. After a pullback to the EMA’s, the Stochastic Indicator’s final confirmation gives us the perfect trade entry.

Let us understand this strategy better with the help of an example.

Chart-1

The above figure is a 5-minute chart of a currency pair, and the 200-period EMA is represented by the orange line while the 50-period EMA is represented by the pink line. The cross of the pink line above the orange line signals that the currency pair is entering into an uptrend on the 5-minute chart. As long as the faster EMA remains above the slower EMA, we’ll only look for buying opportunities. This step is to identify the direction and crossing of the two EMAs.

Chart-2

A trader shouldn’t be going ‘long’ as soon as they see the lines crossing. They should always wait for the pullback and only then take an entry. In ‘chart-2’, when we move further, we were getting the kind of pullback that we exactly need.

The next question is, at which point to buy?

Chart-3

The Stochastic plotted in the above chart helps in giving us the perfect entry points by getting into the oversold area. One can take a risk-free entry after all the indicators support the direction of the market.

Chart-4
Finally, the trade would look something like this (chart-4). The risk to reward ratio (RRR) of this trade is 2:5, which is very good. Also, make sure to place precise stop-loss and take profit orders, as shown above.

Final words

Scalping is a faced-paced way of trading that is preferred by a lot of traders these days. The main difference between scalping and other styles of trading is the timeframes involved in analyzing the market. This type of trading carries certain risks that are unavoidable, such as high trading costs and market noise, which can impact your profits. We hope you find this article informative. Let us know if you have any questions below. Cheers!

Categories
Forex Basic Strategies

Learning The Art Of Fading In Trading

What is Fading?

Fading involves placing trades against the trend to profit from a reversal. Using the concept of fading, a trader will short sell, expecting the momentum to fade when the market is in an uptrend. Likewise, he/she will buy a currency pair with the expectation that the move will fade away and reverse when the market is in a downtrend.

The fading strategy involves three assumptions:

  • The price is either at the overbought or oversold condition.
  • Early buyers or sellers are getting ready to take profits.
  • Current position holders might be at risk.

Overbought and oversold conditions can be identified using technical indicators such as the Relative Strength Index (RSI). Momentum shows the signs of shifting of forces from bulls to bears or vice-versa. And as these signs develop, current holders of the asset start to rethink their positions.

These conditions get exaggerated after an earnings announcement or news release. This may lead to a knee-jerk reaction on the part of other traders to sell the currency pair. As a result, this reaction gets overextended, and a mean-reversion takes place.

Now let us see how does the strategy work and what are the necessary steps you need to take to profit from the strategy:

The Fading strategy

Step 1 – Identify market extremes from the daily time frame 

The first step is identifying overbought and oversold zones using technical indicators or chart patterns.

The popular indicators used for identifying the zones include:

The overbought and oversold conditions are indicated by reading above or below a certain level. For example, the market is said to be in an overbought condition if the RSI is above 70, and it is said to be in oversold condition if the RSI is below 30. This can help traders in identifying fading opportunities.

In the above chart, we can see how the RSI indicator was crossing the normal range when the market gets into the overbought zone. One can find trading opportunities just using the RSI indicator stand-alone. But to trade like how professionals trade, we need to use a lot more tools.

Traders may also use familiar chart patterns or analysis based on price action and watching the price continuously.

Step 2 – Look for signs of capitulation

The second step in the strategy is to look for early signs of capitulation or change in the short-term trend using momentum. This can be mostly done by using candlestick patterns or price action with a volume indicator. We suggest looking for price action signals.

Some other signs to watch for include:

  • When technical indicators start to fade or move away from their extreme overbought or oversold levels.
  • The volume of the significant trend starts decreasing, or the volume of the opposite trend starts increasing.
  • Bearish candlestick patterns appear (in case of an uptrend), or critical support and resistance are broken.

It’s essential to identify these signs early to maximize profit and avoid mistakes.

The signs mentioned above can be explained better with the help of some figures.

Image 1

In the above image, we clearly see that the market is in an uptrend and has been trending from a few days (as it is a daily chart). The volume of the significant trend is also high with the decreasing volume of the sellers, which is a good sign for bulls. But in the end, the volume starts to decrease. The RSI declines sharply after entering the overbought zone for a while.

Image 2

Immediately we see an increase in the volume of sellers with a drastic drop in the RSI indicator (Image 2). The signs are getting stronger for a reversal, and this trend can continue. All the traders who are holding the currency pair start exiting the market. This could be one of the most reliable signs for us to take appropriate action.

Image 3

Finally, we see a break in the ‘support’ by the bears with high volume. Now we have combined all the tools, and each of them is indicating a reversal. Hence, we should take a position in the opposite direction. This is precisely the kind of setup that you need to be looking for every time.

Image 4

In order to find the exact entry, we need to magnify the chart. For this, you need to go on a lower time frame to analyze and set your stop-loss or target based on that time frame. This is mandatory for getting precise entries. The above figure is the lower time frame chart of the explained example.

Note: Images 1, 2 & 3 belong to the daily timeframe, whereas Image 4 belongs to the 4H timeframe.

Step 3 – Enter the trade with a stop-loss and take-profit

The last step is to enter the market with a compulsory stop-loss and take profit to ensure risk management is in place. In this strategy, a stop-loss order can be placed above the price where the RSI enters the overbought/oversold zone. Avoid putting small stop-loss as you can prematurely get stopped out from the trade.

Profit can be booked when the volume of your trend starts to decrease. Now, the stop-loss and target would be placed, as shown in the above chart. This trade would result in a risk-to-reward ratio of a minimum of 1:5. Traders can also use a moving average or any other indicator to set a profit-taking price level. Limit orders are almost used by all traders to avoid any slippage or other issues, particularly in less liquid assets.

Bottom line

Fading strategies can be considered as risky as you are going against the trend. It is always a good idea to take a trade if the risk to reward ratio is favorable. These strategies are commonly used by short to medium term traders to capitalize on short term reversals. Even though it seems risky, it can be extremely profitable if appropriately used. This is because the market has reached a saturation state, and there has to be some balancing force. This is why fading strategies are also known as contrarian strategies. Because they work on the assumption that prices deviating far from the trend, tend to reverse and revert back. That’s about Art Of Fading. If you have any queries, let us know in the comments below. Cheers.

Categories
Forex Basic Strategies

You Must Definitely Try These Most Promising Bollinger Bands Strategies

Understanding Bollinger Bands

Bollinger Bands is one of the most famous indicators out there, developed by a technical analyst named John Bollinger in the 1980s. This indicator primarily identifies the volatility level of a currency pair. Bollinger bands are volatility bands placed below and above a moving average. These bands are designed such that they automatically widen when the market volatility increases and narrow or contract when volatility drops.

One of the important purposes of the Bollinger bands is to determine the relative high and low prices of the market. As simple as it gets, the prices are comprehended to be low at the lower band and high at the higher band. With this definition, we can come up with trading patterns that can help predict the upcoming market trend.

Calculation

Bollinger bands have three bands, namely, the upper band, the middle(mean) band, the lower band. And they are calculated as follows:

Upper Band = Middle band + 20-day Standard deviation x 2

Middle Band = 20-period the moving average (20 SMA)

Lower Band = Middle band – 20-day Standard deviation x 2

Below is a chart that has the Bollinger Bands embedded in it.

Setting up the Bollinger band

Every trading platform will ask you for the length of the Bollinger band. By default, the value is set to 20. And it is highly recommended to keep the default configurations to obtain optimal results from the indicator.

Now, let’s put all of the above information into action by analyzing some great strategies.

Strategy 1: Double Bottom Setup

One of the most popular trading strategies using the Bollinger bands is the double bottom setup. This is because John Bollinger himself said that, “Bollinger bands can be used in pattern recognition to define pure price patterns such as “W” bottoms, “M” tops, momentum, shifts, etc.”.

In this strategy, we will be discussing the “W” bottoms, and “M” tops.

W-Bottoms

This strategy can be applied when the market is coming from a predominant downtrend. There are four stages to consider to trade the W-bottom (double bottom) Bollinger band strategy.

  1. The reaction low must form around the lower band.
  2. From the lower band, there must be a bounce up to the middle band.
  3. Thirdly, there should be a new low, which must hold above the lower band. The hold above the previous low confirms the inability of the sellers to push the prices lower.
  4. Lastly, the price must move off the low and break the previous resistance. This confirms the start of bullishness in the market.

Example

In the below chart, the market was in a downtrend. It made a low at the lower band and went up until the middle band and held. This satisfies the first two considerations in the W-bottom strategy. Moving forward, the price comes down again, but this time, it holds above the lower band. This confirms the third consideration, as well. Finally, the market shoots up and breaks the resistance (black line), indicating a buy signal.

M-top

M-top is the opposite of the W-bottom strategy. But, the working of this strategy remains the same. That is, firstly, the price must try to go above the upper band. Secondly, the price should drop down to the middle band. Thirdly, it must go up again but not higher than the previous high. And finally, the market must drop below the support line. And once all these scenarios take place, we can prepare to go short.

Example

In the below chart, the market went above the upper band, pulled back to the middle band, shot up again, but could not go higher than the upper band, and finally, the price dropped below the support (black line). So, this is when we can confidently hit the sell.

Strategy 2: Return to the Mean or Middle of the band

If you wish to extract only small profits from the market, then this strategy will be apt for you. This strategy mainly focusses only on small movements rather than big swings. An advantage of this strategy is that you will be able to pull off consistent profits and reduce risks significantly.

The principle of this strategy is to go long when the price comes down to the middle line. However, to reduce the risk, there are some factors which are implemented when trading this strategy. Below, we have mentioned some of the techniques to trade this strategy.

In the below chart, we can see that the market shot to the upside, pulled back to the middle line, and again shot up north. Here, if we were buying at the middle line, we would have made a profit out of it. But, not always will this work in your favor.

There are some points you must consider before trading this strategy. Firstly, the initial buyers must be very strong. Secondly, the sellers (pullback) must be weaker than the preceding buyers. Thirdly, the price must hold around the mean line. The occurrence of patterns like doji, hammer, spinning top, etc. around the mean line can give additional confirmation on the trade. Therefore, once all the criteria are satisfied, you can go for the buy.

Bottom line

Bollinger band is an excellent indicator to determine the direction of the market. The bands indicate if the market is at a relatively high or low. And these highs and lows help in predicting if the market is continuing its trend or preparing to reverse. Also, chartists combine this indicator with other indicators to have an extra edge over their trade.

We hope you understood these strategies. It is highly recommended to try these in your daily trading activities. With practice, you can master this indicator and can make consistent profits if used correctly. Let u know if you have any questions in the comments below. Happy Trading!

Categories
Forex Basic Strategies Forex Trading Strategies

How To Trade Options With a Directional Bias Strategy

Introduction

A challenging question every trader comes across in his trading career is: whether he should be buying a call option or a put option? Traders establish directional bias by studying high-level charts, support and resistance levels, price action, and fundamental indicators. Dow Theory suggests that the market will continue to move in the same direction until an external force causes a reversal or break in the trend.

Directional bias plays a major role in the ‘trend-reversal’ strategy than in the ‘trend following’ strategy. Directional bias will help a trader decide if he should be going long or short in options. You can also identify the direction of the market trend. Once you establish a directional bias, you will have greater confidence in executing your trading strategy. During the process of execution, none of the actions are emotionally driven.

How to develop a directional bias?

Any trade which includes thorough preparation should consist of establishing directional bias, and it is a two-step process.

  1. Predicting the direction of the price move and overall trend.
  2. Identifying the trigger points and trading rules that will confirm our directional bias.

Determining a directional is just one step towards making a successful trade. There are many more things we need to put together before taking a trade. After backtesting a few strategies, establish some trading rules. Remember to include only those rules that confirm your directional bias. Confirming directional bias is an excellent habit that improves the success rate of trades.

A successful trading strategy is more about the right planning and psychology rather than a single entry technique or trading system. Options trading is said to be complex, hence requires a lot of knowledge before one can trade it. Other than that, you need to consider factors that are specific to options like time decay, option theta, option beta, and option gamma. We explain here how it is to be done correctly.

Directional bias through momentum indicators

The easiest way to establish directional bias is by using momentum indicators and price action analysis. If prices are trending in an upward direction, making higher highs and higher lows, traders should look to buy. On the other hand, if prices are making lower lows and lower highs, traders should look to sell. In this strategy, momentum indicators can be used as an additional confirmation tool.

Example of buying a call option

In the above picture, the orange line graph represents the momentum indicator. The price action pattern shows a formation of higher highs and higher lows, with the indicator pointing towards the buy-side. The candlestick pattern should be such that there is no opposing force that could possibly reverse the current trend.

Point of entry: The exact point of entry would be after the formation of at least one higher high and higher low. This is confirmed by the momentum indicator, which shows a sudden rise above the average value. This is a low-risk entry with maximum reward.

Take profit and stop loss: When the momentum indicator no longer makes higher highs and higher lows with the main trend, it is a sign that the trend might be coming to an end. Hence, you should book profits here. Stop-loss in this strategy should be placed below the previous higher low.

Note: All the trades discussed above are to be executed using a call option and not using the cash segment. It is advised to choose the strike prices accordingly. There could be some differences in the entry price and stop loss of options when compared to spot prices.

The same rules apply for sell trade as well, but here a put option needs to be bought, and you would essentially want to look for lower lows and lower highs.

Directional bias through Moving averages

We would like to conclude our methods of establishing directional bias with the use of ‘moving averages.’ This is one such technical indicator, which can be used to develop any new strategy. For this strategy, we use the 20-day moving average as it is considered to be one of the most powerful moving averages.

In the above figure, we have plotted the 20-day Moving average using the yellow line. This is a simpler strategy as compared to the momentum indicator strategy. Here, if you see the price trading above the 20-day MA, you should form a directional bias to buy. And if the price is trading below the 20-day MA, you should form a directional bias to sell.

Point of entry: When price crosses the MA line on any side and stays there for more than four candles, you should be taking entry in that direction of the trend. More the number of candles better will be the entry.

Take profit and stop loss: You can continue to hold on to the trade until the price reverses and crosses the other side of the MA line. If it crosses, book out your profits. Stop-loss can be placed at the high or low from where the market reverses.

Conclusion

If you use any other way of developing directional bias, make sure that it needs to be simple. If it becomes complicated, it can increase the complexity of your trading strategy. Having a directional bias will make you trade in the direction of the dominant trend, which is less risky. Finally, a trader needs to abstain from opening positions that have no directional bias.

We hope you find this article informative. If you have any questions regarding this strategy, please let us know in the comments below. Happy Trading!

Categories
Forex Basic Strategies

Understanding The N-period Narrow Range Trading Strategy

Introduction

There are three states in the market – trend state, channel state, and range state. A trending market is the one where the market makes higher highs or lower lows, and a ranging market is a state where the price goes through a consolidation phase. The channels can be considered as a particular case of range as they work similarly to a range, but are tilted.

What is consolidation?

To understand this strategy, we must first understand the concept of consolidation. Consolidation is a technical term in trading where the market loses momentum and starts to move in the form of a range.

A common tendency of the market is that, when the price starts to move in a range and begins to consolidate, it prepares blast in one of the sides. So, people always keep an eye on currency pairs, which are in a consolidation phase.

N-Period Narrow Range

In the N-period narrow range, the period N takes two values –4 and 7. So, we have the 4-period narrow range and the 7-period narrow range. These two are also referred to as the NR4 (Narrow Range 4) and the NR7 (Narrow Range 7).

The NR4 and NR7 trading strategy

This strategy is basically a modified range breakout strategy where the market consolidates in the beginning and then blasts out of a narrow range.

In NR4, number 4 refers to the period under consideration. That is, for NR4, the last four days are taken into consideration, and for NR7, the last seven days are taken into account.

What is the NR4 and NR7 strategy?

It is a breakout trading technique where we consider the last four or sever days to apply this strategy. And in these four or seven days, we compare the range of all these days and determine if the current day is an NR4 or NR7 day. Once we obtain the NR4 or NR7 day, we gear up to go long or short.

Calculating the range

Firstly, to trade this strategy, consider the candlestick chart on the daily timeframe. The range of a particular day is calculated as the difference between the high price and the low price.

What is the NR4 day and the NR7 day?

NR4 day

In layman’s terms, the least fluctuated day (4th day) in the recent four days is called the NR4 day. Technically, it is the day whose range is the smallest out of the previous four trading days.

NR7 day

Similarly, when the 7th day in the last seven days moves the least number of pips, it is referred to as the NR7 day.

How to trade the NR4/NR7 strategy?

Following is a set by step procedure to trade this strategy:

  1. Find the high and low of the last few days (seven for NR7 and four for NR4).
  2. Calculate the range (high – low) for each day under consideration.
  3. Compare these range values with the previous days.
  4. Determine if the present day is an NR4 or NR7 day. If so, then wait for the price to break out of the high or low of the NR4/NR7 day.

If the market breaks above the high, then it is an indication for a buy, or if it breaks below the low, then it is an indication for a sell.

Illustration to trade the N-period Narrow Range

Trading the NR4/NR7 strategy is simple. But, as far as the consistency of this strategy is concerned, one can make more out of this strategy only when the NR4/NR7 day appears in the right location. Hence, understanding ‘where’ the NR4/NR7 occurs is very vital. So, let’s consider a few examples to support this statement.

Below is the chart of USD/CAD on the Daily timeframe. We can clearly see that the market is moving in a channel state. Now, to trade this strategy, we blend it with the working of a channel.

Trading a channel is pretty straightforward. When the price is at the bottom of the channel, we look for buying opportunities, and when it is at the top of the channel, we look for short-selling opportunities. With this mind, we try spotting the NR4/NR7 days in these regions.

Below is the magnified image of the chart where we’re going to analyze the market. Initially, the market came down rolling until the bottom of the channel and began to hold down there. And the candle which held at the bottom turned out to be the NR7 day as it has the smallest range compared to the previous six days. This is an indication that the market (sellers) is slowing down. Later, the market blasts up north and breaks the high of the NR7 day. Therefore, now we can prepare to go long.

And as we can see, the trade performs exceptionally well. This is because the location was in favor of the NR7 day.

Continuing with the same chart, the market which was at the bottom of the channel now moves up to the top of the channel. During this up move, the market loses its momentum every step of the way and ends up giving us the NR4 day at the top of the Channel. Hence, once the price breaks below the low of the NR4 candle, we can go for the short sell. And as a result, the market does break through the NR4 day and heads down south.

Bottom line

Trading in the markets is not an easy task. There is no indicator, pattern, or strategy that can consistently work standalone. There are several other considerations that should be made before getting into a trade. For example, in the above trades, we saw how we combined the NR4/NR7 with the concept of channels and made a profit from them. Also, for any strategy, you trade, make sure that there is logical reasoning behind taking the trade. We hope you find this strategy informative. If you have any questions, please let us know in the comments below.

Categories
Forex Trading Strategies

The Connors & Raschke’s 80-20 Strategy


Introduction


The original Connors & Raschke’s 80-20 Strategy is an intraday strategy that was published in Street Smarts by Larry Connors and Linda Raschke.

It is based on the Taylor Trading Technique, which is a manual for swing trading. Taylor’s method was the result of the observation that the markets move within a cycle that is made up of a buy day, a sell day, and a sell short day. That setup was further investigated by Steve Moore ar the Moore Research Center.

Mr. Moore focused on days that closed in the top 10% of the range for the day. Then, he checked on for the percent of time next day prices exceeded the previously established high, and, also, for the percentage of times it also closed higher.

His results showed that when prices closed in the top/bottom 10% of its range, it had an 80-90% chance of following-through the next session, but only 50% of them closed higher/lower. This fact implied an excellent possibility of reversal.

Derek Gibson, said Connors, found out that the market has an even higher chance of reversing if the set-up bar opened in the opposite end of the range. That is, a candlestick with short wicks and a large body. Therefore this pre-condition was added. To create more opportunities, they lowered the percent of the daily range from 90 to 80, because it didn’t affect the system’s profitability.


Long Setups


  1. Yesterday, the asset opened in the top 20% and closed in the lower 20% of its daily range.
  2. Today the market must trade at least 5-15 ticks below yesterday’s low. This is a guideline.
  3. An entry buy stop is then placed at yesterday’s low, once the trade is being filled, and an initial protective stop near the low extreme of today’s action.

Move the stop to lock in profits. This trade is a day trade only.


Short setups


  1. Yesterday the asset opened in the bottom 20% and closed in the higher 20% of its daily range.
  2. Today the market must trade at least 5-15 ticks above yesterday’s high This is a guideline.
  3. An entry sell stop is then placed at yesterday’s high, after being filled, and an initial protective stop near the upper extreme of today.

Move the stop to lock in profits. This trade is a day trade only.


Example of a trade


The Connors & Raschke's 80-20 Strategy


Testing the Strategy


We tested this strategy using the backtesting capabilities of the Multicharts64 version 11 Platform.

The naked strategy, as is, in EURUSD, USDGPY, and USDCHF over a range of 17 years, were positive in all cases. Below the equity curves for the three pairs:


Examining the parameter map


The figure above shows the parameter maps of the USD_CHF and the EUR_USD pairs. We see that the return of the strategy increases as the parameters move to the 50% level, meaning that the importance of the starting and ending point (Open to Close) in the previous candlestick is not essential. The critical fact is the next day’s break above(below) the previous highs(lows) and the subsequent return to that level (False Breakout).


Example of  50-50 System with optimized stops and targets on the EURUSD


As we said, this is a 50-50 system, meaning that we don’t care in which part of the candle is the Open and Close. This is a simple false breakout system.

We see that the curve is quite good over its 17-year history. Starting with 10,000 dollars, the final equity reached $72,000, for a 6X profit figure.


Looking at the Total Trade Analysis table, we can observe that this system is also robust, with almost 40% winners and an average Ratio Win to Average loss ( Reward/risk) of 2.19.


The shuffled Trades Analysis shows that the system is very reliable, with a likelihood of small drawdowns, depicting a max consecutive loss of 16 trades.


The Net Profit distribution Analysis shows that there is a 75% probability of getting a 5X equity profit over 16 years and a 25% probability of getting a 7X profit figure.


Above is the Max Consecutive Losing Streak analysis, which shows that there is less than 10% probability of ending above a 16 losing streak. Although you think that a 16-losing-streak is terrible, it is not, but we need to be prepared psychologically to endure it. This figure is the one needed to help us conservatively decide our risk strategy.

As I already mentioned in other strategy analyses, you, as a trader, need to decide which percent of your equity you can lose without losing your temper. Many don’t like to lose any amount so they shouldn’t trade, because losing streaks are part of the trading job. Many would say 10% while others 50%. That figure has a close relation to the rate of growth of your trading account because it will decide the size of your position.

And here it comes the way to do it. Once we know the distribution of drawdowns of our trading system, we, as traders, want to minimize the probabilities that a losing streak goes beyond our max drawdown figure. This is an approximation, but its good enough to allow us to decide the best position size for our risk tastes.

Let’s say we are an average-risk trader, and we will be upset if we lose ¼ of our account. Using this trading system, and admitting a 10% probability of error, we would choose 16 as the losing streak to compute our size per trade.

Therefore, we divide 25% equity drawdown by 16, which is 1.56%. In this case, we must trade using a 1.56% risk on every trade. That means that the cost of a trade computed by the distance from entry to stop-loss levels, multiplied by the dollar pip risk and by the number of contracts should be 1.56% of your current equity balance.

Let’s simplify it using elementary math:

Percent Risk (PR) = MaxDD / Max_losing_Streak

Dollar Risk = PR x Equity_Balance

Dollar Risk = (Entry-Stop) x PipCost x Nr_of_Contracts

Let’s call Entry-Stop, Pips. And NC the Number of Contracts. Then the equation is:

Dollar Risk = Pips x PipCost x NC

Let’s move the elements from this equation to compute the Nr of contracts.

NC = Dollar_Risk / (Pips x PipCost)


That’s all. Every trade will be different, and the distance in pips from entry to stop loss will be different, but we can compute the number of contracts quickly:

Let’s do an example. Our current balance is right now $12.000, and we want to enter a trade with 20 pips of risk, and our cost per pip is $10 per lot. Which is my optimal size?

Our Dollar Risk is 1.56% of $12,000 or $187

NC = 187 / (20 x 10) = 0.93 lots, or 93 micro-lots.


Computing the Performance of the System


Now we want to know how much on average are we going to get, monthly, from this system. That is easily computed using the numbers above. We know that this system’s history is 205 months long, and it had 1401 trades, which is seven trades per month on average. Evidently, this system trades very scarcely, but we can hold a basket of assets. Thus, If we manage to get a basket of 10 holdings, including pairs, crosses, indices, and metals, we could trade 70 times per month. And those trades will not overlap most of the time if the assets are chosen uncorrelated.

Based on our risk profile and the average Reward-to-risk ratio, we know that our average winning trade will be 2.2 times our average losing trade.

So,

AvgWin = 411

AvgLoss = 187

Our winning percentage is 40%, so our losing one is 60%

Then on a 10-asset basket, there will be 28 winners and 42 losers monthly, then:

Gross Profit: 411*28 = 11,508

Gross Loss:  42*187 =  7,854

Average Monthly Net Profit =11,508 – 7,854 = 3,654

This is an average 30,4% monthly from a $12,000 balance. Not bad!


Note: The computations and graphs were done using Multicharts 11 trading platform.


Categories
Crypto Market Analysis

NEO/ETH Long After The Breakout

NEO (NEO)

Market Cap. $5.22B

Circulating Supply: 65M NEO

Max Supply 100M NEO

Volume (24h) $205.42M

NEO/USD = $80.114

The NEO/ETH is trading at 0.12324 level after the impressive drop. Price increased as much as 0.13649 in the yesterday’s trading session, but failed to stay there and now seems very heavy. The rate is trading in the red after the second false breakout above a very strong dynamic resistance.

Price moves in range in the short term, so we’ll have a clear direction only after a valid breakout from this chart pattern.

NEO Technical Analysis:

NEO/ETH increased aggressively on Sunday after the false breakdown below the 50% Fibonacci retracement level. Price has found strong resistance at the upper median line (UML) of the descending pitchfork. It has made a false breakout above the outside sliding line (SL) of the descending pitchfork and now could come towards the former low (0.10991).

Personally, I believe that we may have a larger increase only after a valid breakout above the sliding line (SL). You could buy this crypto pair after the rate will close above the SL and after a retest. You can see that I’ve drawn an ascending pitchfork to catch a potential upside movement.

Price has made a false breakout above the median line (ml) of the minor ascending pitchfork, and now it could come back down towards the lower median line (lml). NEO/ETH is somehow expected to increase after the failure to approach and retest the median line (ML) of the descending pitchfork.

You should know that only a valid breakdown from the minor ascending pitchfork’s body and below the 0.10986 will invalidate a potential broader increase.

Conclusion

You could buy it after a valid breakout above the SL, and you could place a  first take profit at the first warning line (WL1) of the descending pitchfork. The second take profit could be placed at 0.16409 swing high.

©Forex.Academy

Categories
Forex Trading Strategies

The Turtle Soup plus One System

Turtle soup

As Newton found out, an action carries its reaction. The market found a solution to profit from these anticipated turtle breakouts: Turtle Soup.

Larry Connors and Linda Bradford Raschke wrote a beautiful book called Street Smarts, filled with many ideas to swing trade.

The method that Connors and Raschke propose looks to identify those times when a breakout fails and jump aboard to catch a reversal. By the way, this strategy can be traded in all markets and time frames.

The Turtle Soup rules for long positions (the inverse goes for short positions):

  1. The market must make a 20-period low. The lower, the better.
  2. The previous low must have happened four periods earlier.
  3. After the market fell below the 20-period low, we place an entry buy-stop five ticks above the previous day low.
  4. If the buy-stop is filled, buy a stop-loss some tics under the current period low.
  5. Use trailing stops, as the current position is moving profitably.
  6. Re-entry rule: if you’re stopped out, you may re-enter at your original entry price if this happens in the next two bars.

Turtle soup plus one

This strategy is identical to the Turtle Soup, except it happens one day later.

This strategy is more conservative, as it waits for the current bar to end, and sets the buy stop at the same place, but one bar later.

To show that two radically different ways to trade are both valid, I’ve tested this strategy from mid-2006 up to Jan 2018.

As we observe above, the strategy’s percent winners are about 23%, but with a Risk/reward factor- which is the average win to the average loss ratio- of 3.77. Please note, also, that the average trade is rather small. That is the result of a short timeframe.

To achieve those values, we used a trailing stop of 0.22%

Main metrics of the naked Turtle Soup Donchian fading System, on the EUR-USD:

Conclusions:

The system is good. The reward to risk ratio is great, but it is hard to take just one successful trade every four trades.

The system could be much more profitable if we can assess when the asset is in a trading range, apply it only when this condition happens, and avoid trading it during prolonged trends. This can be done using a filter that allows only propper trades. For example, trading only when the ±1 STD Bollinger bands  (see figure below- BB bands in cyan) are shrinking in size, and its centerline goes flat. We should avoid the trade when the Bollinger bands start expanding with its center curving up or down. That would ensure a much higher success ratio.


How to use Metatrader 4 to trade this strategy:

The Donchian Channel indicator can be directly downloaded to your MT4 from:

https://www.mql5.com/es/market/product/4782

When clicking download, a pop-up window appears:


Clicking “Yes, I have MetaTrader 4,” the indicator installs directly in your trading platform.

To load the indicator to a chart, on your MT4, go to Insert -> Indicators -> Custom- Donchian Price Channels tfmt4:

Then, a popup window with the parameter selection appears:


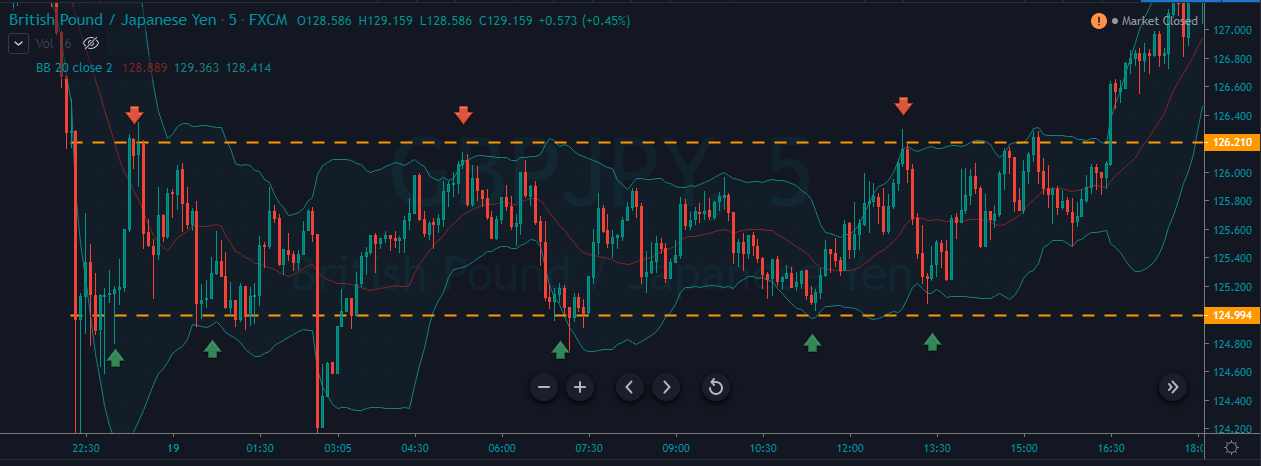
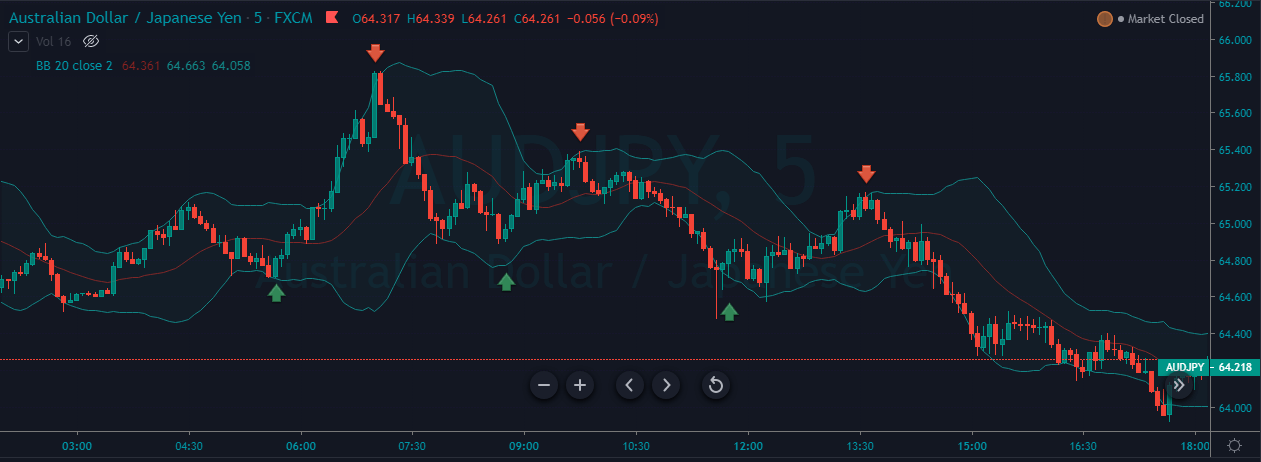
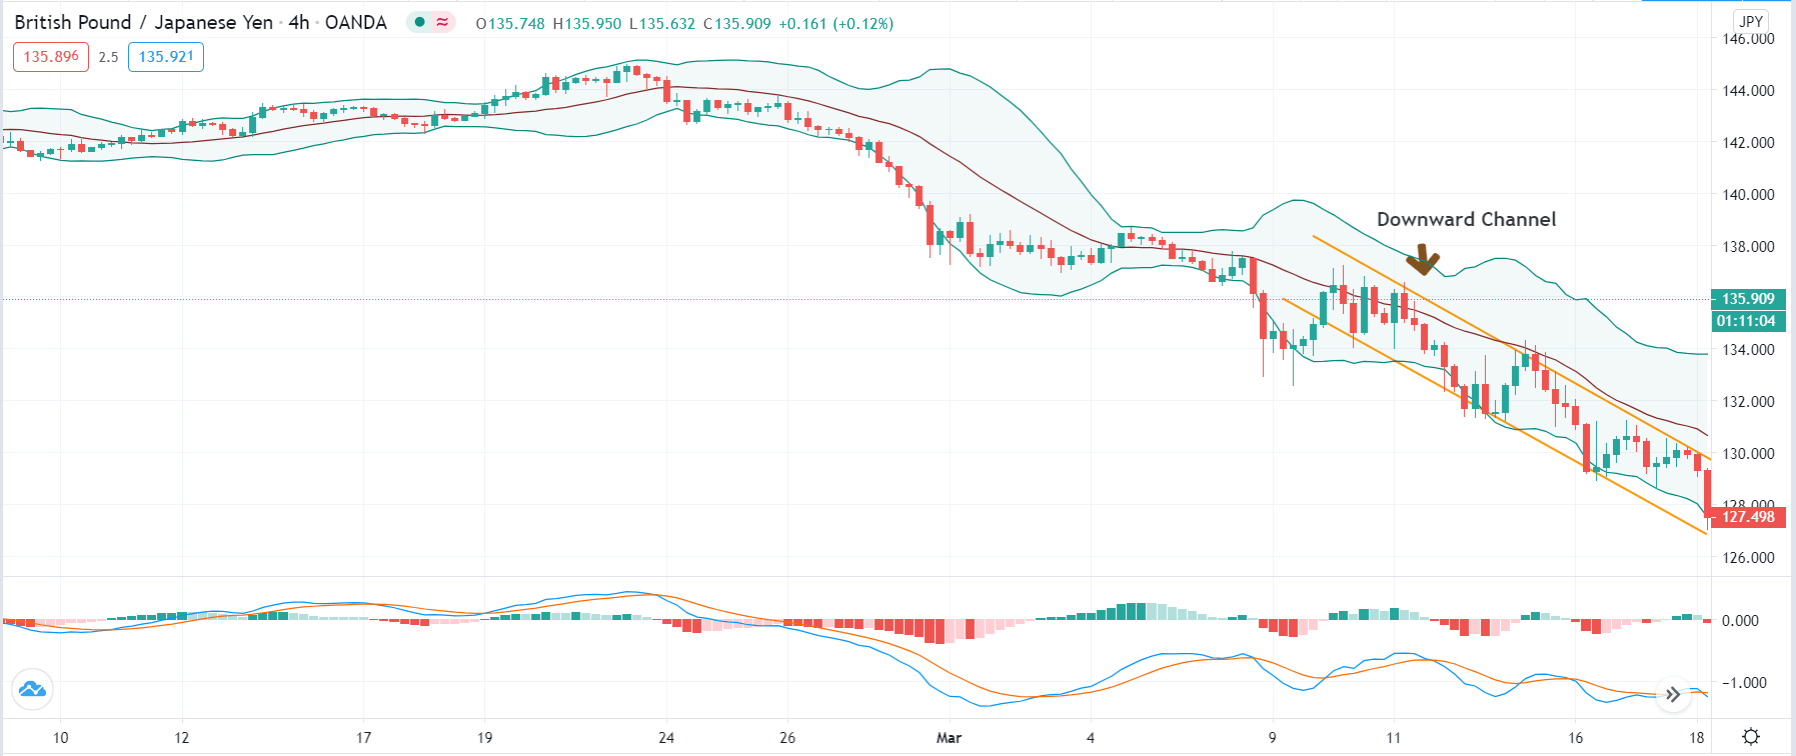
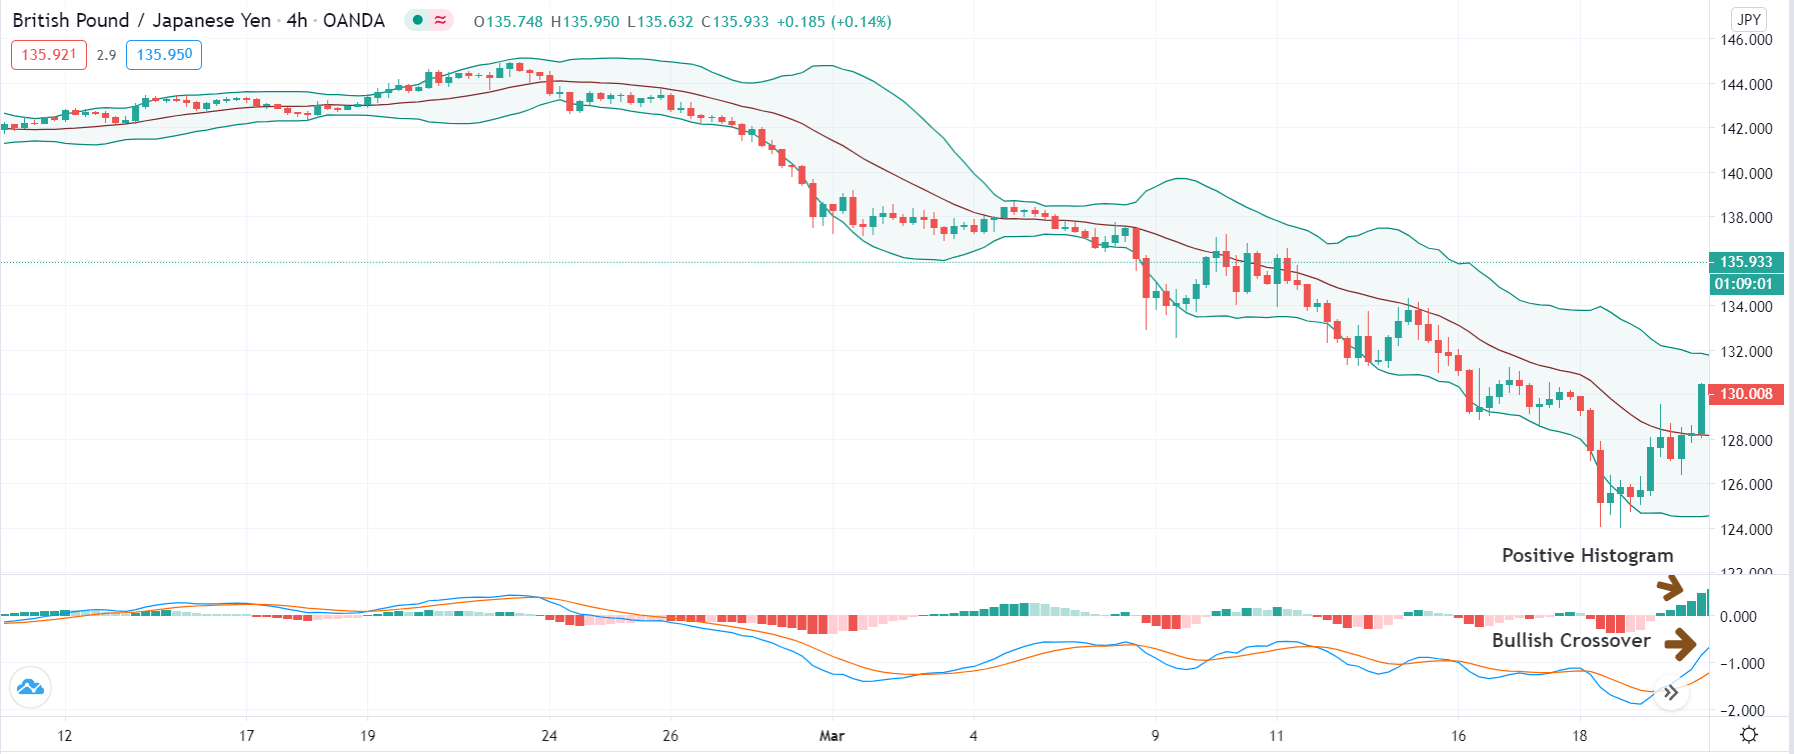
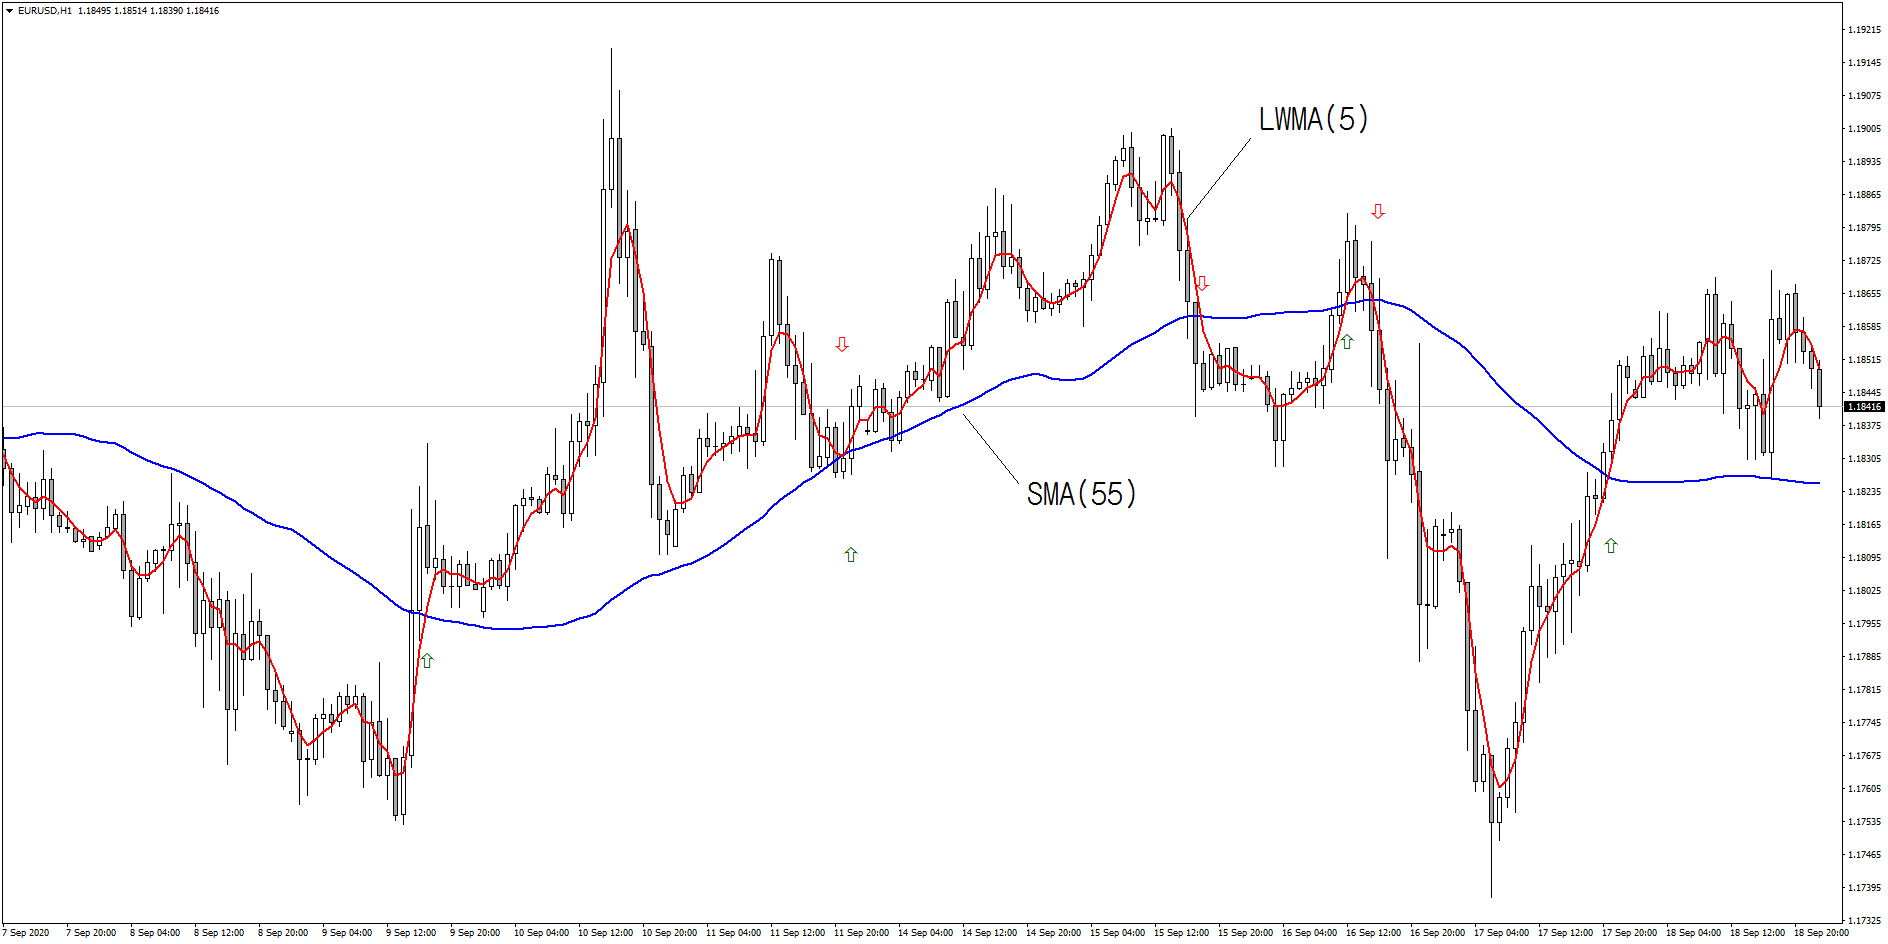
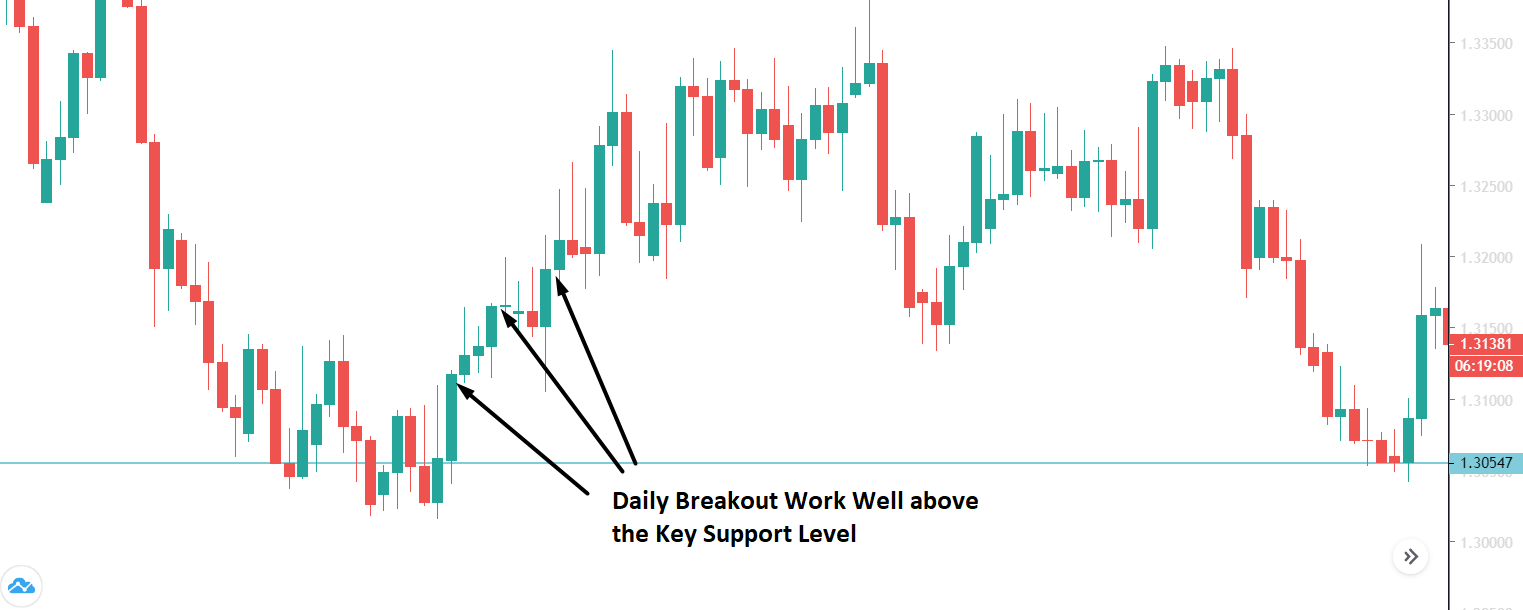
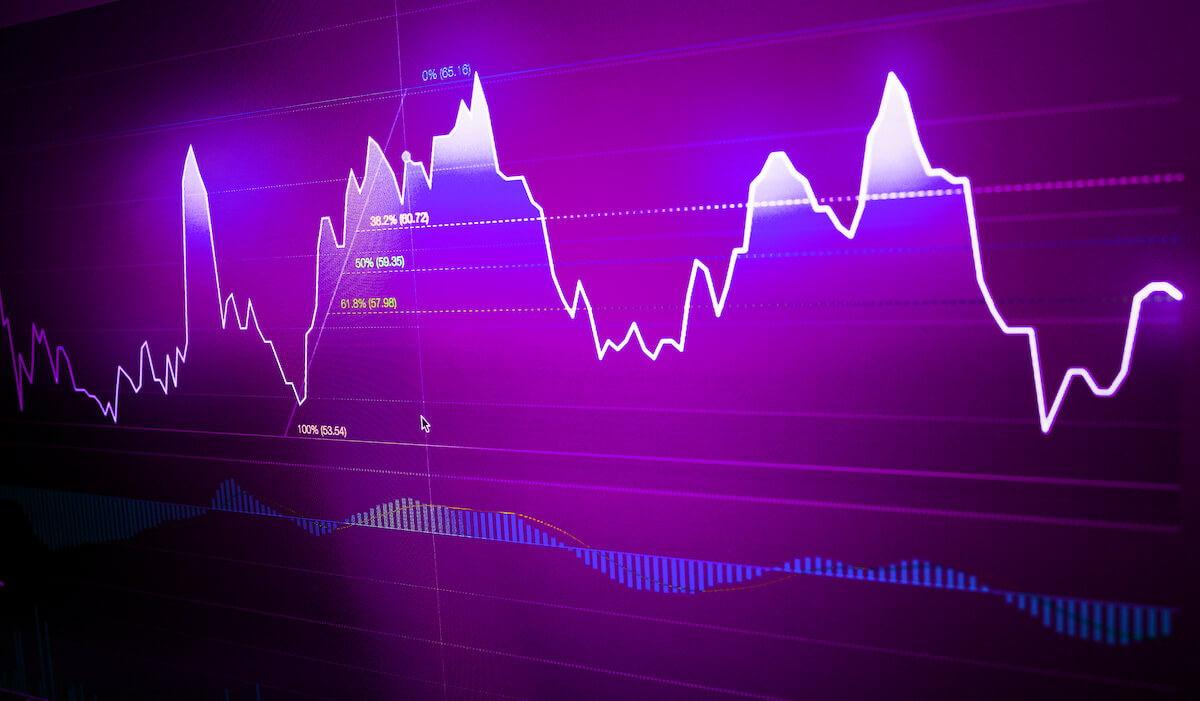
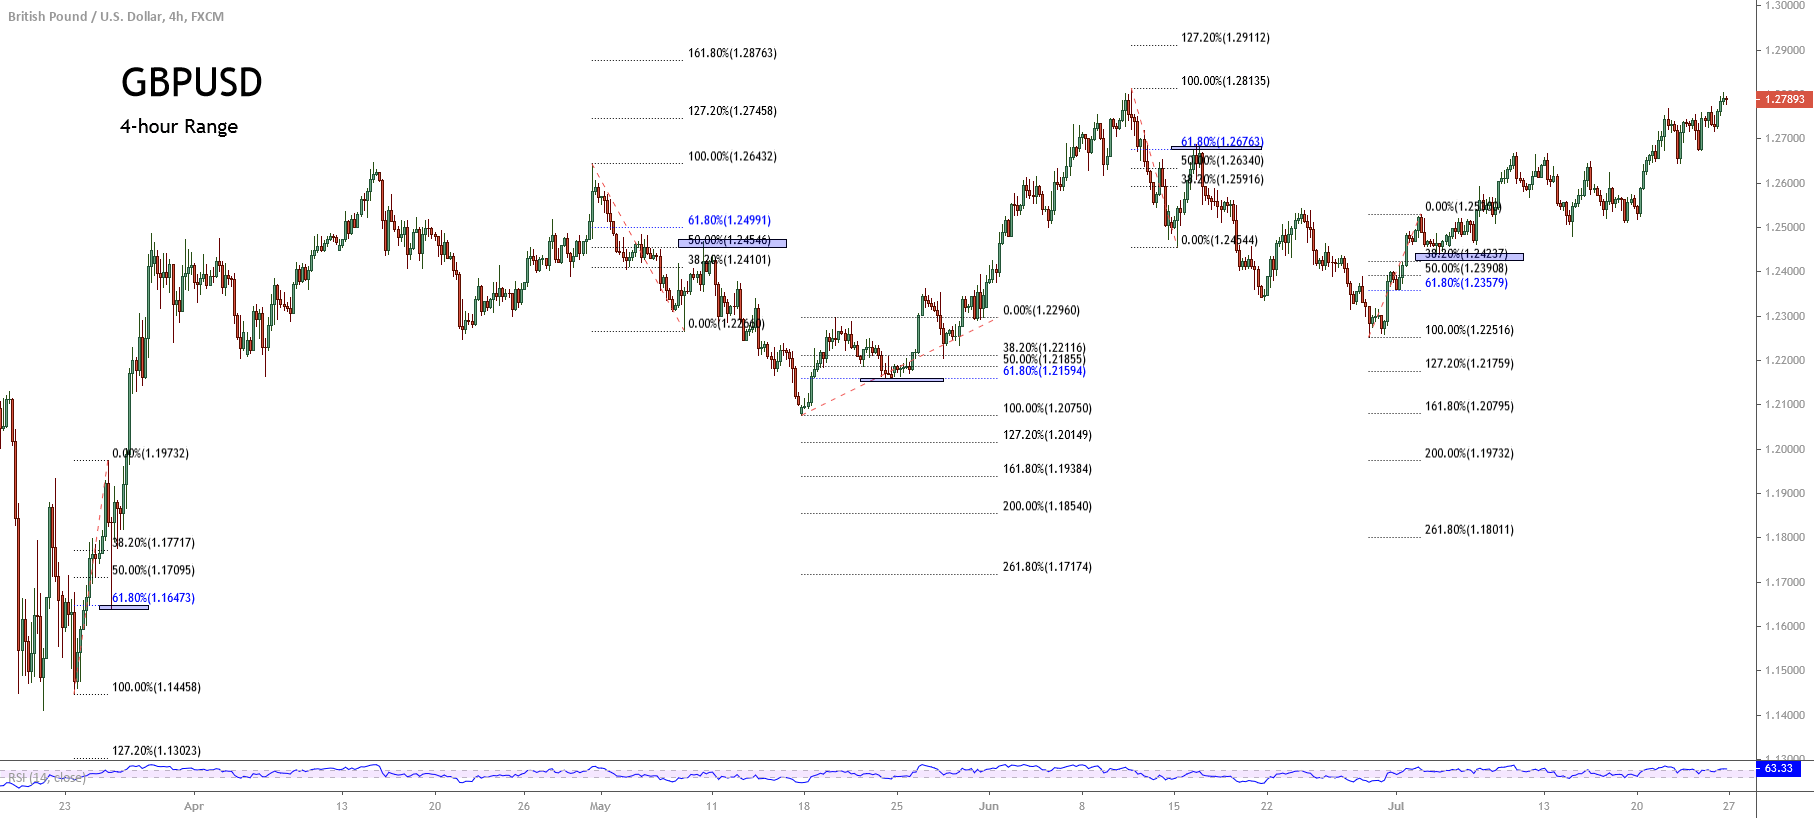
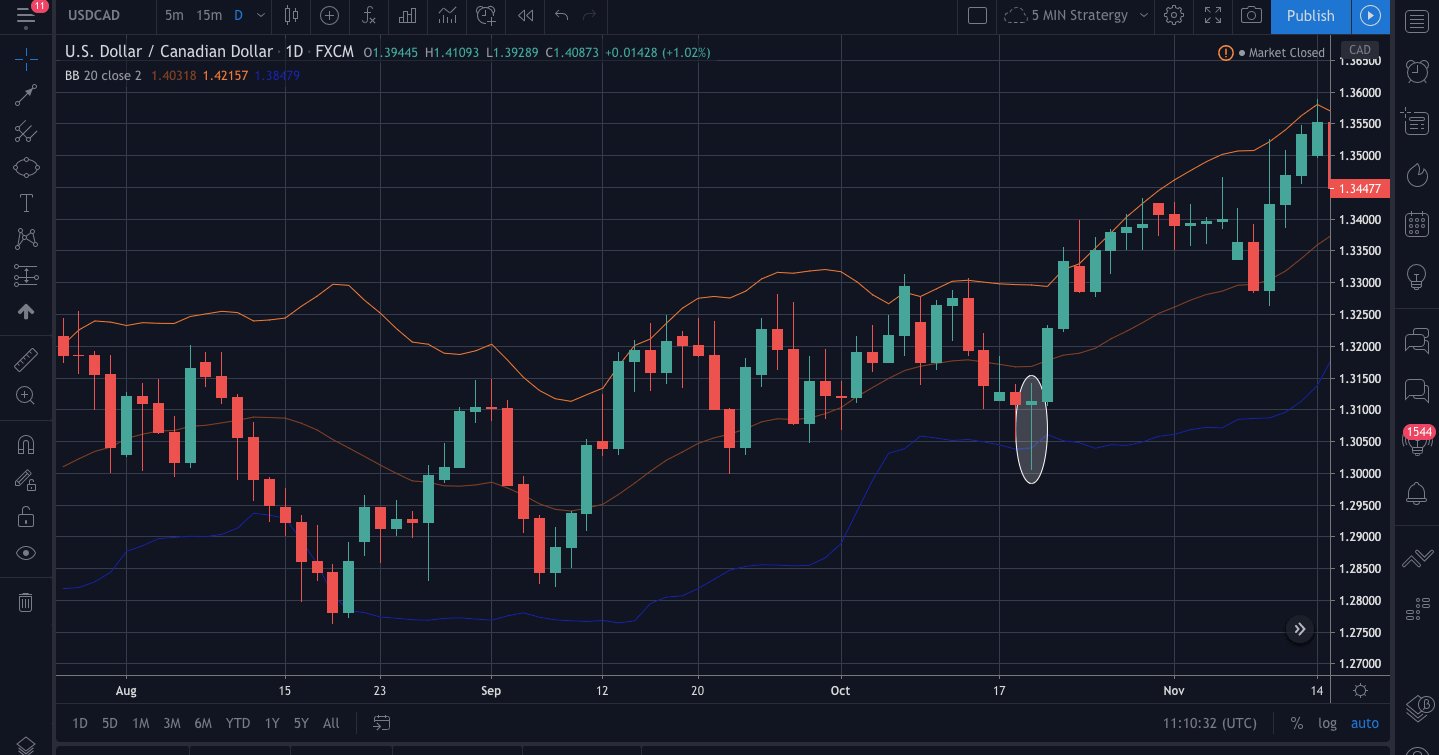
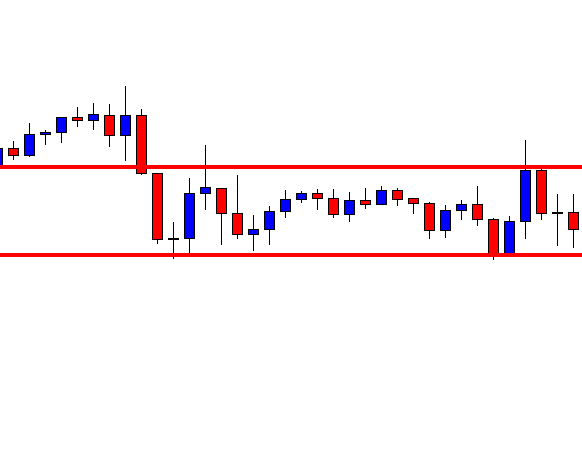
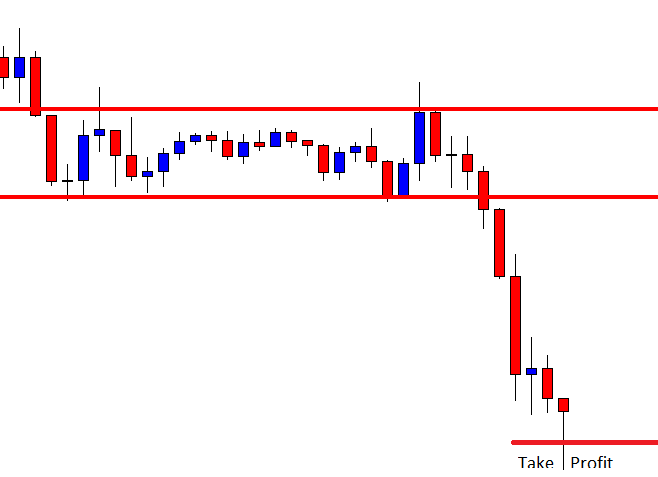
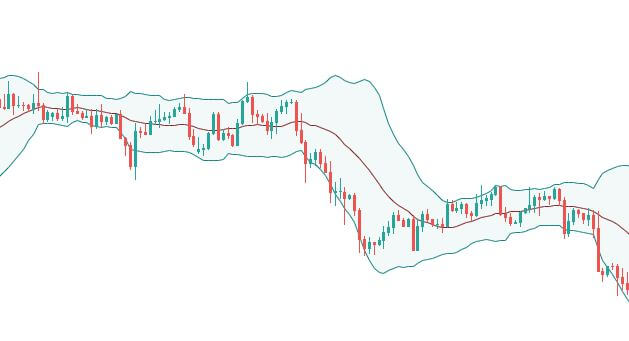
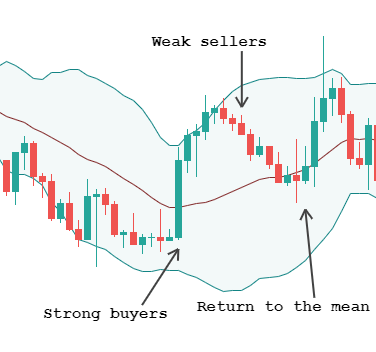
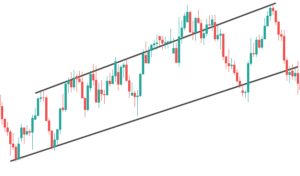
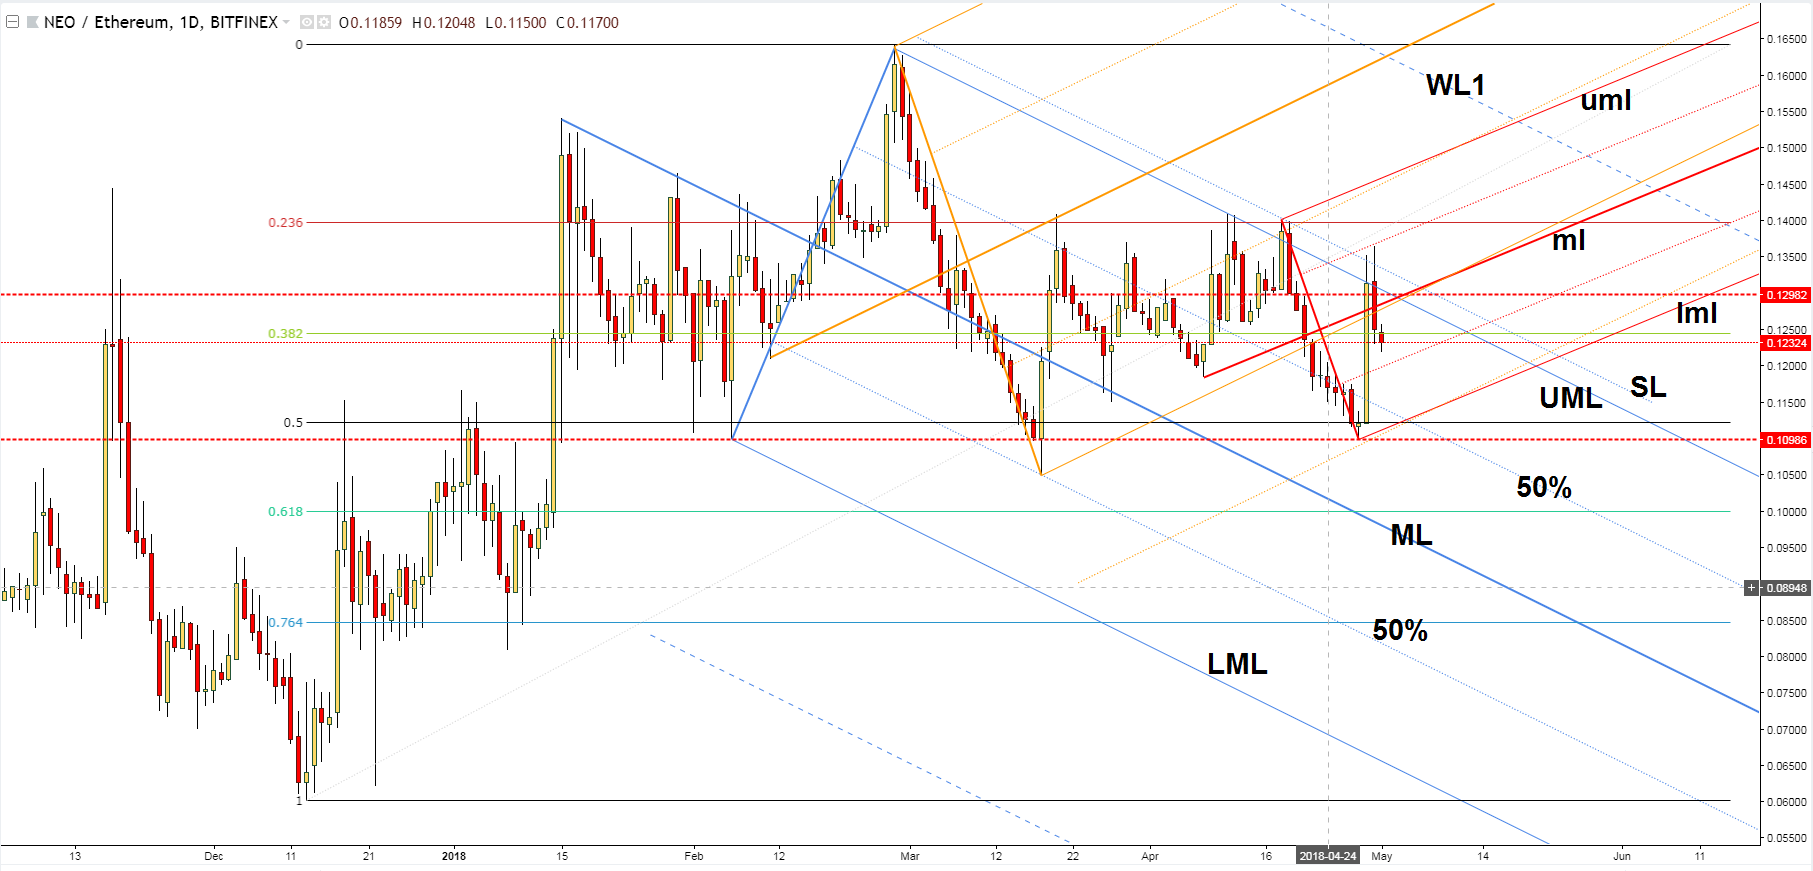
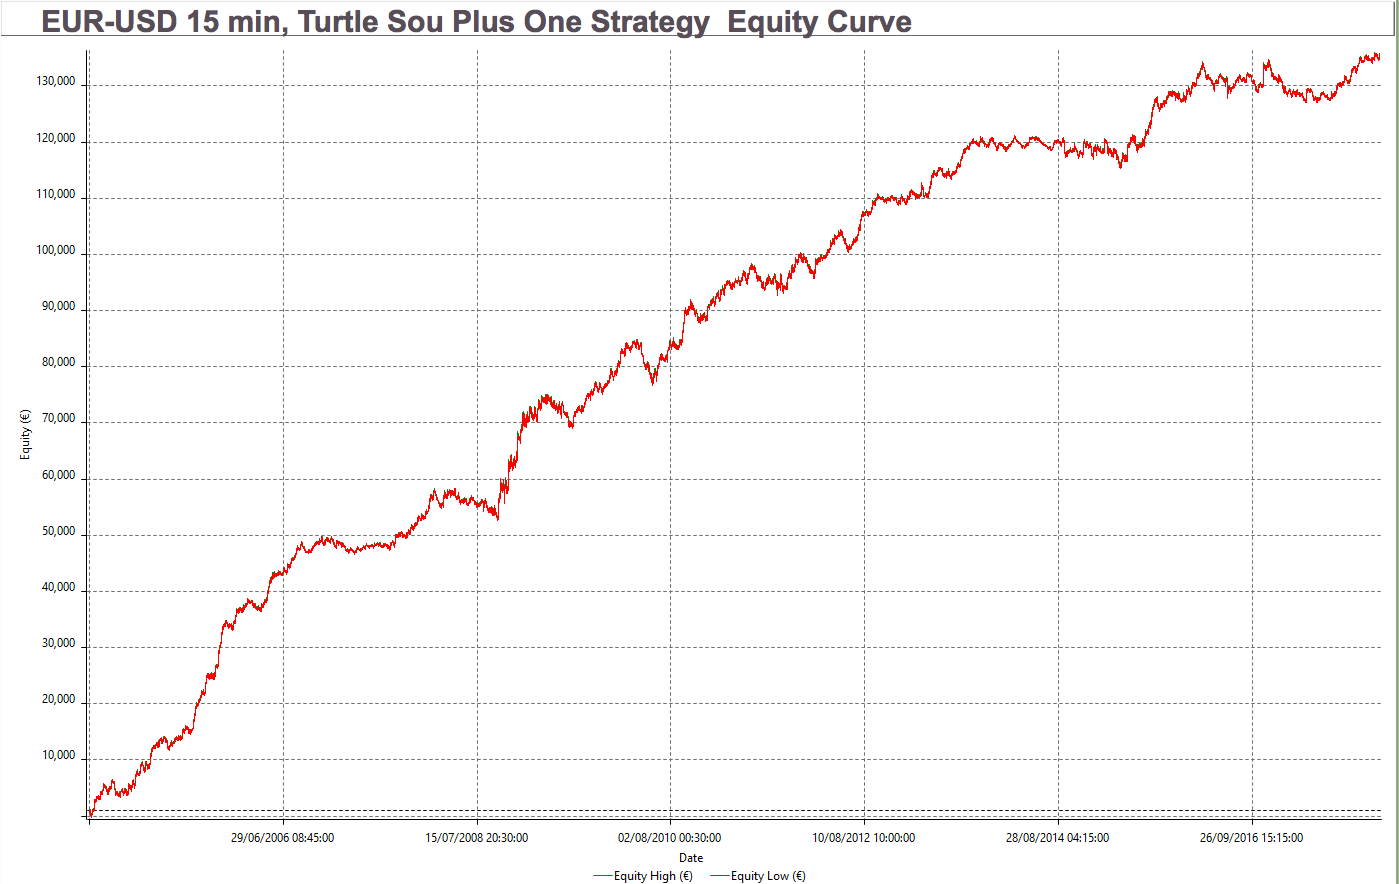
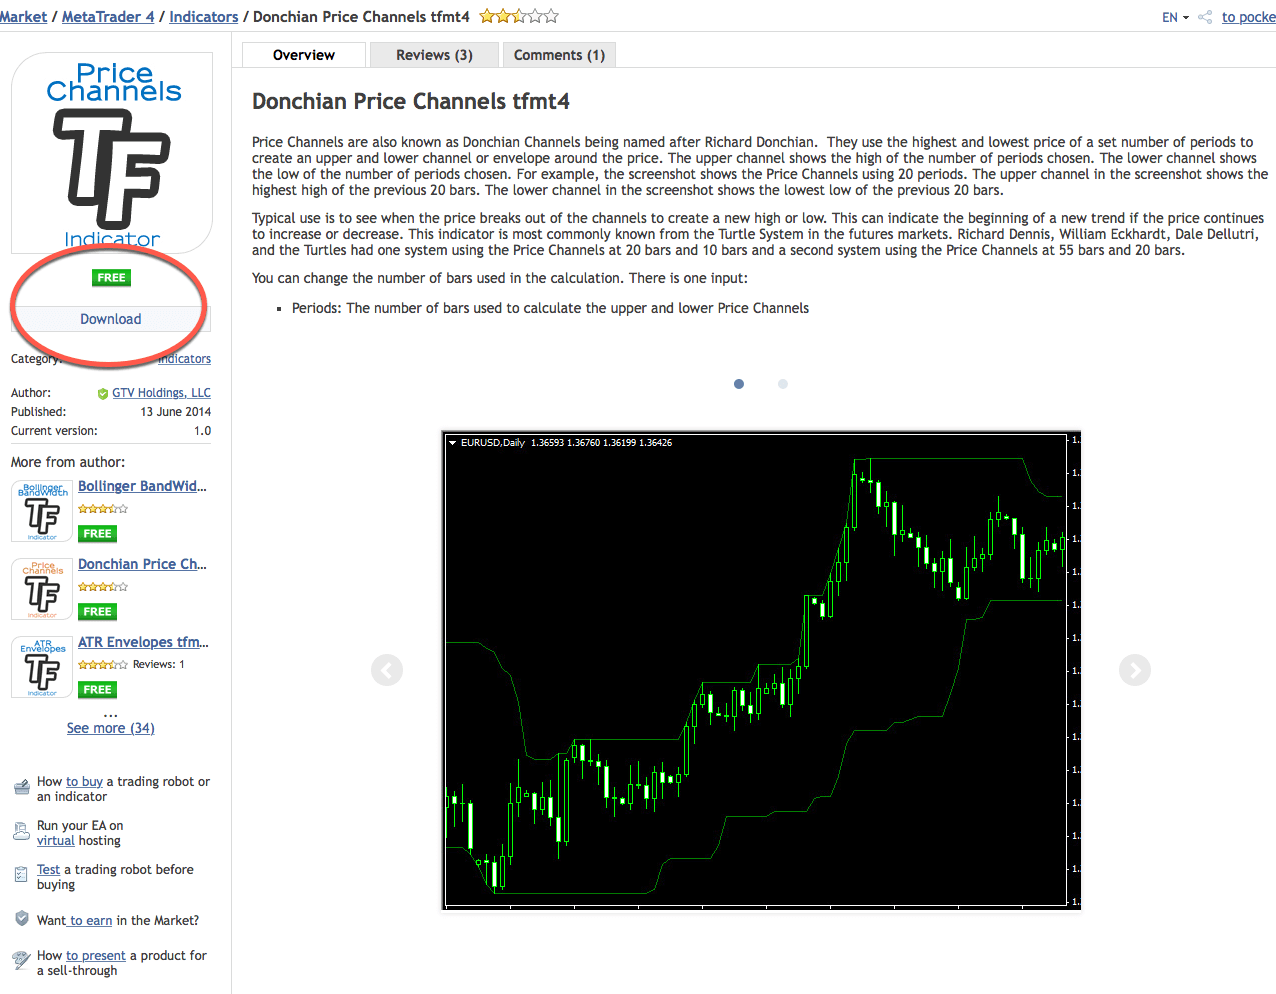
And, finally, we get the desired channel surrounding prices:


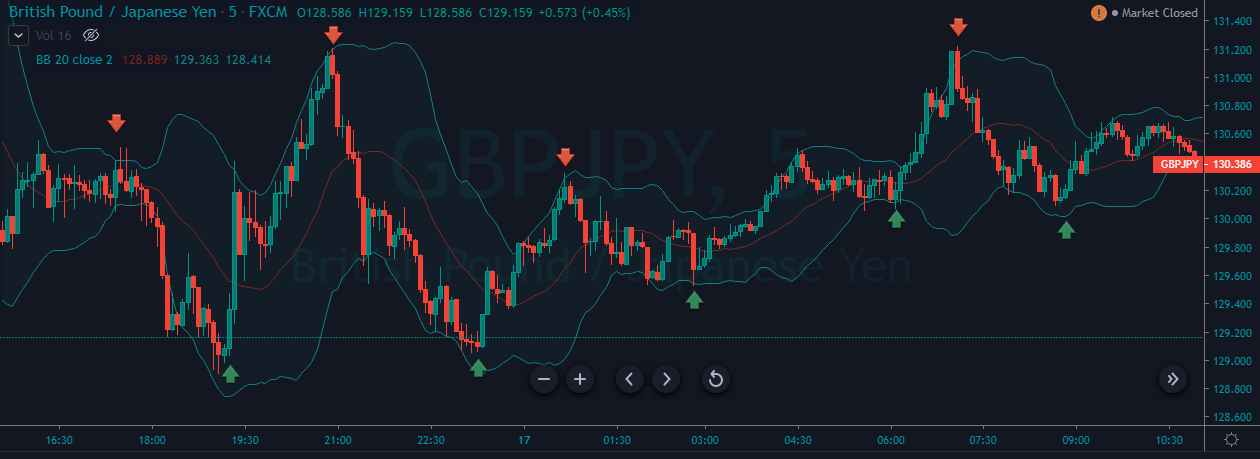
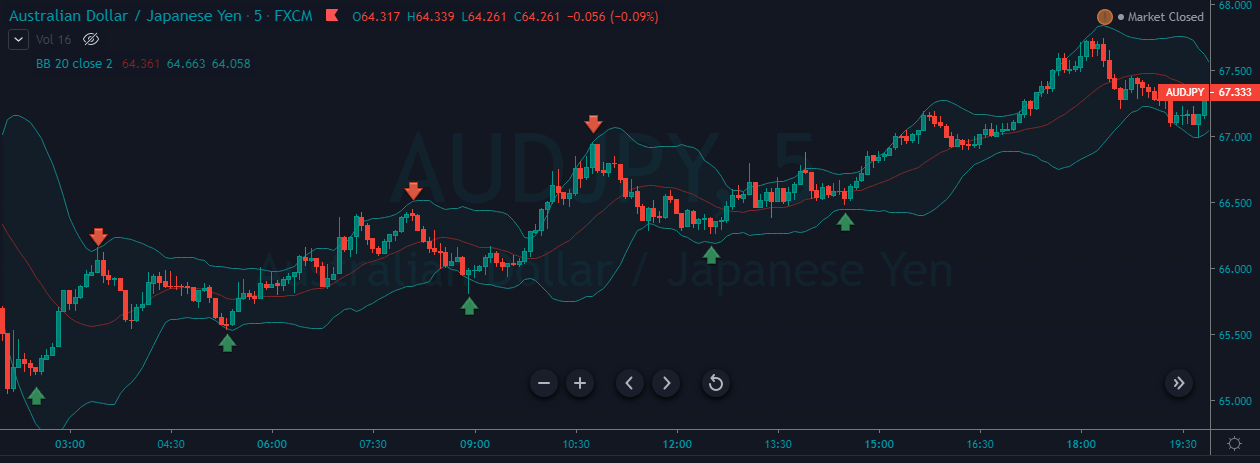
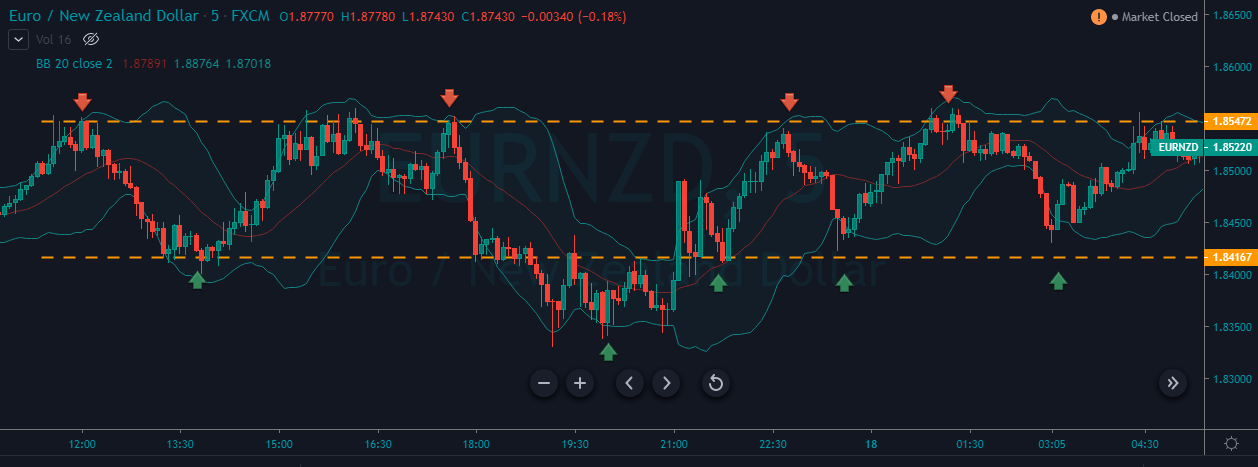
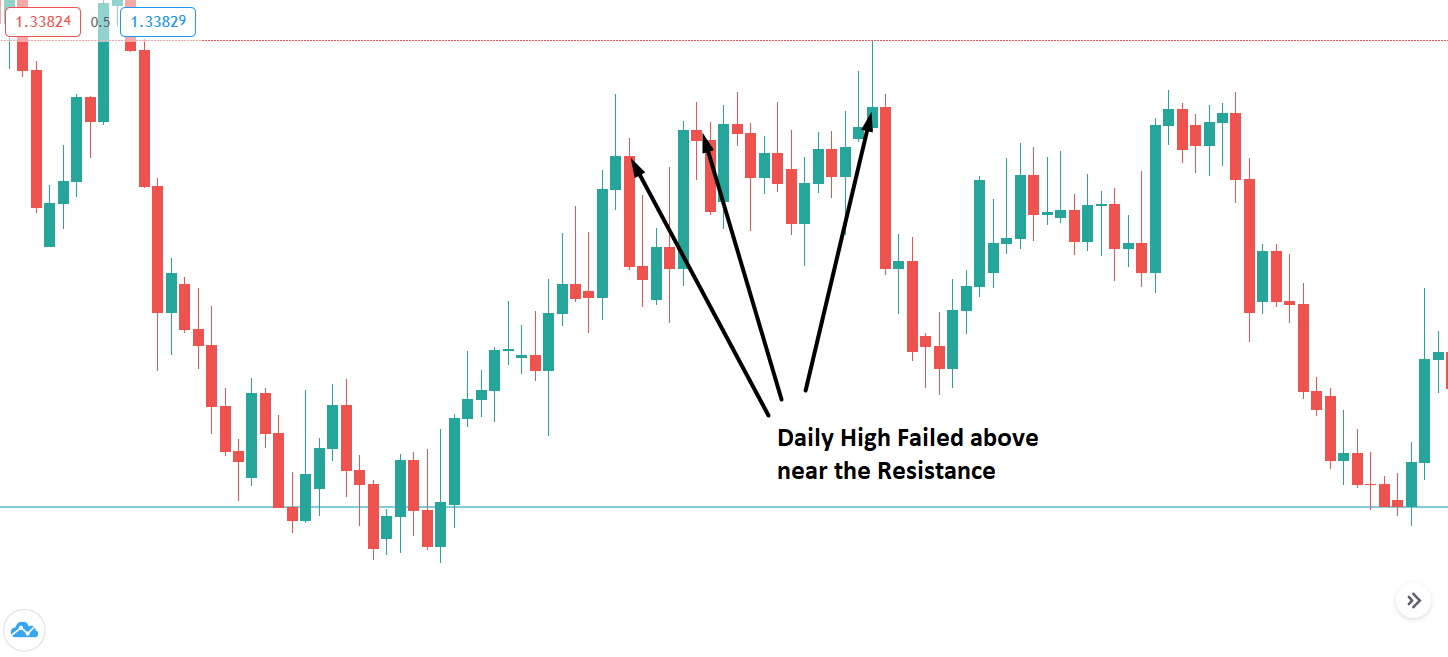
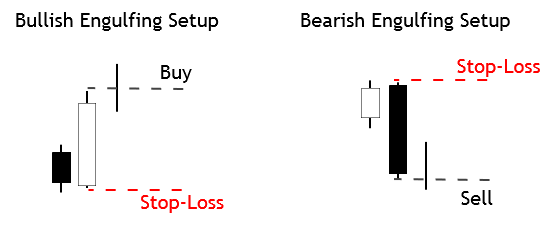
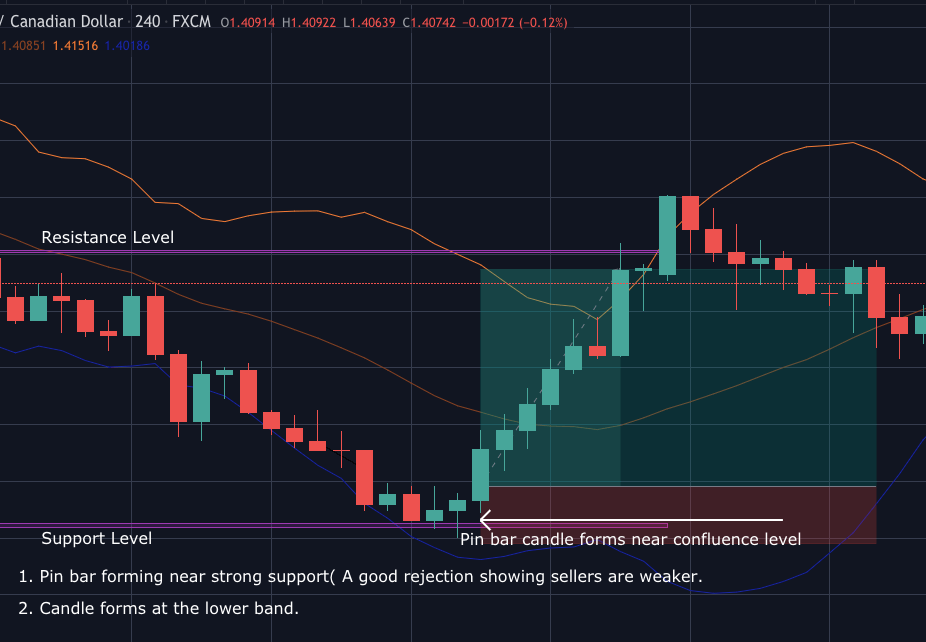
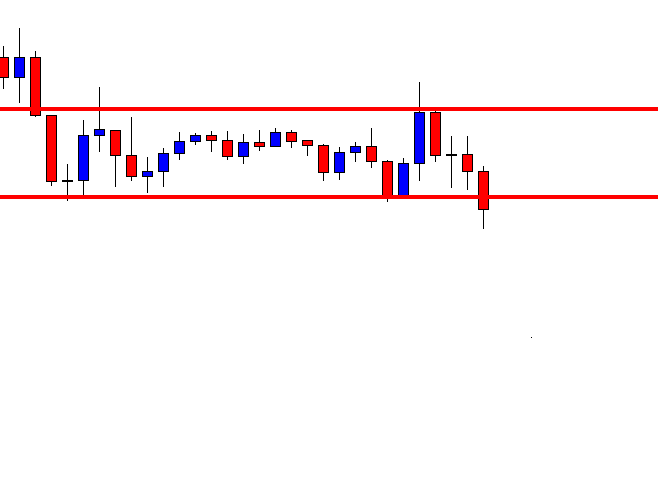
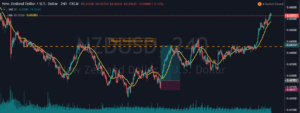
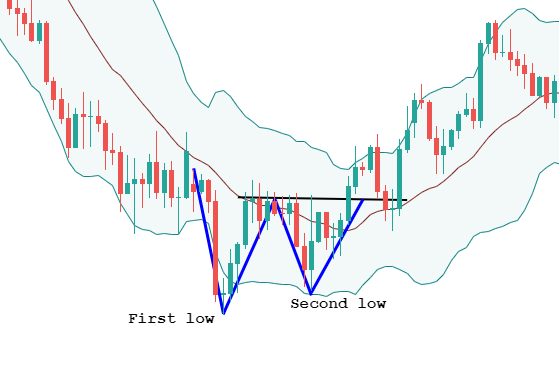
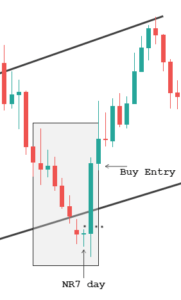
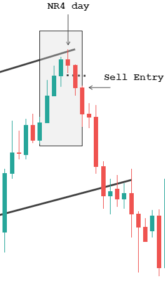
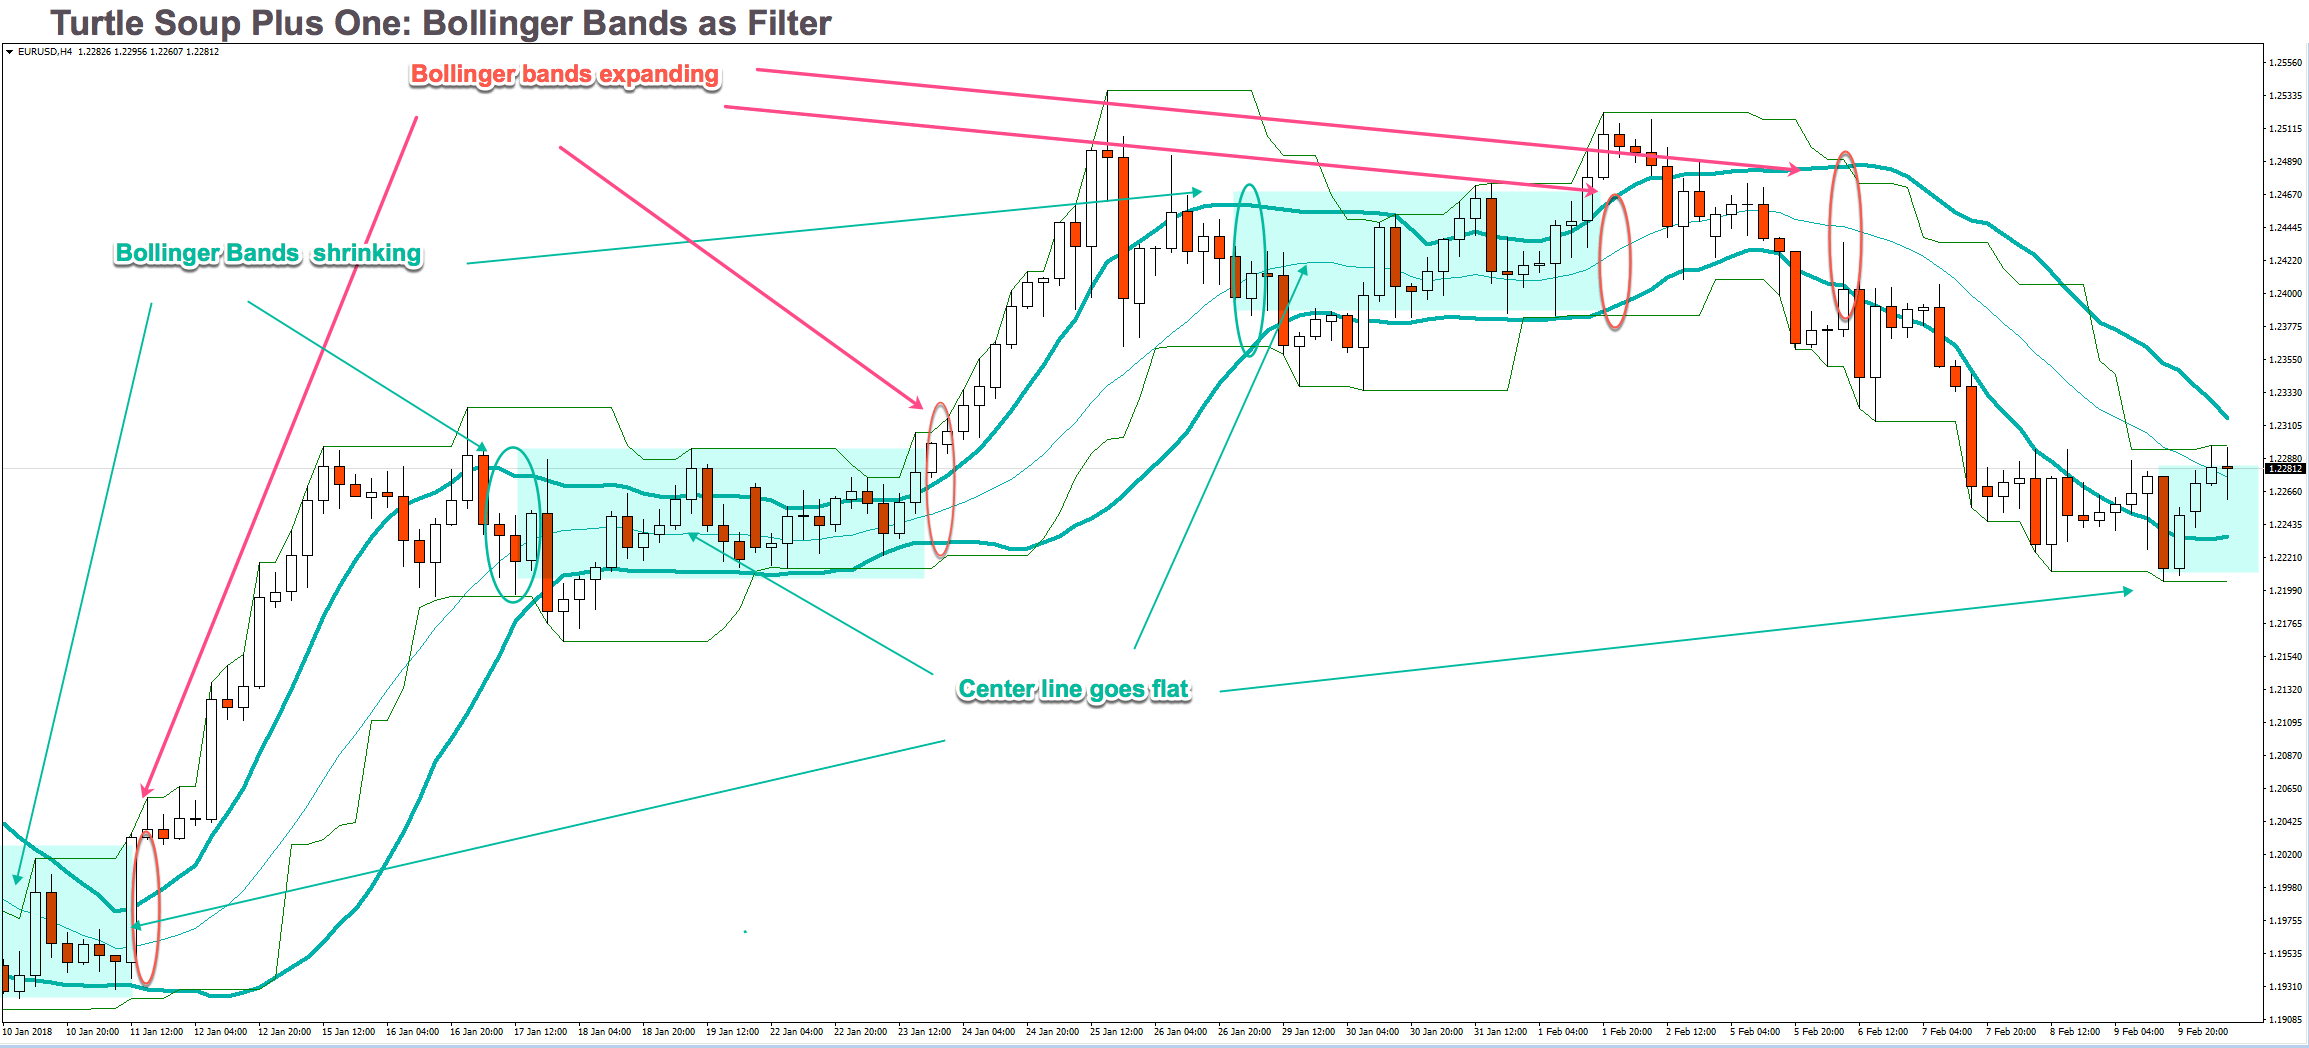
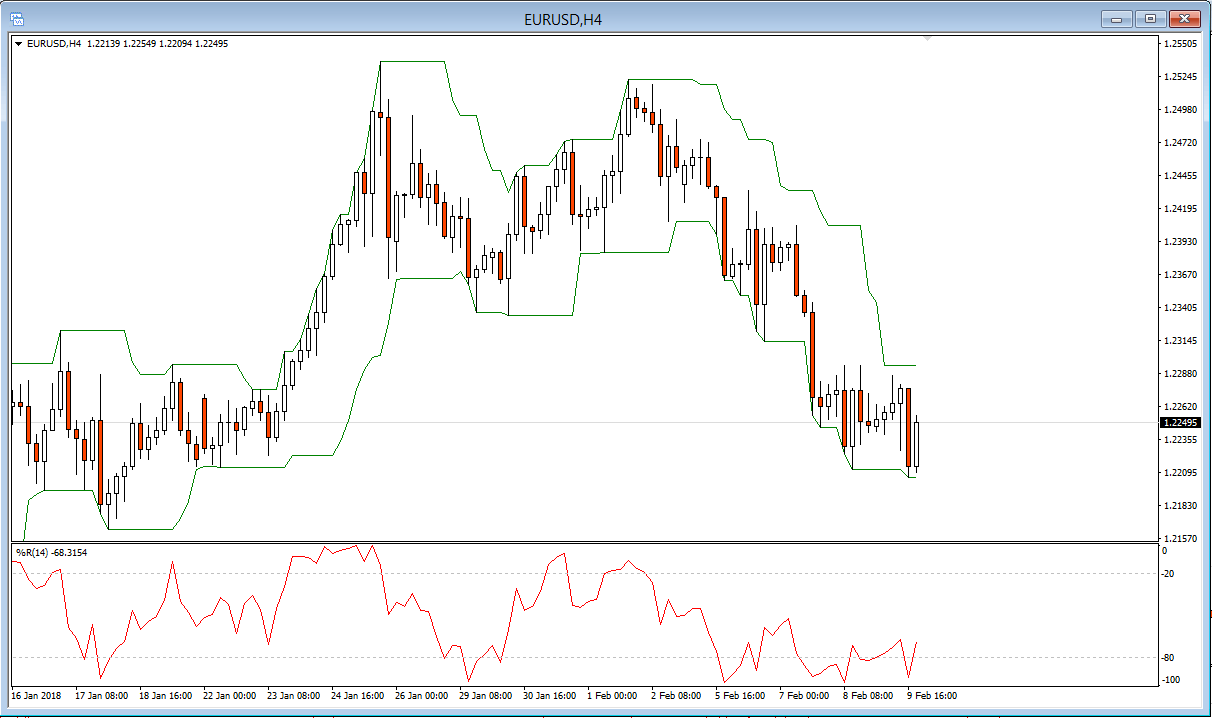
A sell signal happens at the candle following a close price breaking the channel’s current upper border. A buy signal occurs at the candle following a closing price below the line of the current lower edge of the channel. See figure below three consecutive winners on a flat channel signaled by a Bollinger band contraction.


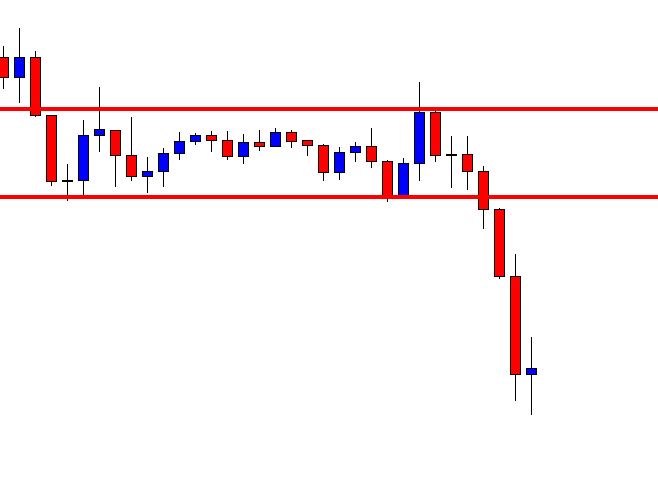
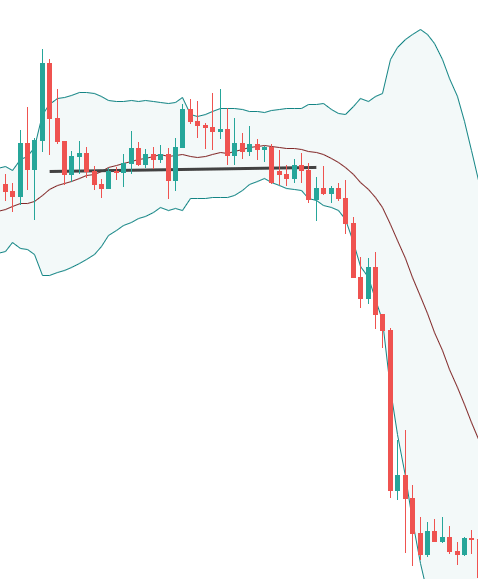
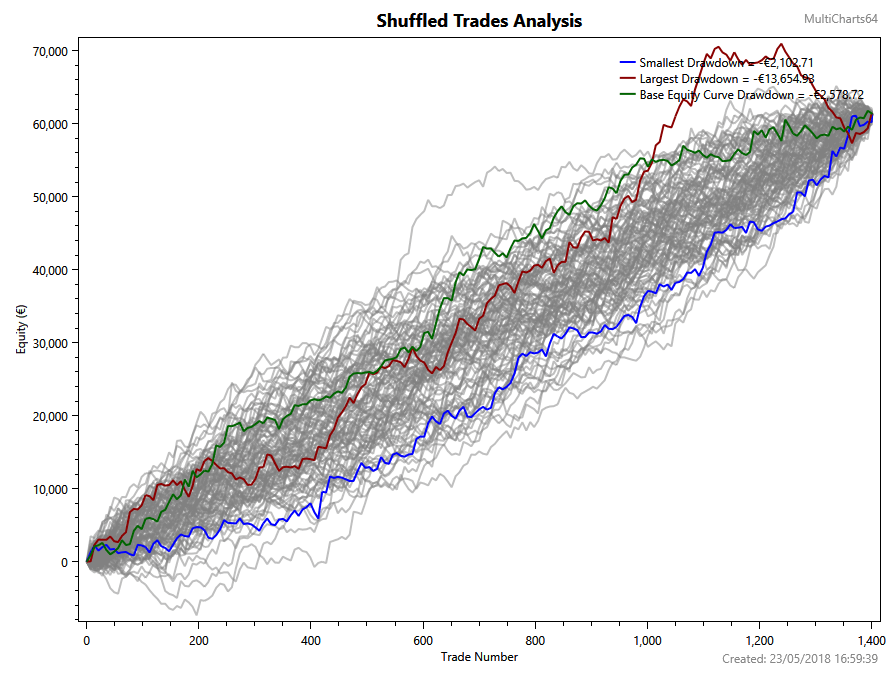
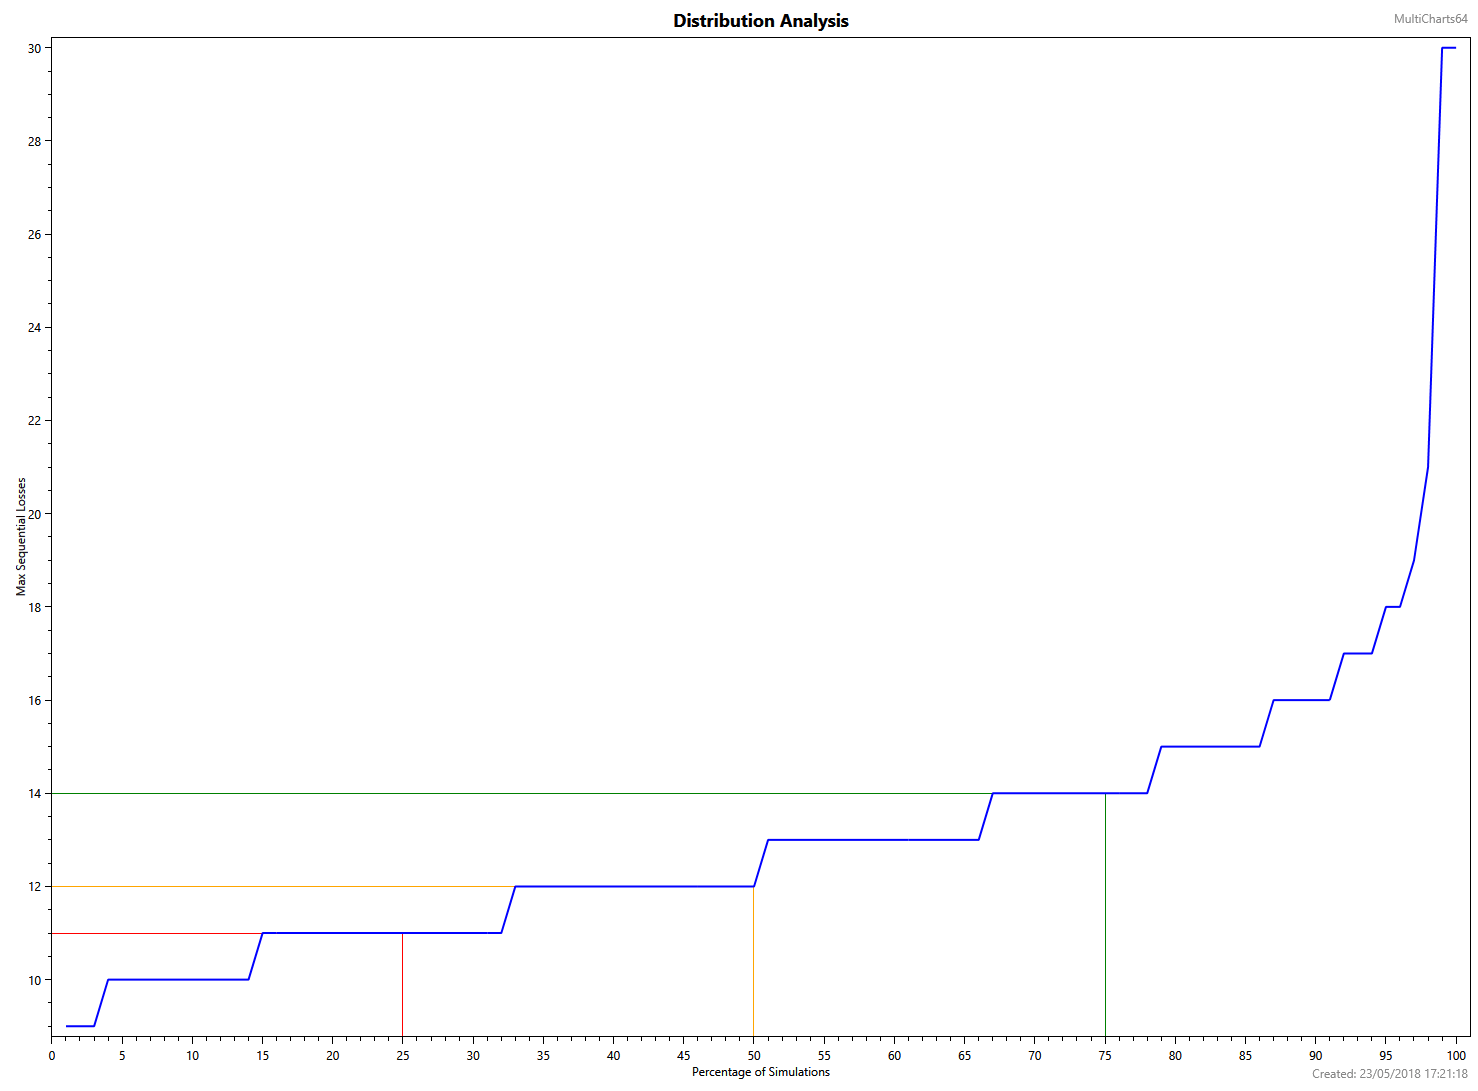
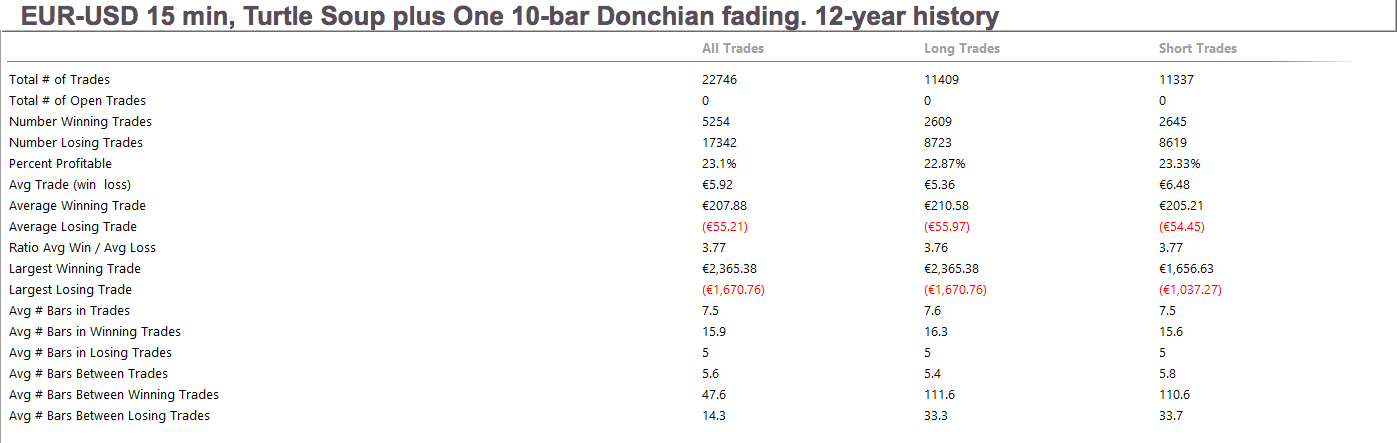
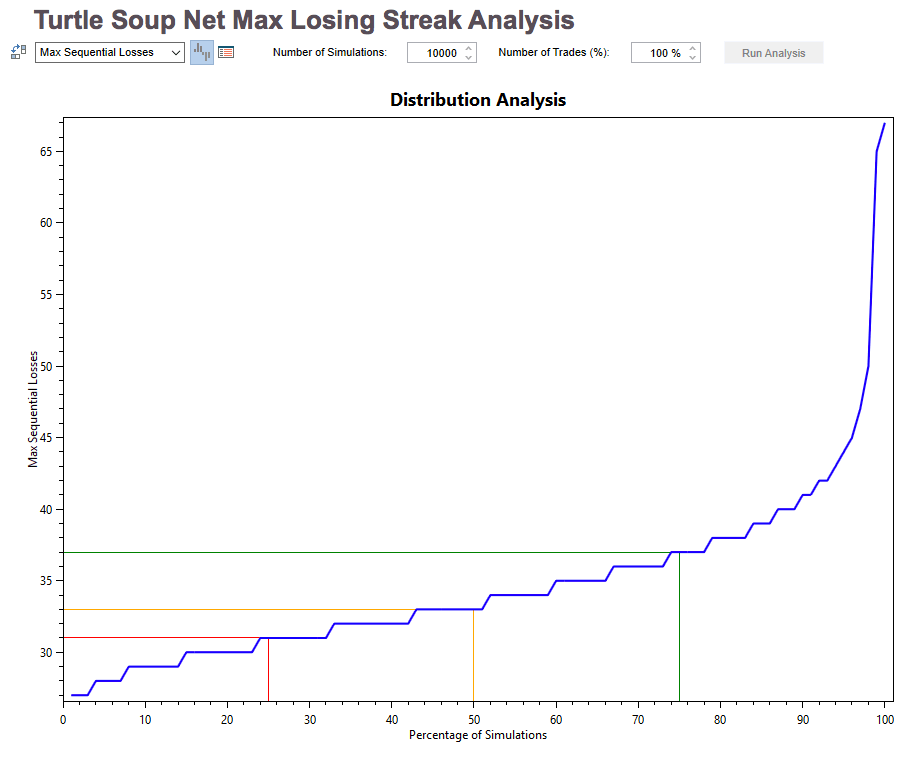
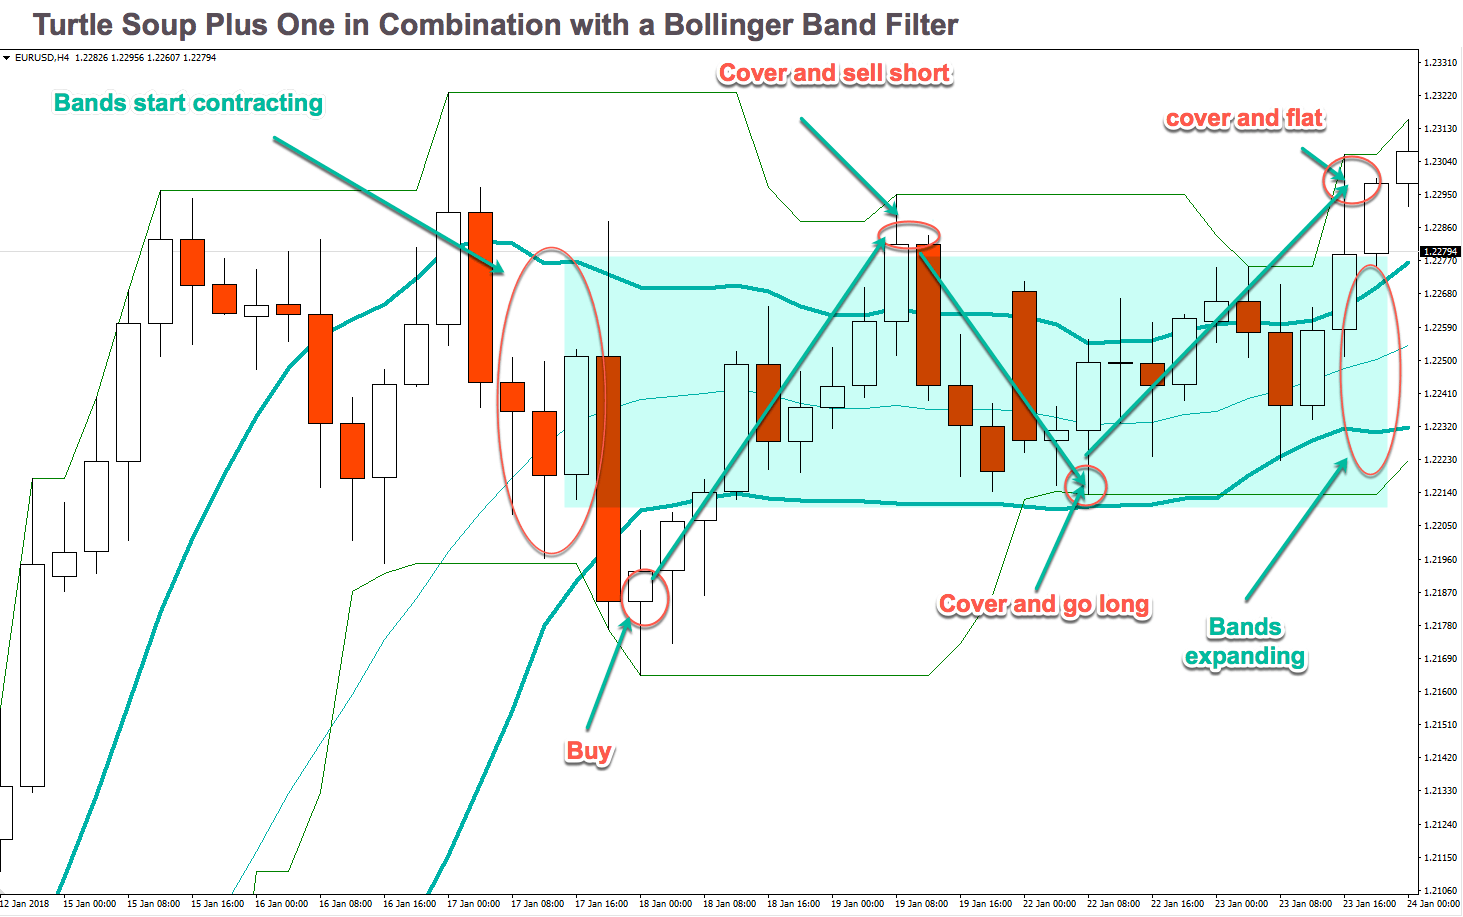
It’s not usual, but, from time to time, we can expect a streak of up to 10 losing trades. Thus, we have to apply adequate money management rules.

As an example, let’s say you don’t like to have a drawdown higher than 20% of your capital. Then, if you divide that figure by 10, that should be your maximum risk for a single trade. In this case, this is 2% of the current capital allotted to this strategy.

As a final note, the Turtle Soup and Turtle soup plus one are counter-trending systems profiting from false breakouts. Therefore, these systems work best in ranging markets. Bull or bear markets don’t fit well with its counter-trending nature. But they are a very good complement to trend following systems such as the Donchian channel breakout system or similar systems.

Categories
Forex Educational Library Forex Trading Strategies

Trading using Trader Vic’s Patterns


Victor Sperandeo, known as Trader Vic on Wall Street, is a legendary futures trader who has over 45 years of experience in the commodities markets. In this article, we will show two trading setups when the trend is changing and how to take advantage of the markets.

2B PATTERN

In a bull market, the 2B pattern requires that the price performs a new maximum, then a significant retracement and then that price tests again the previous maximum or attaining a higher one, that is better known as false breakdown (or false breakout). When this test fails, it is a sign that the price may be developing a failure in the uptrend, thus creating a potential reversal of the trend. Some traders call this pattern “Trap” (bear trap and bull trap). An idealisation of this pattern is in figure 1.

Figure 2 is an example of a 4-hour EUR-USD chart. The Euro shows an initial bearish movement to 1.1573; when it reaches this level, the price reacts making a retracement to 1.1689. After this retracement, the Euro makes a new low as a false breakdown. When it happens, the price makes a bullish move starting a new bullish trend.

The setup of this pattern is:

  1. Entry: Buy above (or sell below) the false breakout (or breakdown) candle.
  2. Stop Loss: Below (or above) the last swing (see figure 1).
  3. Profit Target: Previous swing high (or low).


1-2-3 PATTERN

This pattern is based on the concept that the trend changes when the price breaks the trendline described by the Dow Theory. In an uptrend, the price is making higher highs and higher lows, but then, the market breaks down the trendline. Afterwards, the price makes a test of the tops, but it does not reach a new maximum. Some traders call this pattern as “Failure”. Figure 3 shows an idealisation

As in the case of 2B Pattern, the 1-2-3 Pattern looks to identify a trend reversal or the end of the current trend. Let’s consider in figure 4, the BNKG 30-minute chart, which is following an upward trend. Once it reaches a new maximum, BKNG breaks down the uptrend line (1), then it performs a test that cannot overcome the previous maximum (2) followed by a price failure to reach a new maximum and a break down of the last support (3).

The setup of this pattern is:

  1. Entry: Buy above (or sell below) the swing of the breakout (or breakdown) of the trendline.
  2. Stop Loss: Below (or above) the last swing (see figure 3).
  3. Profit Target: Previous swing high (or low).


THE BACKTEST

In a personal study that considered the frequency of recurrence of the patterns: Trap, Failure, Climax (or turn in V) and Double (Double Top, Double Bottom), the results were the following:

As can be seen in Figure 6, the possibility of detecting the Trap patterns (or 2B pattern) is 42.7%, and Failure (or 1-2-3 Pattern) is 41.3%, adding up to 84% of the changes in the trend that occurred in the market. The ability to detect these two patterns can provide an advantage over the market. Figure 6 is a USOIL hourly chart, 2B. 1-2-3 movements are commonly found when we make the backtest to these patterns, even in minutes, as on the GOLD 15-minutes chart (figure 7).

SUGGESTED READINGS:

  • Sperandeo, V. (1994). Trader Vic II – Principles of Professional Speculation. New York: John Wiley & Sons, Inc.