Categories
Forex Basic Strategies

Using Bollinger Bands to Time the Rectangle Pattern

Trading the markets is an art, which is hard to master but very fruitful in the long run. There are various tools that traders can use to time the market such as Candlestick patterns, Indicators, Trading patterns, Price action tools, etc. Traders who decided to master these tools always end up generating huge money from the market. In this beginning, it is advisable to pick only one or two trading tools and use them in conjunction with others to master the markets. Here in this article, we choose the Bollinger Bands indicator with the Rectangle Pattern to successfully time the markets.

RECTANGLE PATTERN

The rectangle is a technical chart pattern that appears during an ongoing trend in an asset. This pattern is known as the continuation pattern used by the traders to anticipate the ongoing trend. The rectangle pattern is easily identifiable by two comparable highs and two comparable lows. Connect the highs and lows to form the two parallel lines that make up the bottom and top of the pattern. The qualify as a continuation pattern, the markets must be trending. Look for two equivalent highs and lows to have a pattern on the price chart. The pattern appears on all the trading timeframes, and ideally, the higher timeframes sometimes take nearly 3 to 4 months to form a pattern, and on the lower time frame the pattern prints very often. There are various ways to trade the pattern, some like to trade it after the breakout, and some like to trade it before the breakout, and for trading it before the breakout, we must use the Bollinger band to time it successfully.
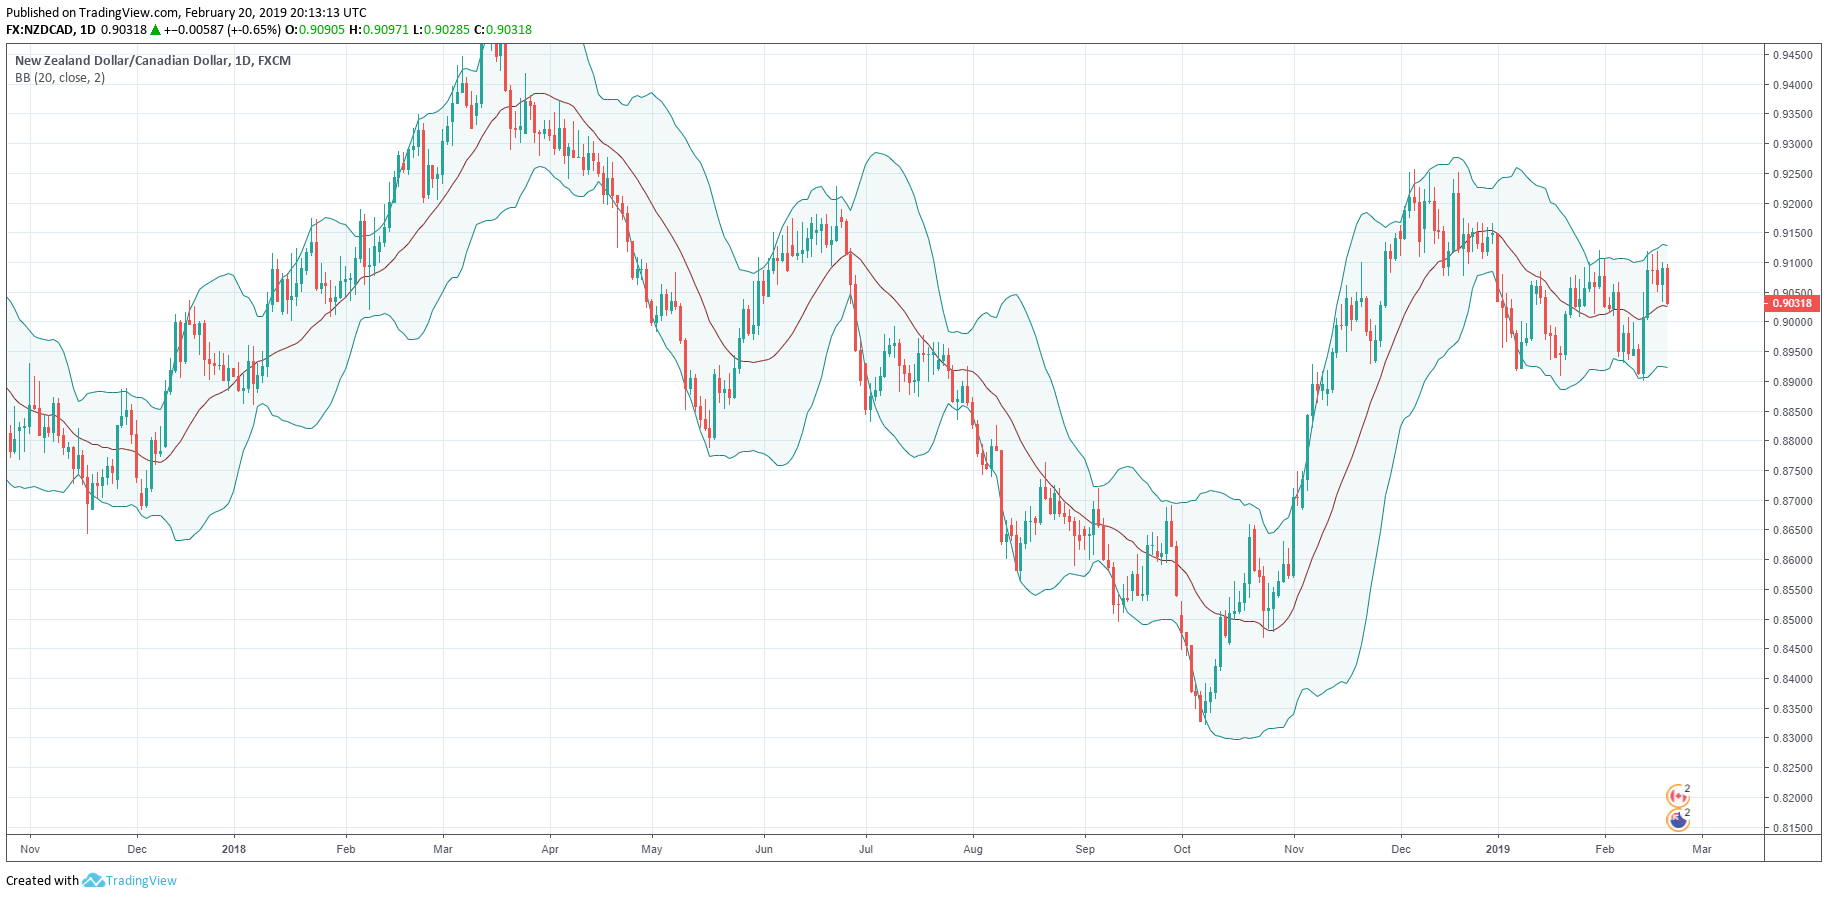
BOLLINGER BANDS

Bollinger Bands are a price envelope developed by John Bollinger. The indicator consists of 20 periods SMA and upper and lower band. When the bands tighten, it is an indication of low volume, and the wider pattern is a sign of high volume. Sometimes prices immediately go in the opposite direction and reverse before the proper trend begins, watch out for all of these fake moves before taking an entry. The price action touches the upper band, it’s a sign of selling trade, and when it touches the lower band, it is an indication to go long. When the prices continually touch the upper band, it means the markets are overbought, and when it keeps touches, the lower band is a sign of the oversold market conditions.

TRADING STRATEGIES

FOR BUYING

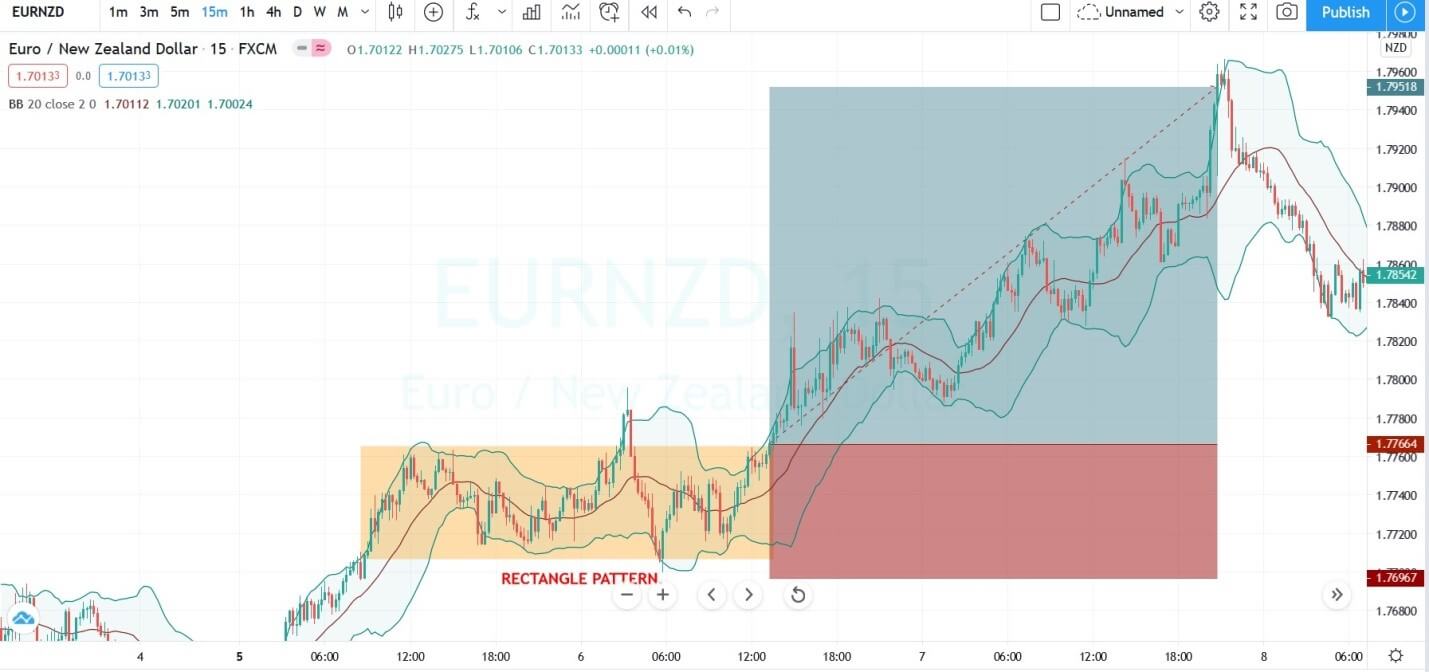
The image below represents the rectangle pattern in the EURNZD forex pair.

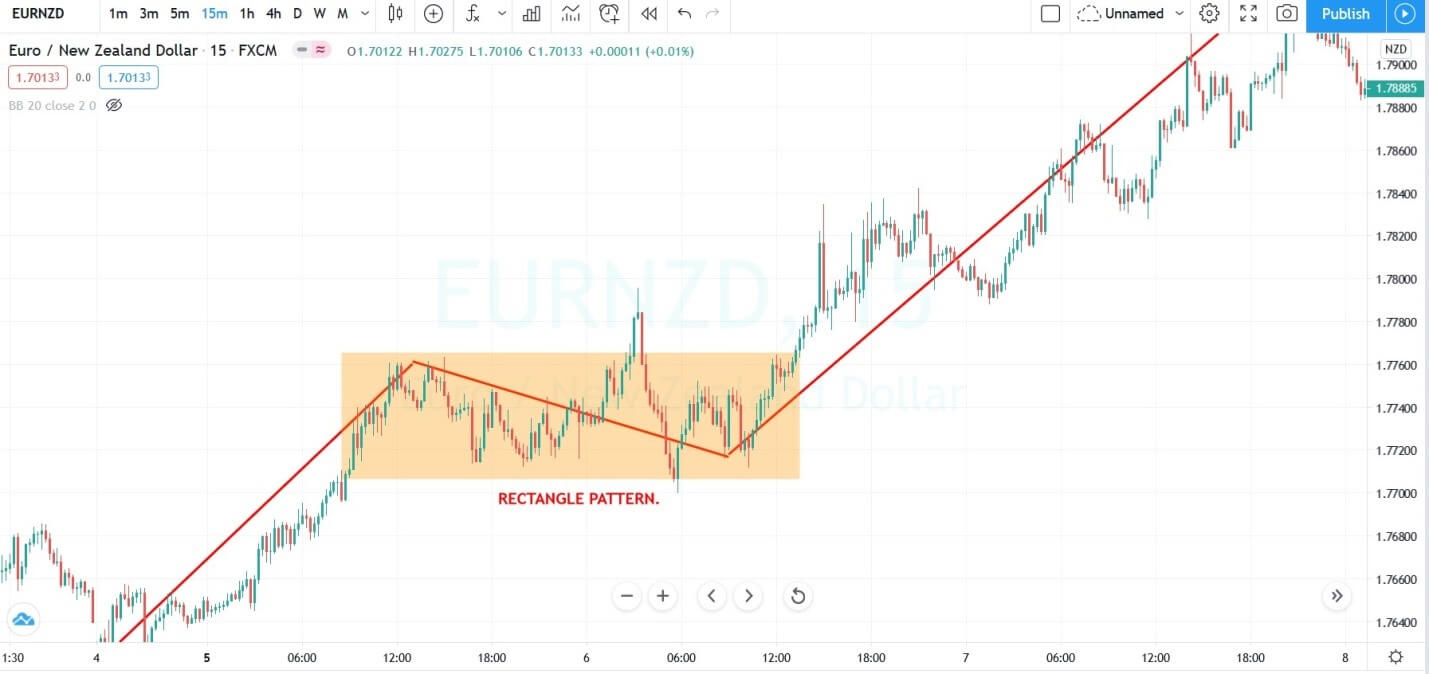
The image below represents the buying entry in the EURNZD pair. We witnessed the rectangle pattern in an uptrend, and after the pattern was a sign to go long. The price action touched the upper band; it was a clear sign that the buyers are gaining momentum, and soon we are going to witness the brand new higher high. On the other hand, Bollinger band traders were preparing to go short just because the prices approach the upper band. This is not a good approach, always uses the indicator in context with the trading pattern, and follows what the pattern is saying, and made decisions accordingly.

FOR SELLING

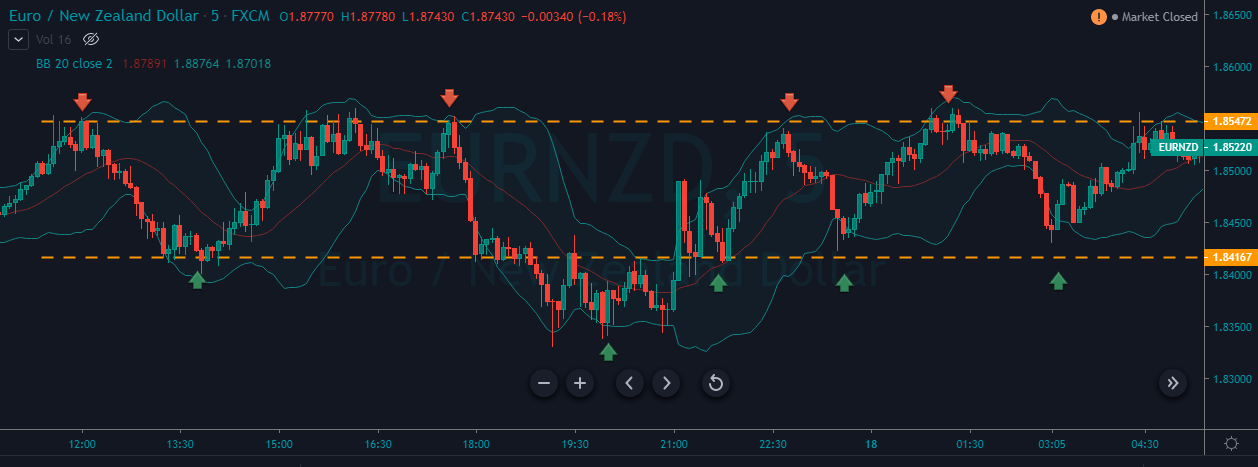
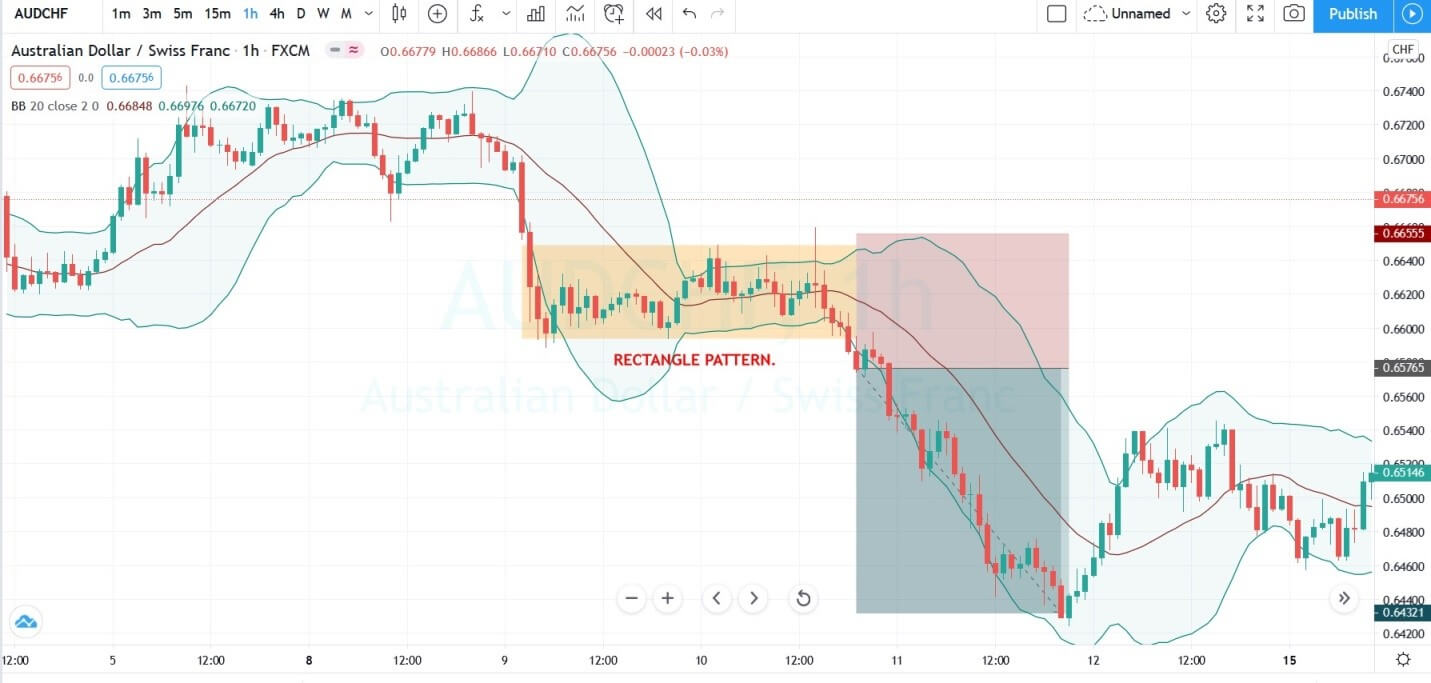
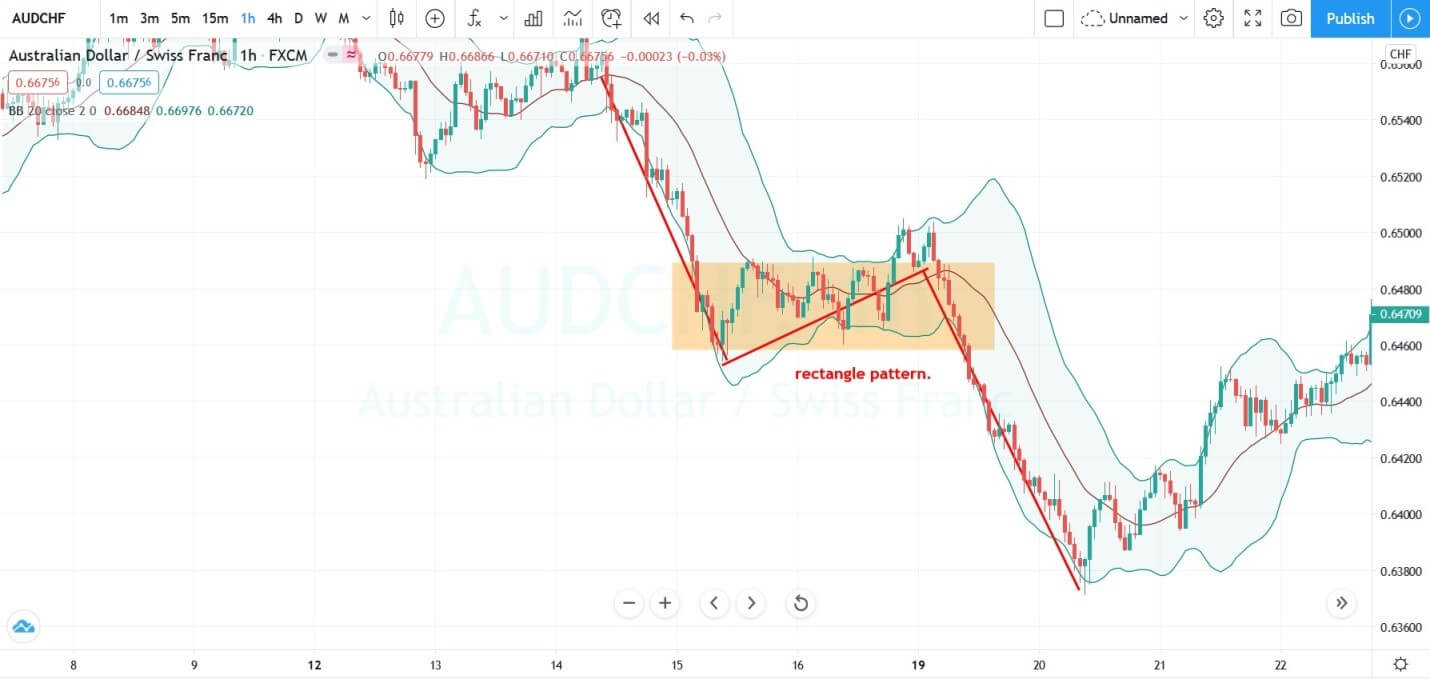
The image below represents the Rectangle pattern in the AUCHF forex pair.

The currency was in an overall downtrend, and during the pullback phase, the appearance of the rectangle pattern is a sign for us to look for the selling trade. After the breakout of the pattern when the price action touches the lower Bollinger band, we choose to go short. Some traders believe when the prices touch the lower band, it means to go long, and when the prices touch the upper band, it means go short. That’s not the right approach. In reality, if the prices keep touching the lower band, it means the downtrend is gaining momentum, and going short will be a good idea.

USING THE BOLLINGER BAND TO TRADE THE PATTERN BEFORE COMPLETION

The idea is to let the price for printing half of the rectangle pattern first, and when the prices touch the lower band and go above the center line, it is a sign to go long. The center line breakout is an indication of the buyers gaining momentum, and soon we can expect the breakout of the pattern.

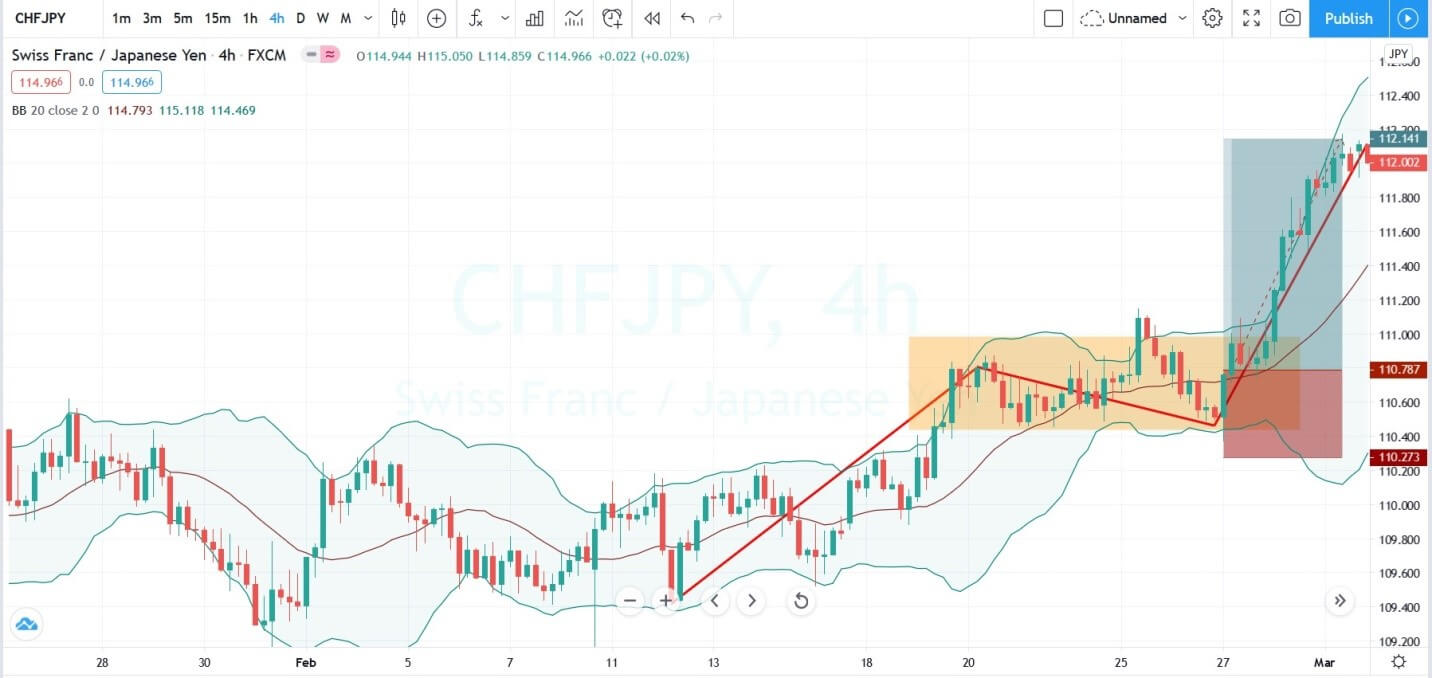
The image below represents the buying trade in the CHFJPY forex pair.

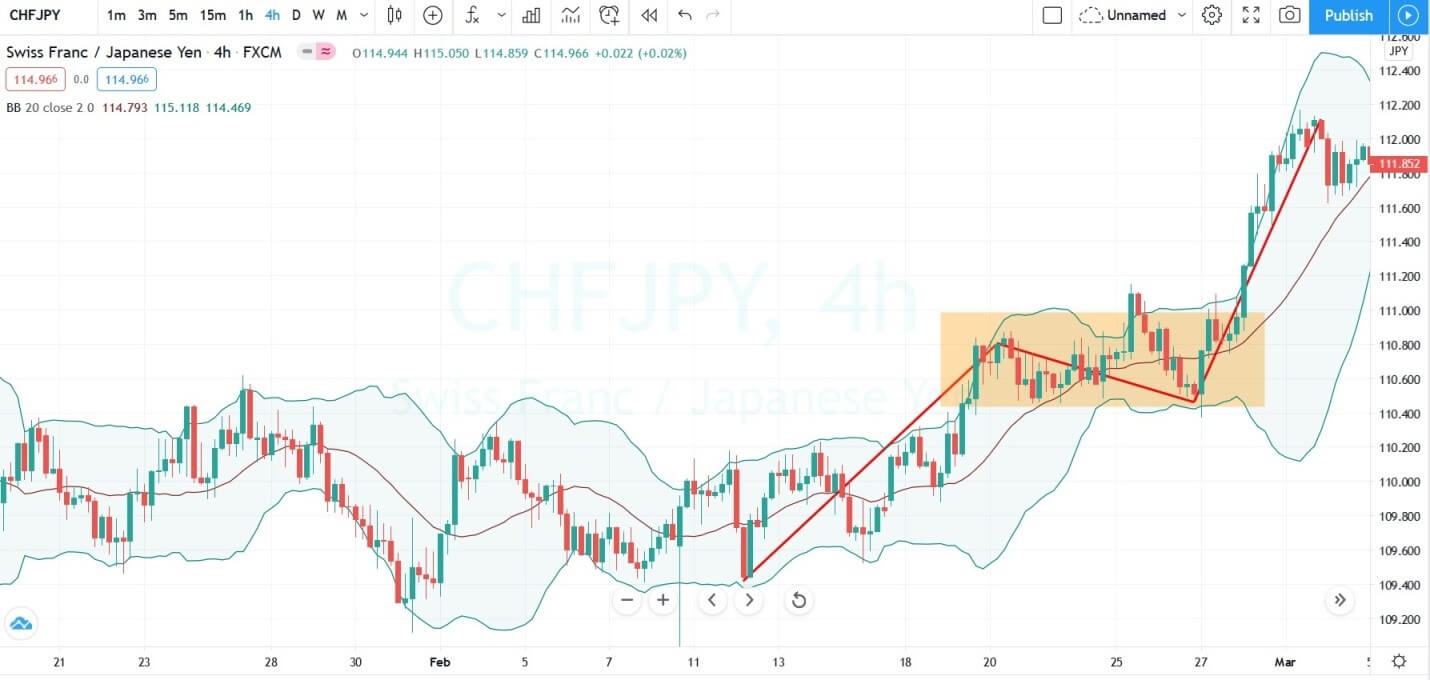
As you can see in the image below when half of the pattern was completed, and the prices go above the center line aggressively, we choose to go short with the stops below the pattern. The stronger buyers break the pattern, and it prints the brand new higher high. In this way we can easily time our trades well and often we got a better risk to reward ratio trades.

LOOKING FOR THE FAKEOUTS TO TRADE THE RECTANGLE PATTERN

Sometimes the price action prints the fake-out first before moving to the original direction. These fake-outs are the signs that the original trend is trying to trap more and more of the opposite party to move in the original direction. When you identify any fake-out where the prices go above the pattern and immediately came back, it is a sign for us to anticipate in the market.

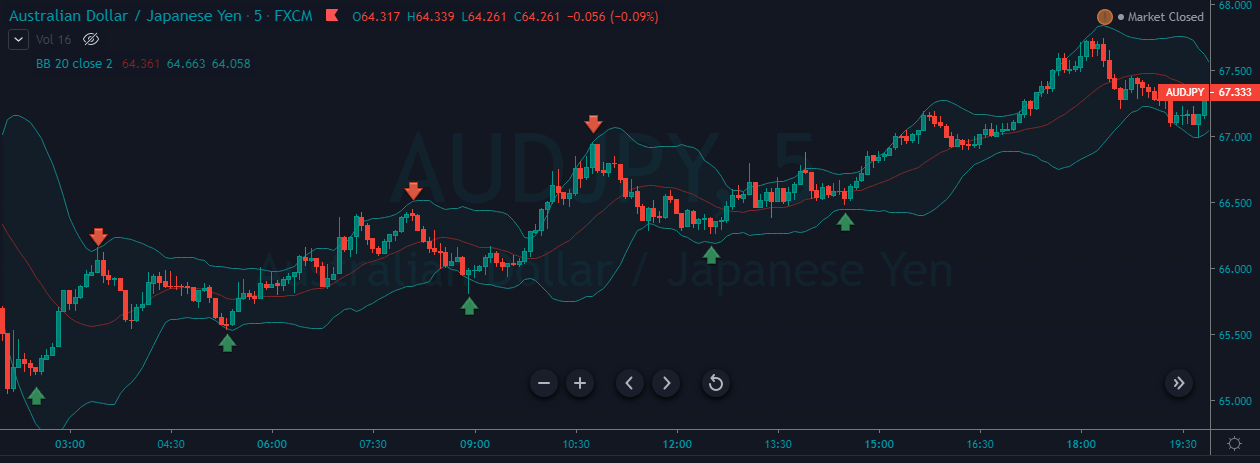
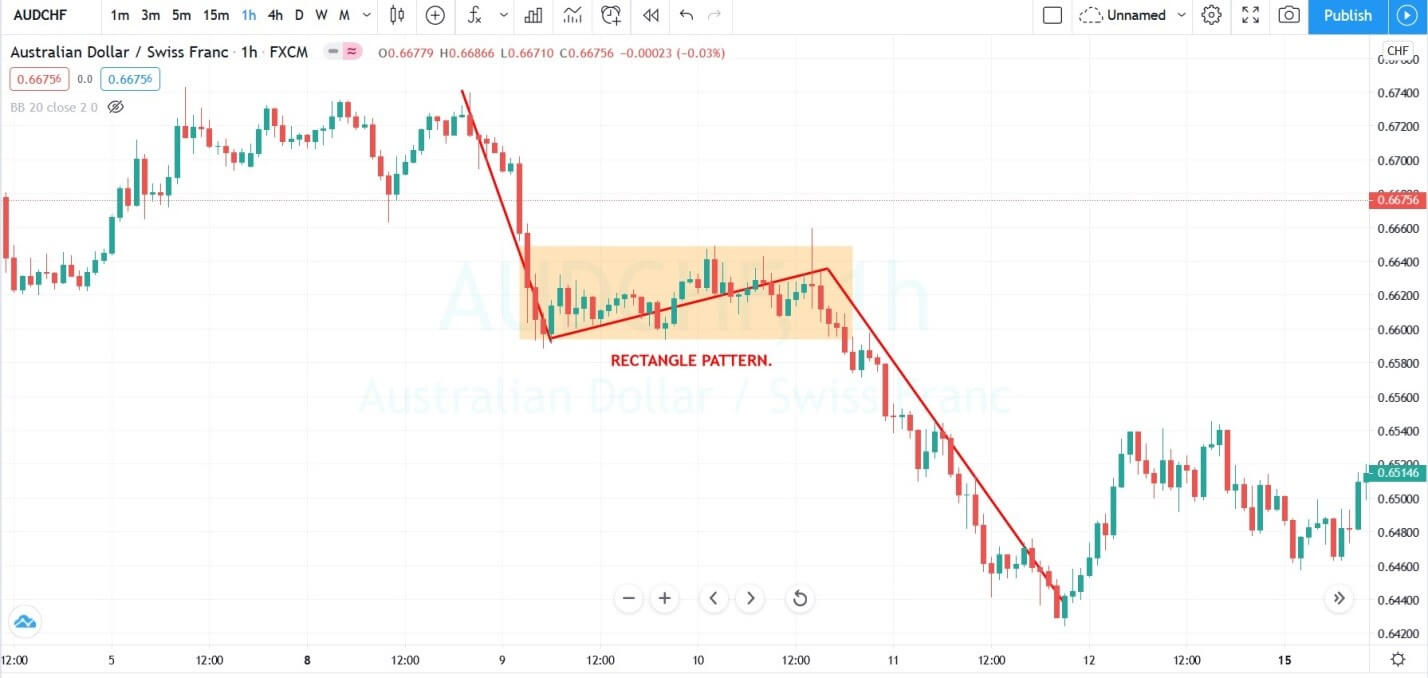
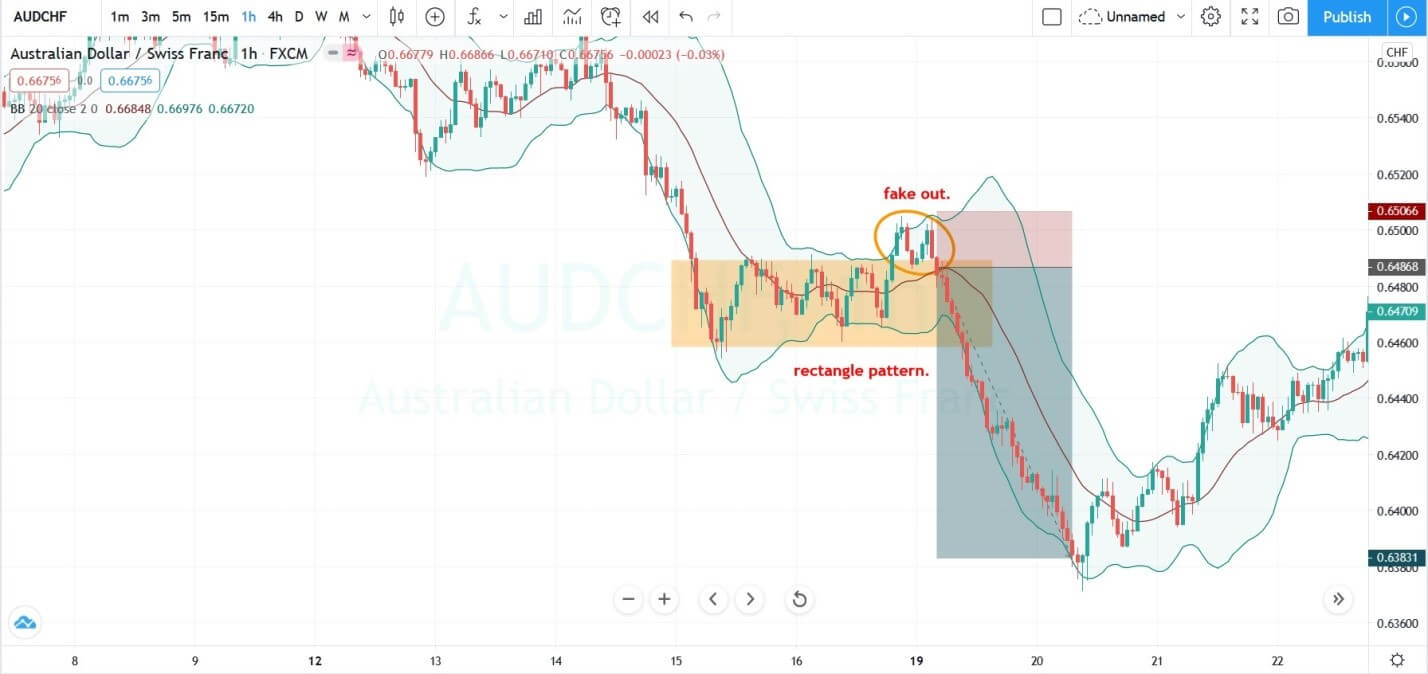
The image below represents the rectangle pattern in the ADUCHF forex pair.


In the image below, when the price forming the rectangle pattern, the buyers just went out and touched the upper band of the Bollinger. By acting as a support area, the upper band immediately pushed the prices back into the rectangle pattern. The failure of the buyers to break above the pattern is a sign to go short. We use the smaller stop loss above the Bollinger because the rectangle upper line and upper Bollinger band line was a strong level to hold the prices.

CONCLUSION

Bollinger and rectangle both are different trading tools that help the trader to identify the different market conditions and trading opportunities. One can use these two tools alone, or we can pair them with one another. If the traders use the rectangle pattern alone to trade the markets, it will give you good trades, but pairing it with the Bollinger band will give you the extra edge to time the market even before the pattern formation. Most often you will find this pattern only in the trending market conditions, and it is advisable to go big when both of these tools to lining up in one direction.

Categories
Forex Basic Strategies

The Most Reliable 5-Minute Forex Scalping Strategy

Introduction

Scalping is a type of trading that involves placing many trades in a single day to profit from minor price changes in the Forex market. Traders who use this strategy are known as scalpers. It is crucial to have a robust exit strategy for scalpers to earn large gains from small market moves.

Scalping strategies are mostly applied to the intraday markets, and the trade holding duration can vary from a few seconds to minutes. For novice Forex traders, this type of trading is not recommended as scalping involves a fast-paced activity that requires precision in timing and execution.

We must always use a smaller timeframe such as a 5-min or 1-min for scalping the Forex market. We can use various reliable indicators for scalping, but in this article, we’ll learn how to scalp the 5-minute timeframe using Bollinger Bands.

Why Bollinger Bands?

Bollinger Bands is a technical analysis tool that was developed by John Bollinger. This indicator is composed of three lines as follows – A Simple Moving Average, which is the Middle band, the Upper Band & the Lower Band. The usage of Bollinger Bands indicator goes like this – the closer the price action moves to the upper band, the more overbought the market. Likewise, the closer the price moves to the lower band, the more oversold the market. The bands in this indicator widen and contract based on the market volatility. They expand when the market activity is increased and contract in choppy or less volatile markets. Let’s use this indicator in the 5-min timeframe to identify potential trading opportunities.

Scalp Trading With Bollinger Bands

We must go long when the price hits the lower band and look out for short-selling opportunities when prices hit the upper band. This is the traditional way of trading the market using Bollinger bands which is still being used by scalp traders across the world. The reason why this strategy is famous is because of its ease of usage and its ability to milk quick buck from the market.

Scalping Ranges – Example 1

In the below price chart, you can see that we have taken five buying and four selling trades in the EUR/NZD Forex pair. In this example, we have applied this strategy in a ranging market. When the price approached the support line, and when it also hit the upper Bollinger band, it is an indication for us to go long. Similarly, when the price goes near the resistance line in a range, it is an indication for us to close our long positions and look for selling opportunities.

By doing this, we have been continuously engaged in the market and made some consistent profits overall.

Example 2

Below is another example of scalp trading the Forex market when it is in the consolidation phase. Typically in a range, both the parties have equal strength. Also, it is a known fact that it is comparatively hard to trade the consolidation markets than the ranging markets. However, using this strategy, we have managed to take five buying and three selling trades in the GBPJPY Forex pair.

Scalpers typically go long or short when the price approaches the upper or lower range lines. This is the right approach, but by pairing that strategy with an indicator like Bollinger band can drastically increase the probability of those trades. The USP of the Bollinger band indicator is that it works well in all the types of market situations. It really doesn’t matter whether you scalp the ranges, channels, or even trends; this strategy will always provide reliable trading opportunities.

Example 3

In the below price chart, the price was dragging towards the upside, indicating a buying momentum, but it ended up forming a channel. In a channel, both parties hold equal power and us being scalpers; it is easy to make money from both sides. Below we can notice that if we go either long or short, we can make an equal amount of money if we are right. This is the major benefit of using Bollinger bands in channel conditions.

Scalping Trends – Example 1

Below is the price chart of the AUD/JPY currency pair in an uptrend. As you can see, during the pullback phase, the market gave us the first buy trade. When the price action approached the upper Bollinger band, the price immediately moved in the opposite direction. As a scalper, prepare your mind for these kinds of quick moves. Follow the rules of the strategy to the point, and if any trade goes three to four pips against you, immediately exit and wait for the next opportunity.

Our third buy trade also performed, but it didn’t go for bigger targets. Instead, the price action immediately reversed, which end up generating a sell signal. The next buy trade was also ended u with minor profits. For scalpers, even a profit of 8 to 10 pips can be considered good in a single trade.

Example 2

Below is an example of buying and selling trades in an uptrend in the AUD/JPY pair. We are saying this pair is an uptrend after analyzing its higher time frame. In the lower timeframe, the market may seem to be ranging, but since we know that this pair is up-trending overall, we must consider buying opportunities over sell signals.

The markets gave us five buying and three selling trades in this pair. Even though we have identifies many sell signals, we recommend not to enter those unless you have confirmation. Always remember that trend is your friend and trade according to the trend. This is the essence of scalp trading the trending markets. Therefore, when scalping trends, always go for bigger targets by following the trend. Also, expect less accuracy on counter-trend trades.

Conclusion

It requires a lot of practice to master scalping. Since the time frame is small, you must be quick in everything you do while scalping. Also, talking additional confirmations is not possible in this form of trading because of its swift nature. Please practice these strategies on a demo account before you apply them on the live markets. All the best. Cheers!