Categories
Forex Basic Strategies

Trading The ‘Trend Bouncer Strategy’ Using Appropriate Risk Management Techniques

Introduction

The activation of a trend can be from a political decision or an improvement in the GDP of the economy. Some other reasons include the central bank policy announcement and the discovery of new resources. Trends move like waves causing long to short term price movement in both the directions of the market.

In an uptrend, we observe that, at a certain point in time, price pullback, or retrace before continuing with the upward movement. Similarly, in a downtrend, prices retrace upward against the downward movement before continuing their way down again. This ebb-and-flow movement can be frustrating for many new traders because they are not familiar with such market moves and often get stopped out before the market starts to move in their direction later.

Experienced trend traders usually wait for a retracement before taking a trade in the direction of the major trend. This is how the trend bouncer strategy was introduced. The Bollinger band indicator provides an effective way of identifying the up and down movement of a trend.

Since this is a trend trading strategy, we will have more than one profit target. We have two specific profit levels for this strategy.

Time Frame

The trend bouncer strategy works well with the 1-hour and 4-hour time frame chart. This means each candle on the chart represents 1 hour and 4 hours of price movement, respectively.

Indicators

We will use two Bollinger bands with the following settings.

  1. Moving average 12, deviation 2
  2. Moving average 12, deviation 4

One should have a clear understanding of the Bollinger band indicator before using it for this strategy. Refer to our articles on Bollinger bands for an explanation of the indicator.

Currency Pairs

The strategy is suitable for trading in all currency pairs listed on the broker’s platform, including major, minor, and few exotic pairs. However, it is better to trade in highly liquid currency pairs.

Strategy Concept

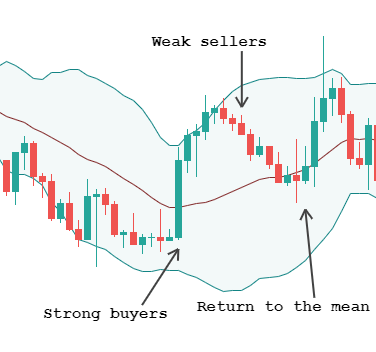
With the Bollinger band indicator’s help, we can objectively identify the ebb-and-flow movement of a trend. When the price hits the upper band of the first Bollinger band (MA 12, Dev 2), it indicates an upward movement. In this scenario, we prepare to go long in the currency pair. As prices retrace back to the centerline of the Bollinger band (MA 12), a significant retracement has occurred, and it is time to enter for a ‘long.’

Similarly, when prices hit the lower band of the Bollinger Band (MA 12, Dev 2), it indicates a momentum to the downside, and we prepare to go ‘short’ in the currency pair. As prices retrace back to the centerline of the Bollinger band (MA 12), and it is time to enter for a ‘short.’ We will exit our ‘trade’ in two places, which we explain in the coming section of the article.

Trade Setup

In order to illustrate the strategy, we have taken the example of the USD/JPY currency pair on the 4-hour time frame, where we will find a ‘long’ opportunity in the market using the strategy. Here are the steps of the trend bouncer strategy in forex.

Step 1

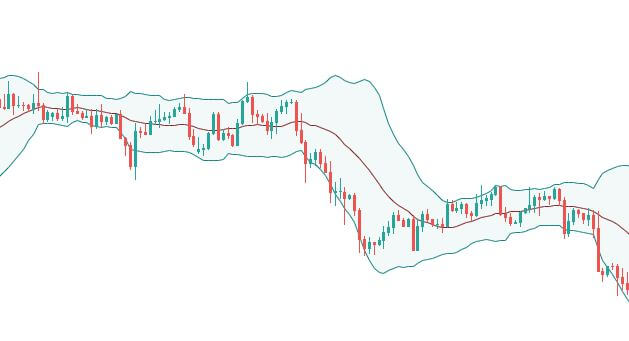
Firstly, open the chart of a currency pair and plot two Bollinger bands. The moving average of the first Bollinger band is 12, with a standard deviation of 2. Moving average of the second Bollinger band is also 12 but should have a standard deviation of 4. Since it is a trend trading strategy, it is best to use the strategy on the pullback of a new trend. However, it can also be used on a reversal, but the reversal should be confirmed before applying the strategy.

In this example, we see that the market has shown signs of reversal, which could extend on the upside.

Step 2

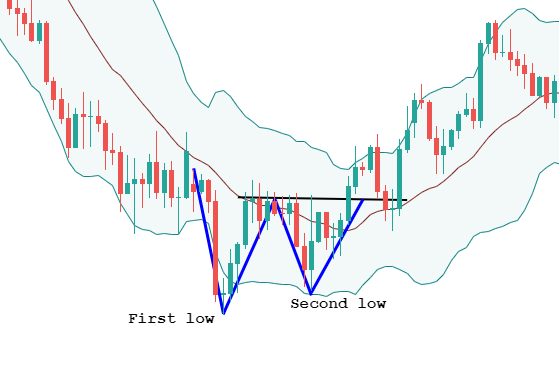
The next step is to wait for the price to hit the upper band of the first Bollinger band, in case of an uptrend. Similarly, the price should hit the lower band when trading the pullback of a downtrend. This gives us the confirmation that a trend has been established. Now, we need to wait for a retracement of this move before we can enter the trend.

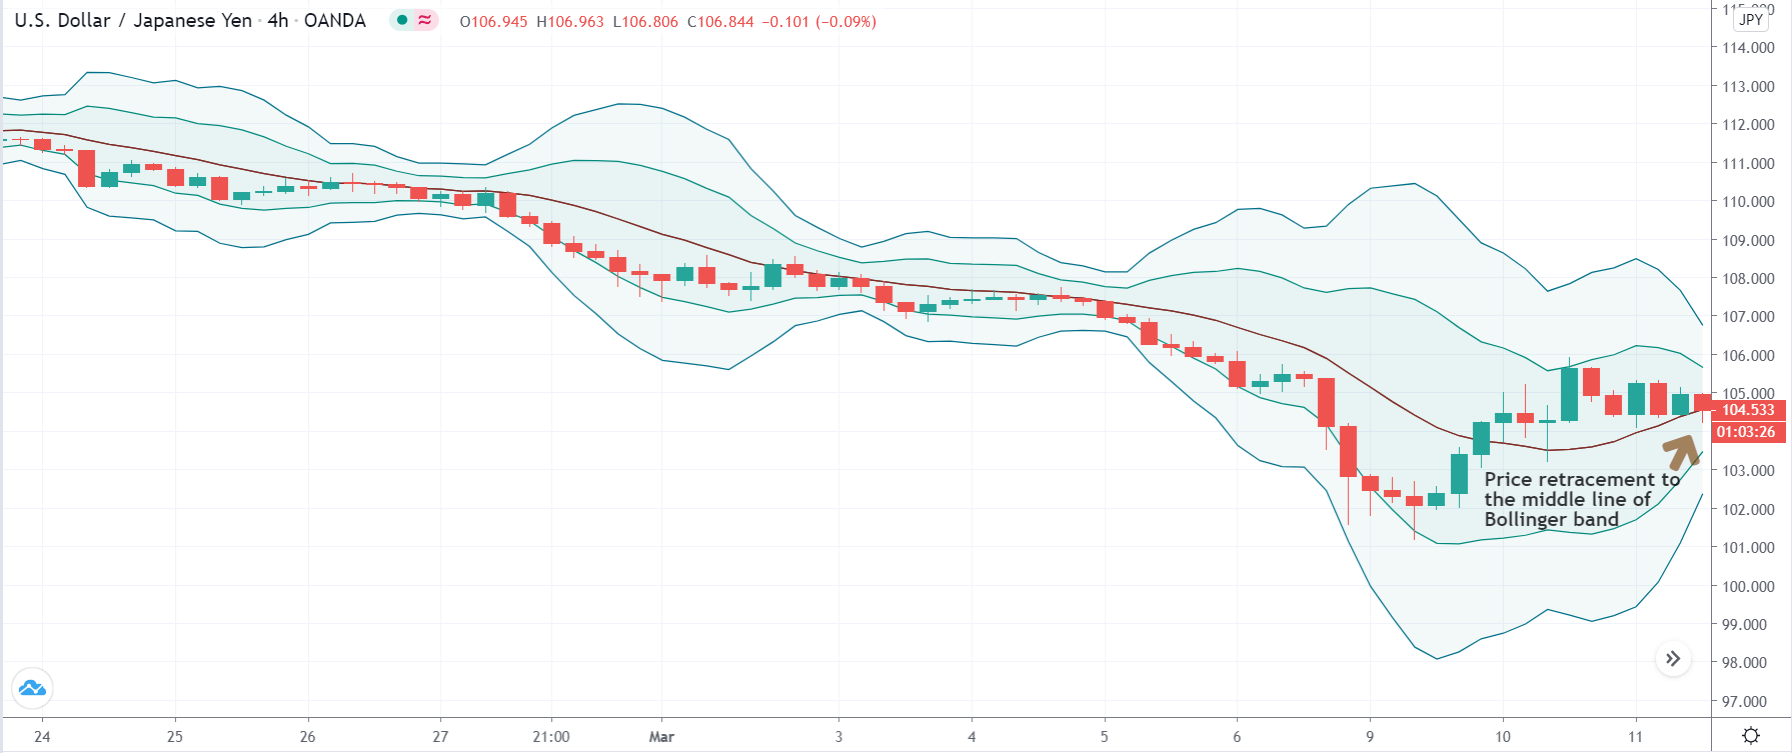
In the below image, we can see that the price exactly touches the upper band of the first Bollinger band (MA 12, Dev 2), and now we will wait for a pullback to join the trend.

Step 3

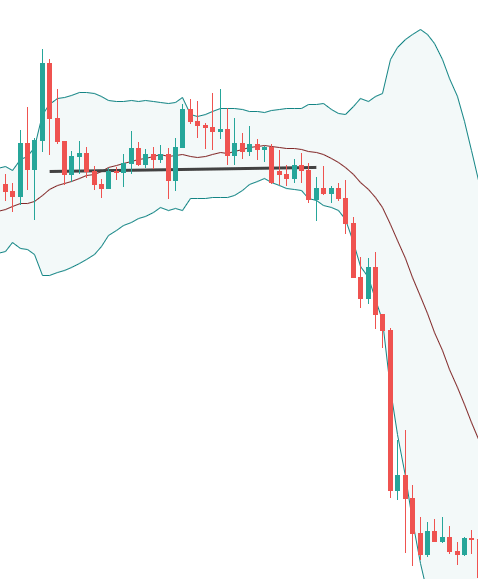
The next step is to wait for the retracement to touch the Bollinger band’s centerline. The intersection of the price and the centerline is the entry signal for the strategy. An important point to make a note here is that the pullback shouldn’t come in a single candle. This means the pullback should come in multiple candles. The longer it takes, the weaker the pullback. In such cases, the is a higher chance that the trend will continue.

In our example, we are entering for a ‘long’ as soon as the price touches the Bollinger band’s centerline. We also see that the pullback has come in 6 candles, which is desired.  
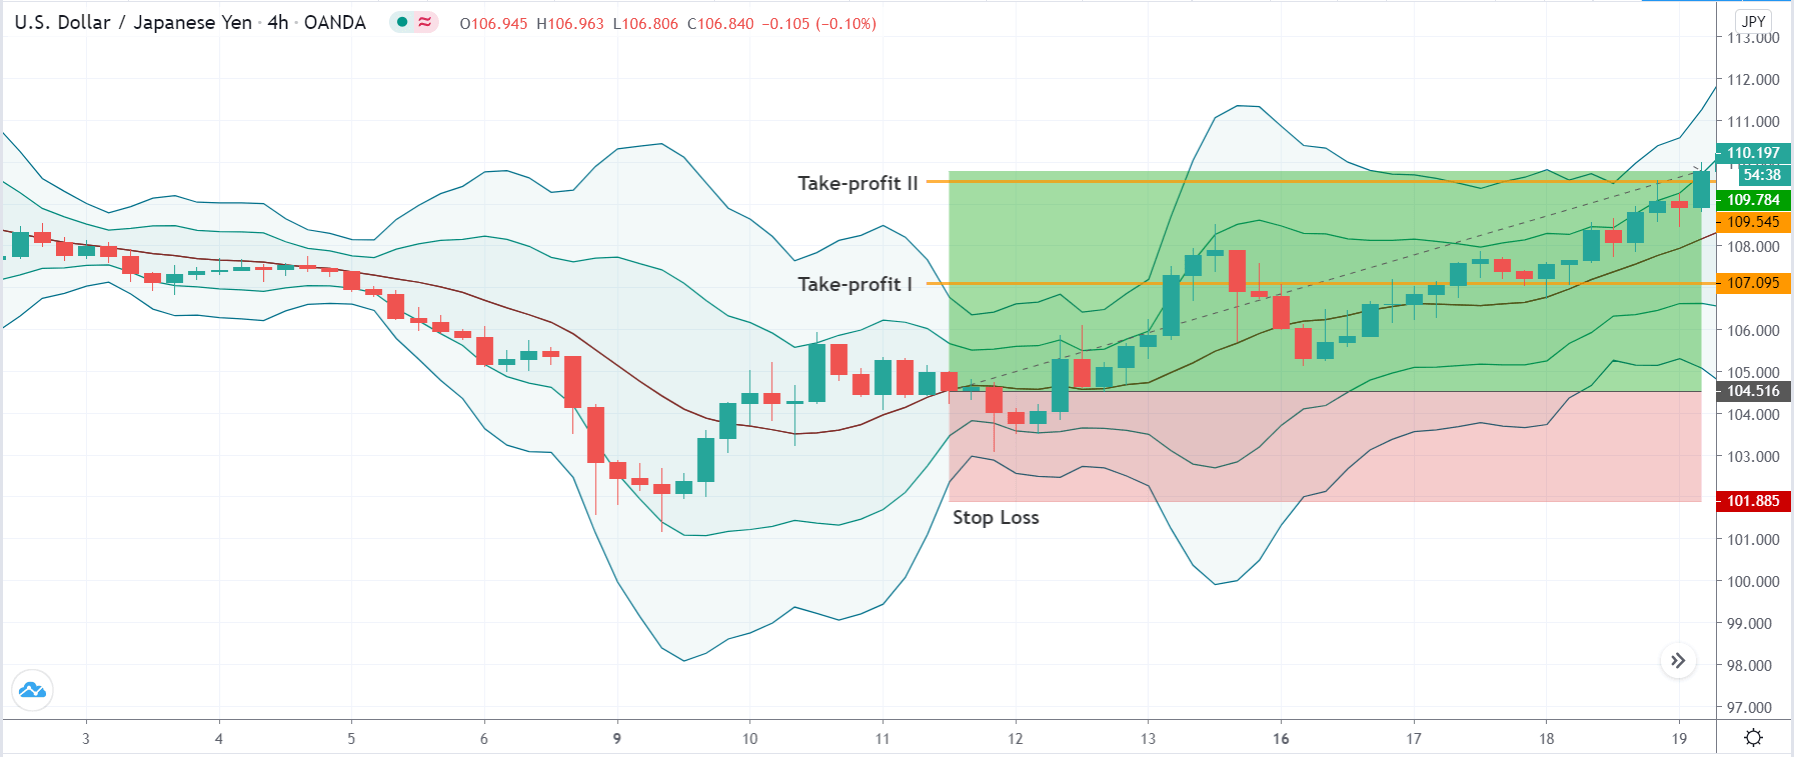
Step 4

As mentioned earlier, the strategy has two ‘take-profit‘ points. The ‘take-profit’ points are set based on the risk to reward ratio. The first one is at 1:1 RR, and the second one is at 1:2. The reason for the two ‘take-profit’ points is that since we are trading with the trend, the market has the potential to make new ‘highs’ and ‘lows.’

Strategy Roundup

Understanding the trending nature of the market helps us to identify the direction and timing of our entries. The best part of this strategy is that we bank profits in various stages. With a momentum indicator like the Bollinger band, we greatly increase the odds of being profitable in the long run.

Categories
Forex Basic Strategies

You Must Definitely Try These Most Promising Bollinger Bands Strategies

Understanding Bollinger Bands

Bollinger Bands is one of the most famous indicators out there, developed by a technical analyst named John Bollinger in the 1980s. This indicator primarily identifies the volatility level of a currency pair. Bollinger bands are volatility bands placed below and above a moving average. These bands are designed such that they automatically widen when the market volatility increases and narrow or contract when volatility drops.

One of the important purposes of the Bollinger bands is to determine the relative high and low prices of the market. As simple as it gets, the prices are comprehended to be low at the lower band and high at the higher band. With this definition, we can come up with trading patterns that can help predict the upcoming market trend.

Calculation

Bollinger bands have three bands, namely, the upper band, the middle(mean) band, the lower band. And they are calculated as follows:

Upper Band = Middle band + 20-day Standard deviation x 2

Middle Band = 20-period the moving average (20 SMA)

Lower Band = Middle band – 20-day Standard deviation x 2

Below is a chart that has the Bollinger Bands embedded in it.

Setting up the Bollinger band

Every trading platform will ask you for the length of the Bollinger band. By default, the value is set to 20. And it is highly recommended to keep the default configurations to obtain optimal results from the indicator.

Now, let’s put all of the above information into action by analyzing some great strategies.

Strategy 1: Double Bottom Setup

One of the most popular trading strategies using the Bollinger bands is the double bottom setup. This is because John Bollinger himself said that, “Bollinger bands can be used in pattern recognition to define pure price patterns such as “W” bottoms, “M” tops, momentum, shifts, etc.”.

In this strategy, we will be discussing the “W” bottoms, and “M” tops.

W-Bottoms

This strategy can be applied when the market is coming from a predominant downtrend. There are four stages to consider to trade the W-bottom (double bottom) Bollinger band strategy.

  1. The reaction low must form around the lower band.
  2. From the lower band, there must be a bounce up to the middle band.
  3. Thirdly, there should be a new low, which must hold above the lower band. The hold above the previous low confirms the inability of the sellers to push the prices lower.
  4. Lastly, the price must move off the low and break the previous resistance. This confirms the start of bullishness in the market.

Example

In the below chart, the market was in a downtrend. It made a low at the lower band and went up until the middle band and held. This satisfies the first two considerations in the W-bottom strategy. Moving forward, the price comes down again, but this time, it holds above the lower band. This confirms the third consideration, as well. Finally, the market shoots up and breaks the resistance (black line), indicating a buy signal.

M-top

M-top is the opposite of the W-bottom strategy. But, the working of this strategy remains the same. That is, firstly, the price must try to go above the upper band. Secondly, the price should drop down to the middle band. Thirdly, it must go up again but not higher than the previous high. And finally, the market must drop below the support line. And once all these scenarios take place, we can prepare to go short.

Example

In the below chart, the market went above the upper band, pulled back to the middle band, shot up again, but could not go higher than the upper band, and finally, the price dropped below the support (black line). So, this is when we can confidently hit the sell.

Strategy 2: Return to the Mean or Middle of the band

If you wish to extract only small profits from the market, then this strategy will be apt for you. This strategy mainly focusses only on small movements rather than big swings. An advantage of this strategy is that you will be able to pull off consistent profits and reduce risks significantly.

The principle of this strategy is to go long when the price comes down to the middle line. However, to reduce the risk, there are some factors which are implemented when trading this strategy. Below, we have mentioned some of the techniques to trade this strategy.

In the below chart, we can see that the market shot to the upside, pulled back to the middle line, and again shot up north. Here, if we were buying at the middle line, we would have made a profit out of it. But, not always will this work in your favor.

There are some points you must consider before trading this strategy. Firstly, the initial buyers must be very strong. Secondly, the sellers (pullback) must be weaker than the preceding buyers. Thirdly, the price must hold around the mean line. The occurrence of patterns like doji, hammer, spinning top, etc. around the mean line can give additional confirmation on the trade. Therefore, once all the criteria are satisfied, you can go for the buy.

Bottom line

Bollinger band is an excellent indicator to determine the direction of the market. The bands indicate if the market is at a relatively high or low. And these highs and lows help in predicting if the market is continuing its trend or preparing to reverse. Also, chartists combine this indicator with other indicators to have an extra edge over their trade.

We hope you understood these strategies. It is highly recommended to try these in your daily trading activities. With practice, you can master this indicator and can make consistent profits if used correctly. Let u know if you have any questions in the comments below. Happy Trading!