Categories
Forex Education Forex System Design

How to Optimize a Trading Strategy

Introduction

Once the developer successfully ends both the multi-market and multiperiod test of a trading strategy, he can move to the optimization process. However, there are some risks associated with its execution that the developer should recognize.

In this educational article, we’ll present the different stages of a trading strategy’s optimization process.

Preparing for the Optimization

After passing the multimarket and multiperiod test, the developer has verified that the trading strategy works. Therefore, he could move toward the next stage that corresponds to the trading strategy optimization.

Optimization is used to determine the optimal parameters for the best result of a specific process. In terms of trading strategy, the optimization corresponds to selecting the most robust parameter set of a strategy that would provide the peak performance in real-time markets. 

Nevertheless, selecting the highest performance that provides the most robust set of parameters can result in challenging work. This situation occurs because each set of parameters will correspond to a specific historical data range used in each simulation.

In this regard, the developer’s top parameter selection must be part of a set of evaluation criteria defined before executing the optimization process.

Risks in Optimization

The optimization has pitfalls that the developer must consider at the time of its execution; these traps can lead to increased risks when applying the trading strategy.

The first risk is overconfidence that the results obtained during optimization will produce the same market results in real-time. The developer must understand the strategy and each effect of the results obtained in each part of the optimization stage.

The second risk involves excessive overfitting of the strategy’s parameters. This risk is due to the execution of the optimization without considering the guidelines and appropriate statistical procedures.

Finally, using a wide range of parameters can lead to obtaining extremely positive backtested results. However, such positive returns generated during the optimization stage do not guarantee that they will happen in real-time markets.

Optimizing a Trading Strategy in MT4

In a previous educational article, we presented the development process of a trading strategy based on the crossings of two moving averages, which corresponds to a linear weighted moving average (LWMA) of 5 periods and a simple moving average (SMA) of 55 periods. 

This example considers the execution of an optimization corresponding to both moving averages, and the optimization’s objective will be to find the highest profit.

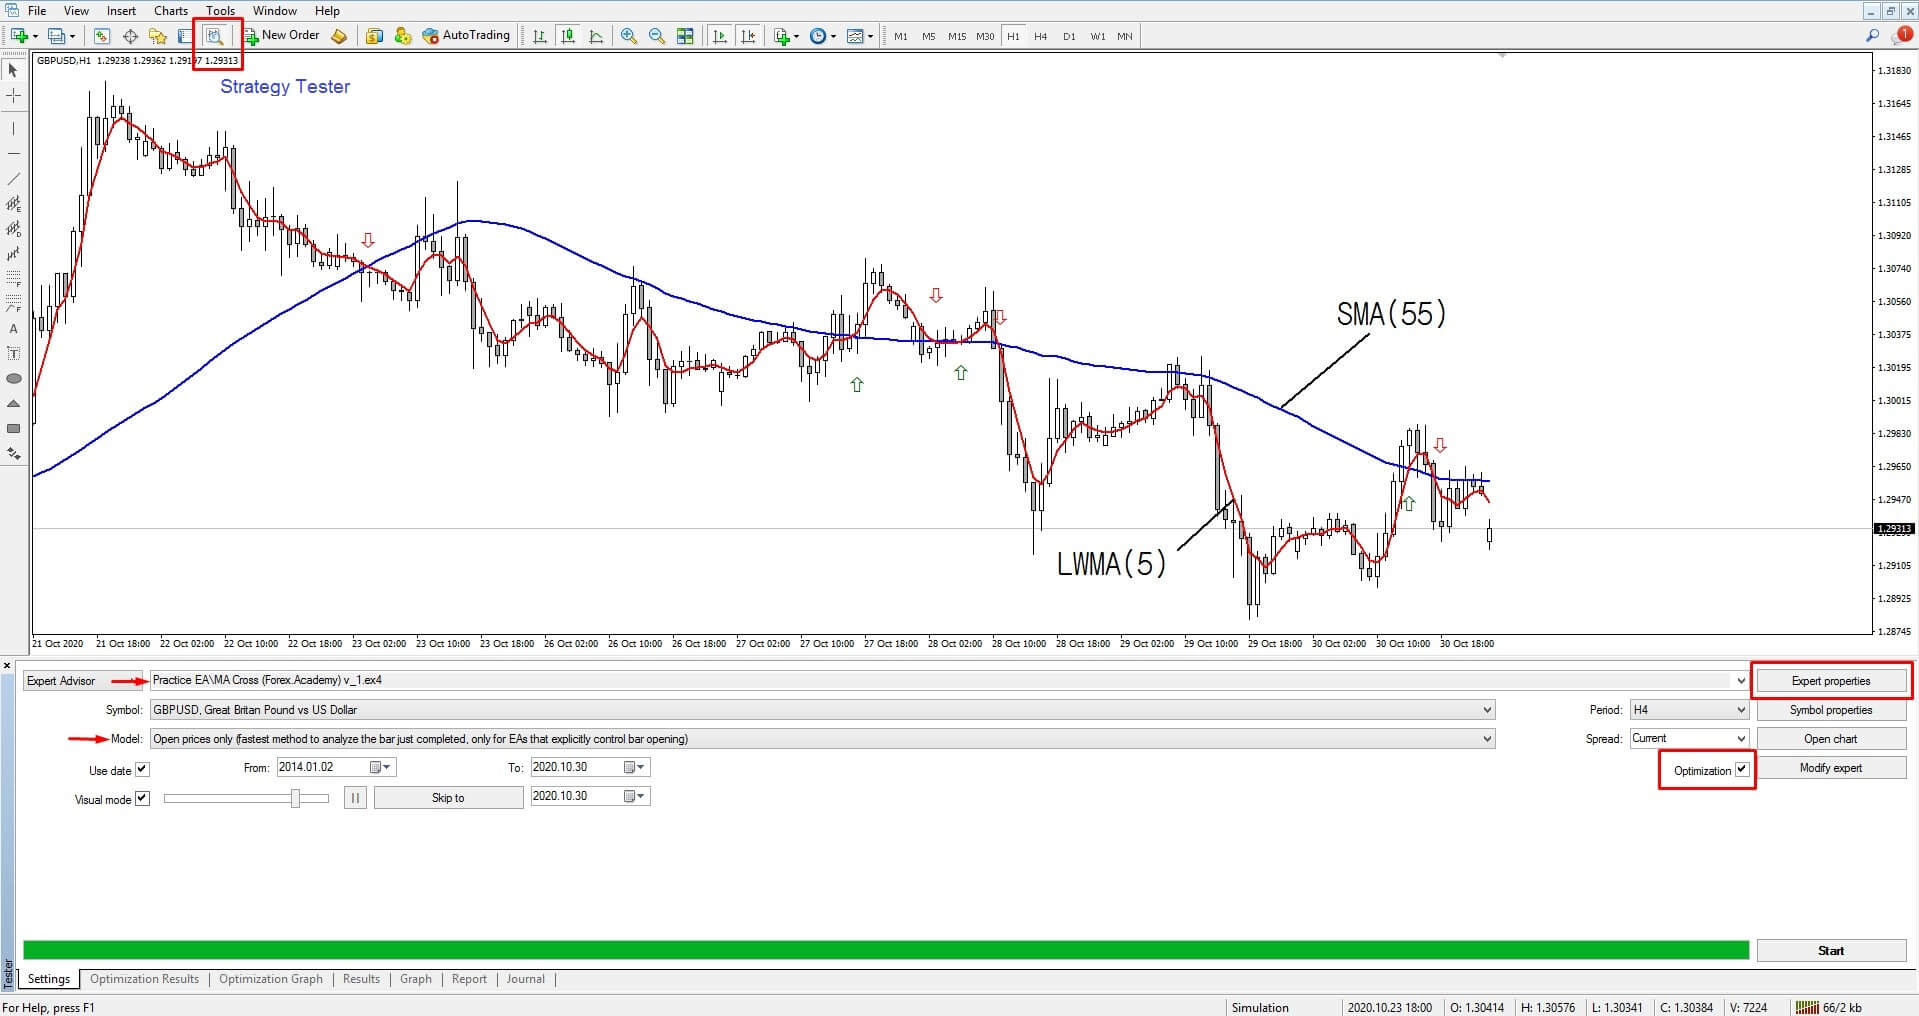
Before executing the optimization, the developer must select the Strategy Tester located in the toolbar, as illustrated in the next figure.

Once picked the trading strategy to optimize, it must select “Expert Properties,” where the developer will identify and define the parameters to optimize.

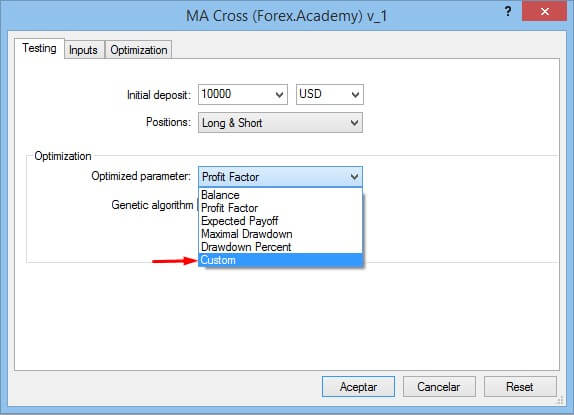
The next figure illustrates the “Expert Properties” box. In the first tab, the developer will select the Testing properties, where the “Custom” option will provide a broad range of outputs for each scenario obtained during the simulation stage. 

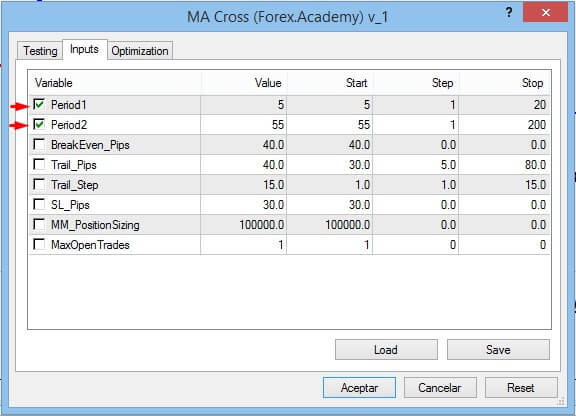
After the Testing selection criteria, the developer can select the parameters to optimize during the historical simulation. In the example, the parameters to optimize will be the fast (LWMA(5)) and the slow (SMA(55)) moving averages. The developer must consider that as long as it increases the parameters to optimize simultaneously, the simulation will increase its length of time.

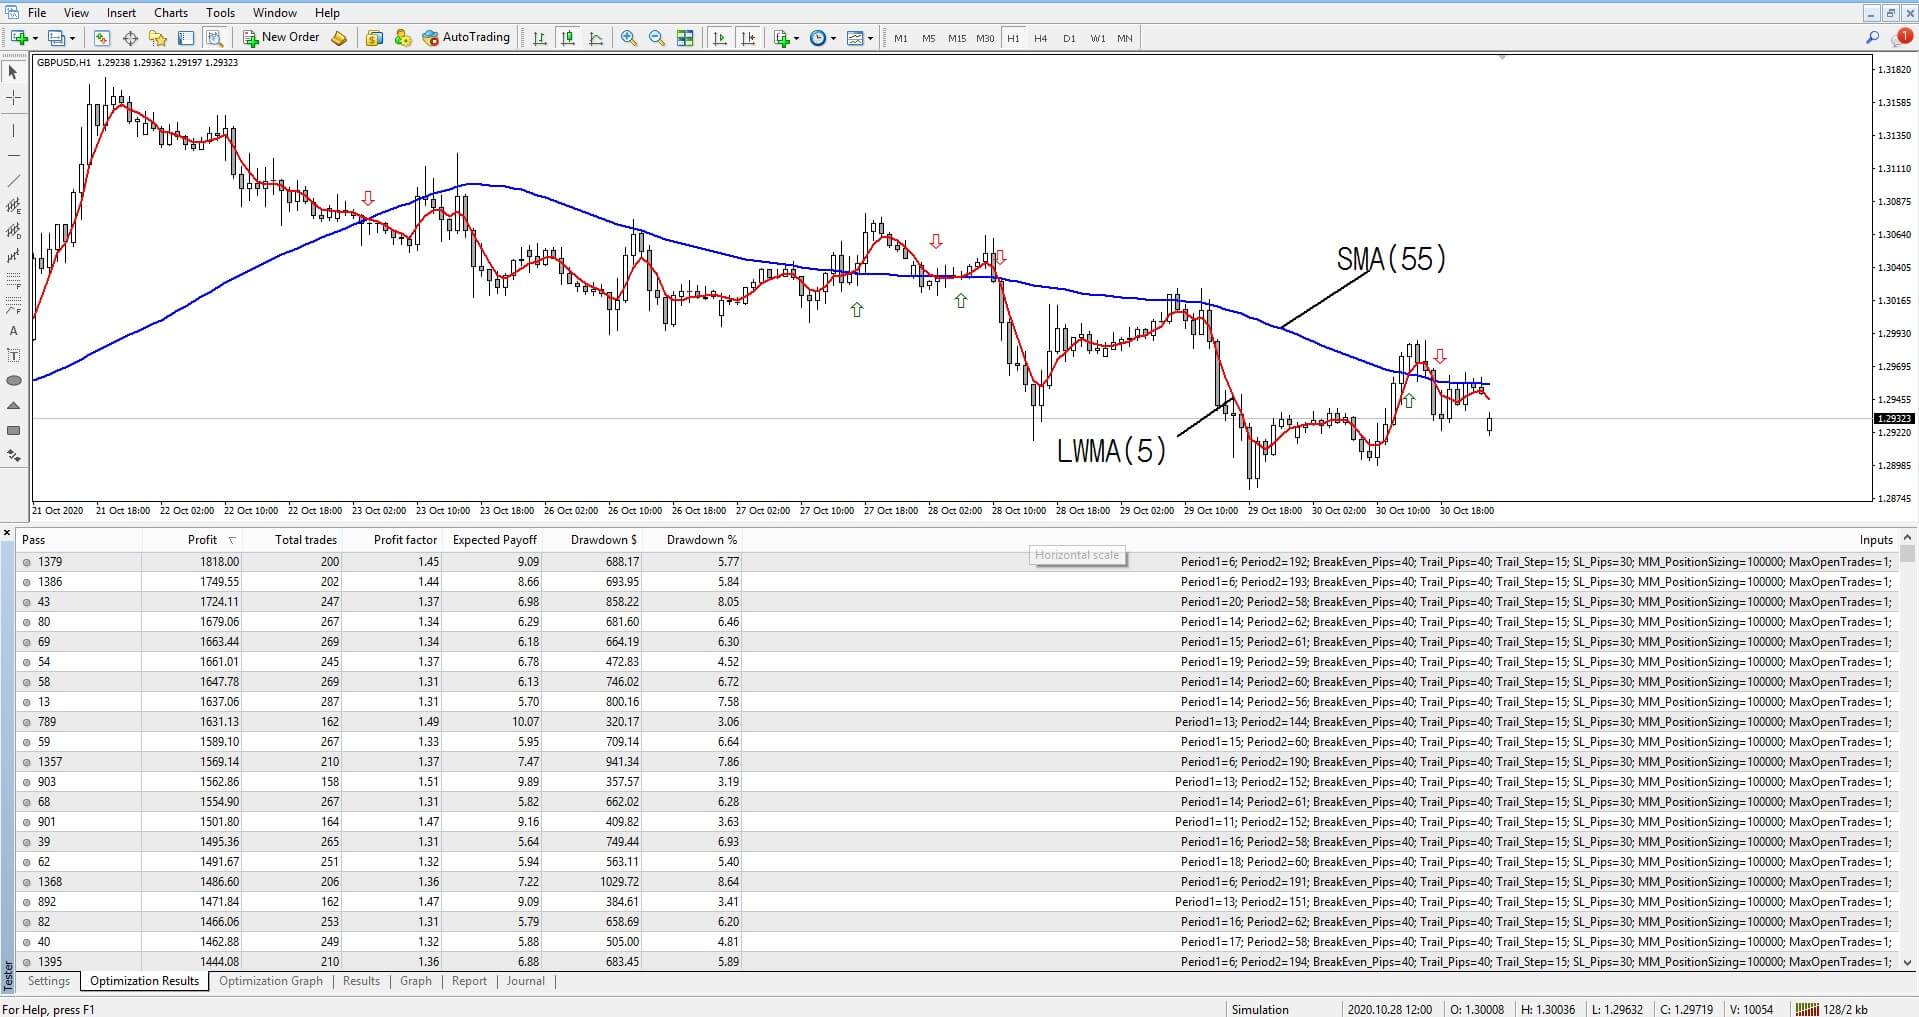
Once the “Start” button is pressed, the Strategy Tester in the “Optimization Results” tab will reveal each parameter variation’s output. In the case illustrated in the following figure, the results are listed from the most to less profitable. 

The results also expose the Total Trades, Profit Factor Expected Payoff, Drawdown ($), and Drawdown (%), and the inputs for each historical simulation.

In conclusion, the trading strategy based on the cross between LWMA(6) and SMA(192) in the historical simulation returned $1,818 of profits with a Drawdown equivalent to 5.77% or $688.17. Likewise, these parameters are valid only for a 4-hour chart

Nevertheless, analyzing the criteria described by Robert Pardo, which considers that a trading strategy should provide three times the drawdown, the strategy should generate three times the dropdown, in this case, the parameters applied into the model returned 2.64 times more profits over the drawdown. 

Next Tasks After the First Optimization

Once the first optimization was performed, the developer should analyze the trading strategy behavior with non-correlated assets and its performance in other timeframes. 

If the strategy passes this stage, the developer could make a walk-forward analysis. Among other questions, the strategist should answer whether the strategy will make money in real-time trading.  He also should evaluate the strategy’s robustness, where he would determine if the strategy is sufficiently robust and ready to trade in real-time.

Finally, once these stages are successfully passed, the trading strategy should be tested with paper money before its implementation in the real market.

Conclusions

In this educational article, we presented the steps for executing a simple optimization corresponding to a trading strategy based on the cross between two moving averages.

Before starting to optimize a trading strategy, the developer must weigh both the risks involved by the optimization process and the optimization analysis’s objective as the results that the study will generate.

Finally, although the optimization process reveals that the trading strategy is robust, the developer must continue evaluating if it can generate real-time trading profits.

Suggested Readings

  • Jaekle, U., Tomasini, E.; Trading Systems: A New Approach to System Development and Portfolio Optimisation; Harriman House Ltd.; 1st Edition (2009).
  • Pardo, R.; The Evaluation and Optimization of Trading Strategies; John Wiley & Sons; 2nd Edition (2008).
Categories
Forex System Design

Starting the Testing Process of a Trading Strategy

Introduction

The development of a trading strategy requires steps to evaluate its reliability during its execution in real markets. To achieve this, the developer must develop a testing process to determine its robustness and viability as a previous step before its optimization.
In this educational article, we’ll introduce the steps of a trading strategy’s testing process.

Getting Started with Testing the Trading Strategy

Once the developer completed the programming of a  candidate trading strategy, it’s time to confirm if the strategy works as the conceptual model assumes. In this regard, the strategist should follow the following steps:

  1. Verify the preliminary profitability of the trading strategy.
  2. Assessing the robustness delivered by the strategy.

The robustness concept relates to the ability to continue generating substantial profits despite adverse market conditions, such as trend changes or extremely volatile conditions. An alternative method for verifying the strategy’s robustness is by assessing if it continues being profitable under a wide basket of markets.

Another critical part of the testing process is to verify the trading rules. As the strategy’s complexity increases, rules also increase in complexity. In this context, the developer must validate that the execution of the buy and sell signals happens at the levels triggered by the strategy’s rules. The verification of entry and exit signals will allow the developer to identify any programming error.

Analyzing Profitability

Once the programming stage is verified, the developer should estimate the trading strategy’s profitability considering a reasonably lengthy historical price series. 

As a guide, a short-term strategy may be tested using two years of price data, a mid-term would need up to four years, and a long-term up to eight years of historical data. Nevertheless, the window size may vary depending on the strategy type or the market conditions.

With this information, the strategist will have a panoramic overview of the trading strategy’s profitability and risk. In this regard, if the strategy’s performance is deemed acceptable, the developer could advance to the next stage of the testing process.

Nevertheless, if the strategy has a poor performance, the developer should judge if it could be redesigned or discard it.  

Finally, for a proper evaluation, the strategy must be run using a standard one unit trading size. This way, the profits would result in multiples of the risk.

The Multimarket and Multiperiod Test

The multimarket and multiperiod test corresponds to the last stage of the testing strategy’s performance. During this historical simulation, the developer must study a set of parameters of the strategy considering a small basket of diversified markets over a broad range of historical periods. In other words, the developer must develop a historical simulation taking a group of different assets using different timeframes.

The developer must select a small portfolio of non-correlated assets; in other words, markets that don’t relate to each other. An example of a non-correlated portfolio is a mix of a commodity, a bond, and a stock index.

Concerning the length of the test period, Robert Pardo suggests that to obtain solid results, the developer should use ten years of historical data for each market. However, it could start from five years of historical prices. Pardo’s figures are related to long-term stock trades using daily timeframes. Intra-day trading systems, as already stated, would require smaller data ranges.

The results obtained from the historical simulation will provide an objective overview of the trading strategy’s profit and risk.  Depending on the results obtained, the developer may terminate if the strategy is robust and produces reasonable returns or if it performs poorly and should be rejected. Likewise, the strategist may observe that the strategy presents mixed results, so it should not be rejected entirely.

Conclusions

During the testing process of a trading strategy, the developer must evaluate a broad range of aspects that ensure the correct work during its evaluation.

For example, the developer must verify if the opening and closing trades’ programming rules execute as the strategy requires. After this step, the robustness degree will drive the strategist to conclude if it is viable in real markets, needs improvements, or should be rejected.

Finally, on a multimarket and multiperiod test, the developer must evaluate the strategy’s performance in a small non-correlated portfolio using different timeframes. Once this historical simulation is made, the strategist would be able to confirm if the strategy is robust and viable or reject it before continuing with the optimization stage.

Suggested Readings

  • Jaekle, U., Tomasini, E.; Trading Systems: A New Approach to System Development and Portfolio Optimisation; Harriman House Ltd.; 1st Edition (2009).
  • Pardo, R.; The Evaluation and Optimization of Trading Strategies; John Wiley & Sons; 2nd Edition (2008).
Categories
Forex System Design

Introduction to Optimization of a Trading System

Introduction

Once the system developer tested and validated the trading system, the next stage corresponds to the optimization process. The developer will estimate different values for the key model parameters.
This educational article will introduce the basic concepts in the optimization process of a trading system.

The Optimization Process

Before getting started into the optimization process, the developer must weigh and adjust the investor’s interests with the purpose of the optimization and limitations both the strategy and reality. In this regard, the optimization must align with realistic objectives. For example, the drawdown should not exceed 10% of the trading account, or to obtain a yearly net profit of 15% from the invested capital.

The optimization of a trading system is the stage that seeks the best or most effective use, which allows investors to obtain the highest performance of the trading system. In this context, the optimization could be the search of what inputs could maximize the profits or accomplish the investor’s requirements to minimize the drawdown. To achieve this, the developer must evaluate the variables that conform to the rules and formulas that define and models the system’s structure.

The system developer must consider that an incorrect optimization can drive to obtain serious errors. For this reason, the optimization process is a critical stage in trading system development.

What is the Optimization of Trading Systems?

In general terms, the optimization process is a mathematical method oriented to improve or find an “optimal” solution to a specific problem. In the trading system development, the optimization corresponds to the best parameter selection that allows the strategy to obtain the peak performance in the real market.

Getting Started

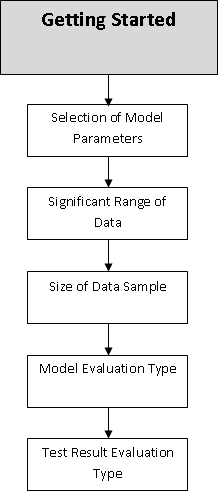
Once the system developer tested the trading strategy’s capability to catch market movements, the steps to start the optimization are as follows:

  1. Selection of the model parameters that have the most significant impact on the system’s performance; if a model’s variable is not relevant, it could be fixed.
  2. Selection of a significant range of data needed to test the parameter to be optimized. This range must generate a significative sample to study the model. For example, the amount of data required to evaluate a 20-day moving average is lower than the one needed to assess a 200-day moving average.
  3. Selecting the data sample size. It must be representative enough to ensure the statistical validity to make estimations. The size also must be representative of the market as a whole.
  4. Selection of the model evaluation type, this stage will depend on the evaluation type, objective, or test criteria; this selection will change depending on the kind of trading model.
  5. Selection of the test result evaluation type, this stage must evaluate the results of the optimization process with a statistical significance, meaning the results are not due to chanve. For example, a P-value below 5% would be statistically “significant,” and below 1% would be “highly significant.” Additionally, the average and the standard deviation of the results must be evaluated. As a final note, profit spikes should be considered as abnormal and be discarded.

The figure summarizes the five selections that the system developer must take before to start the optimization process.

Conclusions

The optimization process is a critical stage that comes after the testing process. In this stage, the system developer seeks to determine the appropriate value for the most robust trading strategy implementation. 

Nevertheless, before starting with the optimization, the developer must take a set of decisions, such as which the objective of the optimization? Is it realistic?

Once defined the target of the optimization, the developer must select which parameters to optimize, the range of data to be used in the analysis, how much data will require the sample, which will be the evaluation type of the model, and the evaluation criteria of the test results.

Finally, when all these five steps have been completed, the system developer is ready to start to perform the optimization.

Suggested Readings

  • Jaekle, U., Tomasini, E.; Trading Systems: A New Approach to System Development and Portfolio Optimisation; Harriman House Ltd.; 1st Edition (2009).
  • Pardo, R.; Design, Testing, and Optimization of Trading Systems; John Wiley & Sons; 1st Edition (1992).
Categories
Forex System Design

Testing Process of a Trading System

Introduction

Upon completion of the first steps of the process to build the trading system, the developer must validate the model with a defined confidence level. This evaluation should provide specific metrics to assess the model’s capability to generate profits and the risk of using it.
In this educational article, we will discuss the testing process of a trading system, including the evaluation and optimization process.

Testing Process

The testing process is a critical stage in the trading system development; in this phase, the developer must validate the system’s behavior in a simulated market context with real data. This process leads the developer toward deciding how much data will be needed to verify the model. 

The data size should be significant enough to provide results with a confidence level, such as in statistical terms, a 95% confidence. Considering that volatility and market dynamics changed in the last 40 years, the consideration of 40 years of data could not be adequate to evaluate the model. In this regard, 5 to 15 years of market data could be enough for the right estimation of the system’s performance.

In the first step, the system developer should realize a back-test evaluating the system’s construction logic and the performance with historical data. The results must be studied with an objective quantitative method as the statistical inference. This process’s results could drive the system’s developer to discover some optimization model based on the market’s synchronicity. 

After this optimization, the next step in the testing process is in terms of Jaekle and Tomasini, the walk-forward analysis. A walk-forward analysis is a series of multiple and successive out-of-sample test over different chunks of the data series. The data used in the walk-forward tests should be unused portions of the historical data.

Once verified the trading system capability to generate profits with an acceptable risk level, the system could be tested using real-time data and paper money to evaluate its performance in front of new market conditions. In this context, the time to run the system should be flexible and dependent on the developer’s experience.

A Question of Samples

A sample is just a portion of the whole phenomenon under study; in a trading system, the event under analysis corresponds to the results from a trading entry series. In this context, the final result corresponds to the profit/loss level generated on each trade. In other words, a sample with one trading signal could not represent the trading system’s capability to generate profits. Therefore, the trading signals generated by the system should be significatively bigger to evaluate its performance, and in consequence, the sample used should be representative of the whole series.

The result from the sample evaluation will be an average of the potential returns of the trading system. Considering the variability of the results, the trading system developer will have to analyze the degree of variation of the returns with respect to the average return. In statistical words, the developer will have to study the standard deviation of the trading system.

An example of this analysis could be the return average of the trading system is $100 per trade with a standard deviation of $15 per trade, this means that the trading system may show returns between $85 to $115 per trade 68 percent of the time. 

Is it Necessary to Optimize the System?

The optimization process is a way to adjust some variables oriented not only to maximize the profits but also to reduce the risk taken on each trade and improve the trailing stop methodology. It could also have to target the reduction of false trade signals, for example, to avoid the market entries when the price action realizes a false breakout. However, according to Jaekle and Tomasini, there exist the possibility of incurring an over-optimization, which could reduce the system’s performance.

Conclusions

The testing process is a step intended to evaluate the trading system’s ability to generate profits and identify the variability level of its results with a confidence level. In this way, the system developer must analyze the system’s performance, using both historical and real-time market data. At the same time, the period required to study the system’s performance in real-time will depend on the developer’s experience. 

The requirement of optimization will depend on the variable to need to be improved. This process could carry the trading system to reduce its efficiency in its capability to generate trading signals. 

Finally, in our next educational article, we will expand the optimization process and some metrics to evaluate the trading system performance.

Suggested Readings

– Jaekle, U., Tomasini, E.; Trading Systems: A New Approach to System Development and Portfolio Optimisation; Harriman House Ltd.; 1st Edition (2009).

Categories
Forex Educational Library

The Trading Record

Introduction

Traders want to win. Nothing else matters to them; and they think and believe the most important question is timing the entry. Exits don’t matter at all, because if they time the entry, they could easily get out long before a retracement erases their profit. O so they believe.

That’s the reason there are thousands of books about Technical Analysis, Indicators, Elliott Wave Forecasting, and so on, and just a handful of books on psychology, statistical methods, and trading methodology.

The problem lies within us, not in the market. The truth is not out there. It is in here.

There are a lot of psychological problems that infest most of the traders. One of the most dangerous is the need to be right. They hate to lose, so they let their losses run hoping to cover at a market turn and cut their gains short, afraid to lose that small gain. This behavior, together with improper position sizing is the cause of failure in most of the traders.

The second one is the firm belief in the law of small numbers. This means the majority of unsuccessful traders infer long-term statistical properties based on very short-term data. When his trading system enters in a losing streak, they decide the system doesn’t work, so they look for another system which, again, is rejected when it enters in another losing sequence and so on.

There are two problems with this approach. The first one is that the trading account is constantly consumed because the trader is discarding the system when sits at its worst performance, adding negative bias to his performance every time he or she switches that way. The second one is that the wannabe trader cannot learn from the past nor he can improve it.

This article is a rough approach to the problem of establishing a trading methodology.

1.- Diversification

The first measure a trader should take is:

  1. A portfolio between 3-10 of uncorrelated and risk-adjusted assets; or
  2. A portfolio of 3 to 5 uncorrelated trading systems; or
  3. Both 1 and 2 working together.

What’s the advantage of a diversified portfolio:

The advantage of having a diversified portfolio of assets is that it smooths the equity curve and, and we get a substantial reduction in the total Drawdown. I’ve experienced myself the psychological advantage of having a large portfolio, especially if the volatility is high. Losing 10% on an asset is very hard, but if you have four winners at the same time, then that 10% is just a 2% loss in the overall account, that is compensated with, maybe, 4-6% profits on other securities. That, I can assure you, gave me the strength to follow my system!.

The advantage of three or more trading systems in tandem is twofold. It helps, also improving overall drawdown and smooth the equity curve, because we distribute the risk between the systems. It also helps to raise profits, since every system contributes to profits in good times, filling the hole the underperforming one is doing.

That doesn’t work all the time. There are days when all your assets tank, but overall a diversified portfolio together with a diversified catalog of strategies is a peacemaker for your soul.

2.- Trading Record

As we said, deciding that a Trading System has an edge isn’t a matter of evaluating the last five or ten trades. Even, evaluating the last 30 trades is not conclusive at all. And changing erratically from system to system is worse than random pick, for the reasons already discussed.

No system is perfect. At the same time, the market is dynamic. This week we may have a bull and low volatility market and next one, or next month, we are stuck in a high-volatility choppy market that threatens to deplet our account.

We, as traders need to adapt the system as much as is healthy. But we need to know what to adjust and by how much.

To gather information to make a proper analysis, we need to collect data. As much as possible. Thus, which kind of data do we need?

To answer this, we need to, first look at which kind of information do we really need. As traders, we would like to data about timing our entries, our exits, and our stop-loss levels. As for the entries we’d like to know if we are entering too early or too late. We’d like to know that also for the profit-taking. Finally, we’d like to optimize the distance between entry and stop loss.

To gather data to answer the timing questions and the stop loss optimum distance the data that we need to collect is:

  • Entry type (long or short)
  • Entry Date and time,
  • Entry Price
  • Planned Target price
  • Effective exit price
  • Exit date and time
  • Maximum Adverse Excursion (MAE)
  • Maximum Favourable Excursion(MFE)

All the above concepts are well known to most investors, except, maybe, the two bottom ones. So, let me focus this article a bit on them, since they are quite significant and useful, but not too well known.

MAE is the maximum adverse price movement against the direction of the trend before resuming a positive movement, excluding stops. I mean, We take stops out of this equation. We register the level at which a market turn to the side of our trade.

MFE is the maximum favourable price movement we get on a trade excluding targets. We register the maximum movement a trade delivers in our favour. We observe, also, that the red, losing trades don’t travel too much to the upside.


Having registered all these information, we can get the statistical evidence about how accurate our entry timing is, by analysing the average distance our profitable trades has to move in the red before moving to profitability.

If we pull the trigger too early, we will observe an increase in the magnitude of that mean distance together with a drop in the percent of gainers. If we enter too late, we may experience a very tiny average MAE but we are hurting our average MFE. Therefore, a tiny average MAE together with a lousy average MFE shows we need to reconsider earlier entries.

We can, then, set the invalidation level that defines our stop loss at a statistically significant level instead of at a level that is visible for any smart market participant. We should remember that the market is an adaptive creature. Our actions change it. It’s a typical case of the scientist influencing the results of the experiment by the mere fact of taking measurements.

Let’s have a look at a MAE graph of the same system after setting a proper stop loss:

Now All losing trades are mostly cut at 1.2% loss about the level we set as the optimum in our previous graph (Fig 2).  When this happens, we suffer a slight drop in the percent of gainers, but it should be tiny because most of the trades beyond MAE are losers. In this case, we went from 37.9% winners down to 37.08% but the Reward risk ratio of the system went from results 1.7 to 1.83, and the average trade went from $12.01 to $16.5.

In the same way, we could do an optimization analysis of our targets:

We observed that most of the trades were within a 2% excursion before dropping, so we set that target level. The result overall result was rather tiny. The Reward-to-risk ratio went to 1.84, and the average trade to 16.7

These are a few observations that help us fine-tune our system using the statistical properties of our trades, together with a visual inspection of the latest entries and exits in comparison with the actual price action.

Other statistical data can be extracted from the tracking record to assess the quality of the system and evaluate possible actions to correct its behaviour and assess essential trading parameters. Such as Maximum Drawdown of the system, which is very important to optimize our position size, or the trade statistics over time, which shows of the profitability of the system shrinks, stays stable or grows with time.

This kind of graph can be easily made on a spreadsheet. This case shows 12 years of trading history as I took it from a MACD trading system study as an example.

Of course, we could use the track record to compute derived and valuable information, to estimate the behaviour of the system under several position sizes, and calculate its weekly or monthly results based in the estimation, along with the different drawdown profiles shaped. Then, the trader could decide, based upon his personal tolerance for drawdown, which combination of Returns/drawdown fit his or her style and psychological tastes.

The point is, to get the information we must collect data. And we need information, a lot of it, to avoid falling into the “law of small numbers” fallacy, and also to optimize the system and our risk management.

Note: All images were produced using Multicharts 11 Trading Platform’s backtesting capabilities.