What is Scalping?
Scalping is one of the trading styles in the forex market, which is gaining popularity with the emergence of artificial intelligence and automated trading systems. Nowadays, there are a set of traders who enjoy scalping than day trading, swing trading, or position trading.
The main difference between scalping and other styles of trading is that in scalping, the trading time frame is very short and face-paced. The holding period does not last more than a few minutes, whereas ‘positional’ traders hold their trades from 1-Hour to few weeks. Scalpers find trading opportunities on very short timeframes such as the 1-Minute and 3-Minutes.
Impulsive traders are the ones who are most attracted to scalping, as they don’t want to wait for a trade to set up on the higher time frame. Sadly, new traders fall into this trap and start scalping the market, totally unaware of the risk it carries.
To scalp, a trader needs to be experienced. We recommend first being consistently profitable on the higher time frame or swing trading and then move on to scalping. Because this form of trading is extremely difficult as it requires a trader to make decisions in mere seconds or minutes.
5-Minute Scalping Strategy
In this section, we’ll cover a simple yet very effective scalping strategy on the 5-minute timeframe. The most suitable time to implement this strategy is during volatile market conditions. This means the best results are obtained during the New York-London session overlap (8:00 AM to 12:00 PM EST). During this time, trading costs are also relatively low, and liquidity is high, which is essential for the scalpers to take a trade.
We will be using two exponential moving averages in this strategy. Below are the indicators that one needs to apply to their charts.
- 50-Period exponential moving average
- 200-Period exponential moving average
- Stochastic indicator
The Strategy
Let us look at the detailed steps involved in the 5-minute scalping strategy.
Step 1️⃣ – Identify the current trend
The two EMAs are used to indicate the trend in the 5-minute chart. To identify the larger trend, a trader will have to change the time frame to 15-minutes. Identifying the bigger trend is crucial to understand the overall direction of the market. The 50-period EMA is much faster than the 200-period EMA, which means it reacts to price changes more quickly.
If a faster (50-period) EMA crosses above the slower EMA (200-period), it means the prices are starting to rise, and the uptrend is more likely to be established. Similarly, a cross of faster EMA below the slower EMA indicates a drop in the price, and that also means a downtrend is about to form. Always make sure to take trades in the direction of the major trend.
Step 2️⃣ – Look for a pullback
Once we determine the current trend on the 5-minute chart based on EMA’s, it is time to wait for a pullback and stabilization of the price. This is one of the most important steps in this strategy as prices tend to make false moves after strong ups or downs. By waiting for the pullbacks, we can prevent ourselves from entering long or short positions too early.
Step 3️⃣ – Confirmation with the Stochastic Indicator
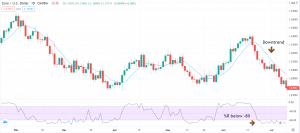
Finally, the Stochastic indicator gives the confirmation signal and helps us to take only highly-profitable trades. A reading above 80 indicates that the recent up move was strong, and a down move can be expected at any time. This is referred to as the overbought market condition. Whereas, a reading below 20 indicates that the recent down move was strong, and an up move is about to come. This market condition is referred to as the oversold market condition. After a pullback to the EMA’s, the Stochastic Indicator’s final confirmation gives us the perfect trade entry.
Let us understand this strategy better with the help of an example.
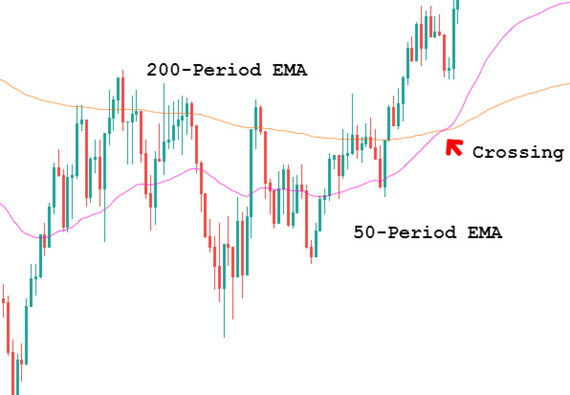
Chart-1
The above figure is a 5-minute chart of a currency pair, and the 200-period EMA is represented by the orange line while the 50-period EMA is represented by the pink line. The cross of the pink line above the orange line signals that the currency pair is entering into an uptrend on the 5-minute chart. As long as the faster EMA remains above the slower EMA, we’ll only look for buying opportunities. This step is to identify the direction and crossing of the two EMAs.
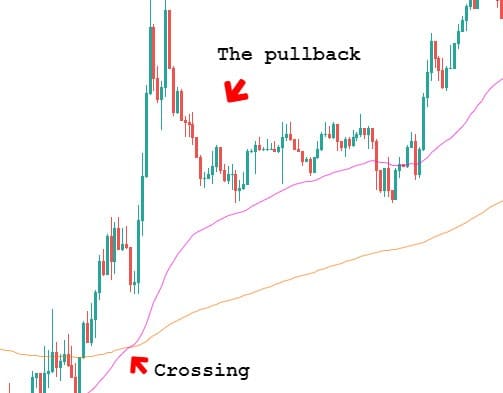
Chart-2
A trader shouldn’t be going ‘long’ as soon as they see the lines crossing. They should always wait for the pullback and only then take an entry. In ‘chart-2’, when we move further, we were getting the kind of pullback that we exactly need.
The next question is, at which point to buy?

Chart-3
The Stochastic plotted in the above chart helps in giving us the perfect entry points by getting into the oversold area. One can take a risk-free entry after all the indicators support the direction of the market.
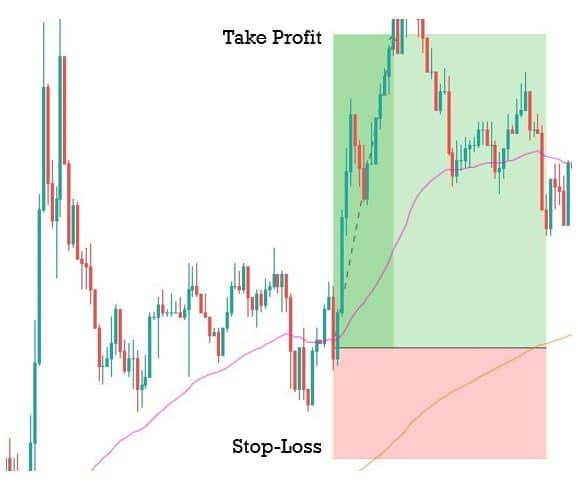
Chart-4
Final words
Scalping is a faced-paced way of trading that is preferred by a lot of traders these days. The main difference between scalping and other styles of trading is the timeframes involved in analyzing the market. This type of trading carries certain risks that are unavoidable, such as high trading costs and market noise, which can impact your profits. We hope you find this article informative. Let us know if you have any questions below. Cheers!