Categories
Forex Course Forex Daily Topic

180. Picking Accurate Tops & Bottoms Using the COT Report

Introduction

Our previous lesson covered how you can use the Commitment of Traders report to trade in the forex market. In this lesson, we will learn how you can use the COT report to identify the tops and bottoms, i.e., the levels where a currency is overbought or oversold.

Any forex trader would know that the best timing for a reversal trade is when the market is at extreme levels. The COT report helps us understand the trades’ volume and how the different types of traders are positioned. In the previous lesson, we learned that non-commercial traders’ positioning could be used to determine the market trend. On the other hand, commercial traders accumulate their trades around extreme levels where they believe a market reversal could occur. Thus, the positioning of hedgers can be used to determine the market tops and bottoms.

Now, let’s see how you can identify these extreme levels in forex using the COT report.

How to identify Tops (Overbought Levels) Using the COT Report

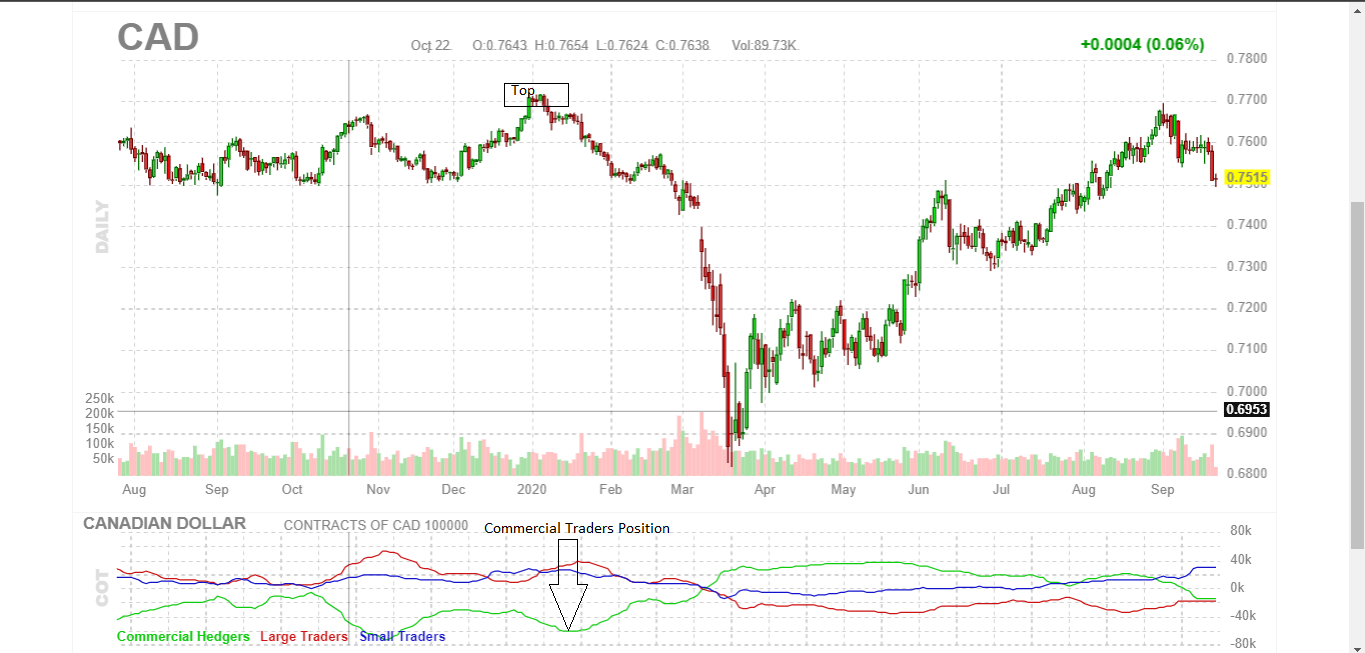
It is worth noting that when the markets are rising, the non-commercial traders are buying, i.e., they are bullish. Conversely, the commercial traders (hedgers) are bearish when the markets are rising, meaning they are actively shorting the futures contracts in a bullish market. Therefore, in a bullish market, when speculators continually go long as the hedgers keep shorting, a market top will form.

However, it is almost impossible to predetermine a market top. The best way to spot a market top is to notice a reversal beginning to occur in the market when the spread between the commercial traders and non-commercial traders has widened.

The screengrab above shows a market top formed when the short positions by commercial traders were at maximum. Also, notice that the spread between the commercial and non-commercial traders was wider.

How to identify Bottoms (Oversold Levels) Using the COT Report

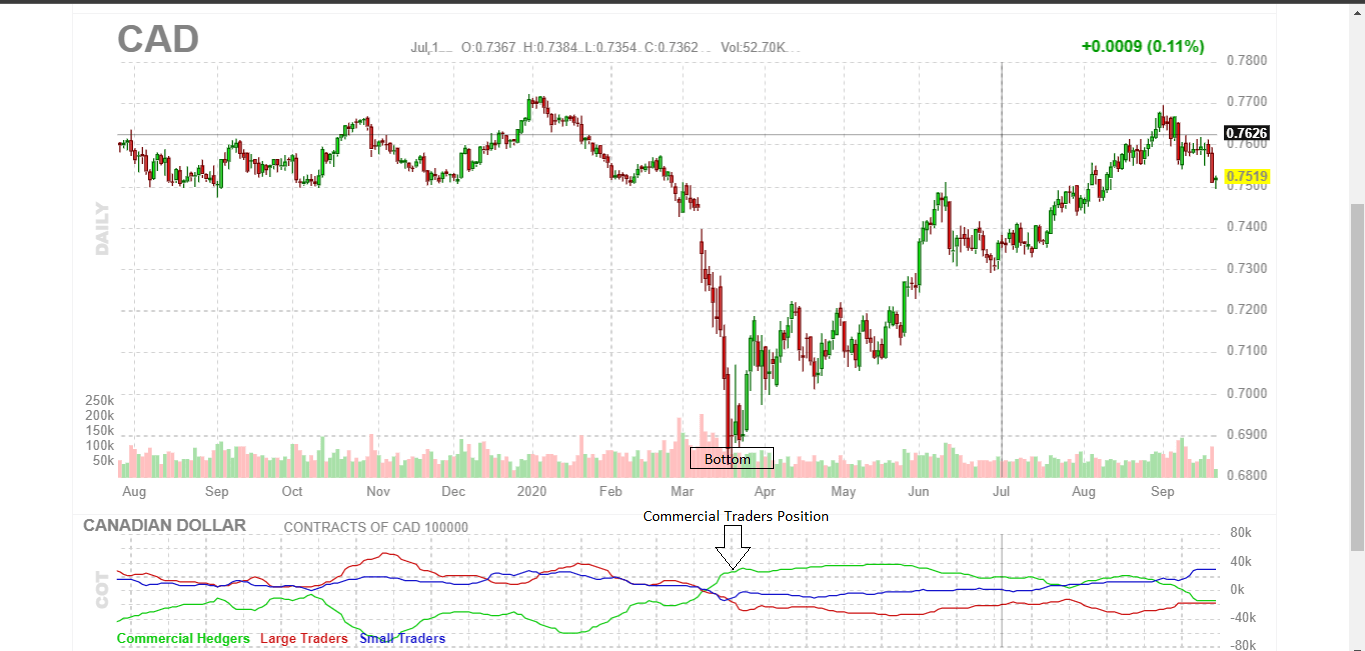
When the market prices are falling, non-commercial traders are bearish while the commercial traders are bullish. Therefore, a bearish market will reach the bottom when the non-commercial traders keep selling, and the commercial traders maximize their futures bullish positions.

The best way to spot a market bottom is to notice a bear market trend reversing while the spread between the commercial traders and non-commercial traders has widened.

The screengrab above shows a market bottom forming when the long futures position by the commercial traders was at the maximum. Also, note that the spread between the commercial and non-commercial traders was widest at this point.

[wp_quiz id=”89702″]
Categories
Forex Videos

Forex – Overbought & Oversold – Easy Market Reversal Strategy!


Overbought and oversold, how can you tell when the market will reverse? 


Thank you for joining this forex academy educational video.

In this session, we will be looking at when a currency pair is overbought or oversold and how to take advantage of this.

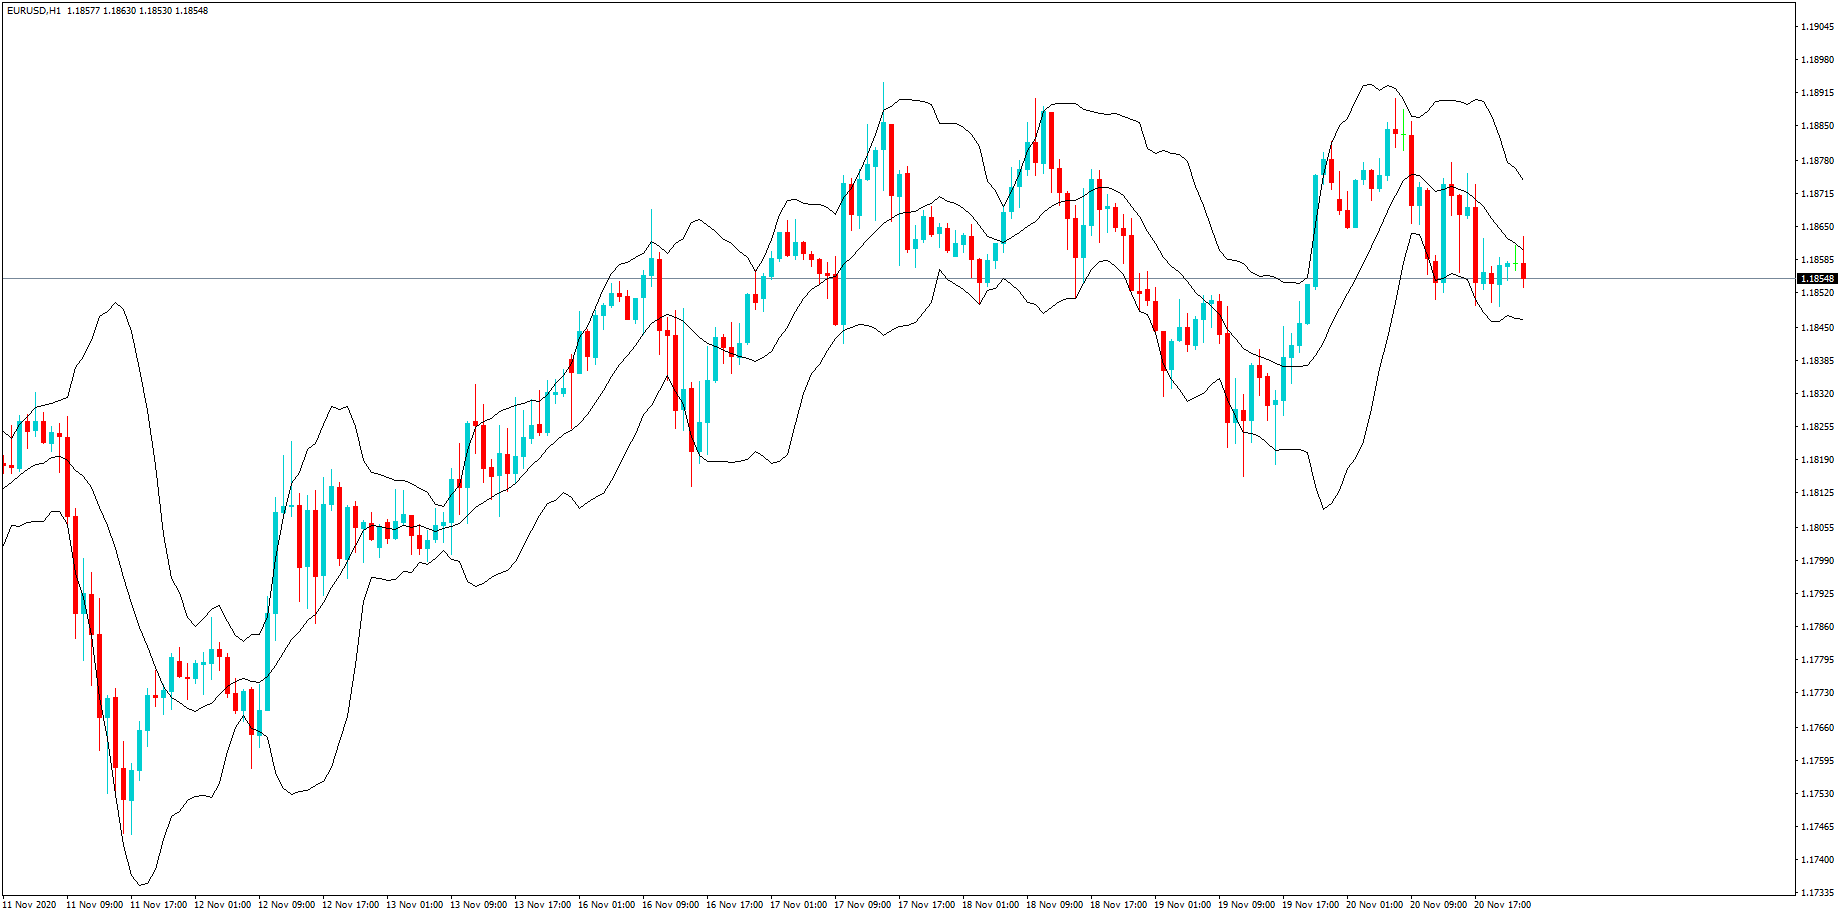
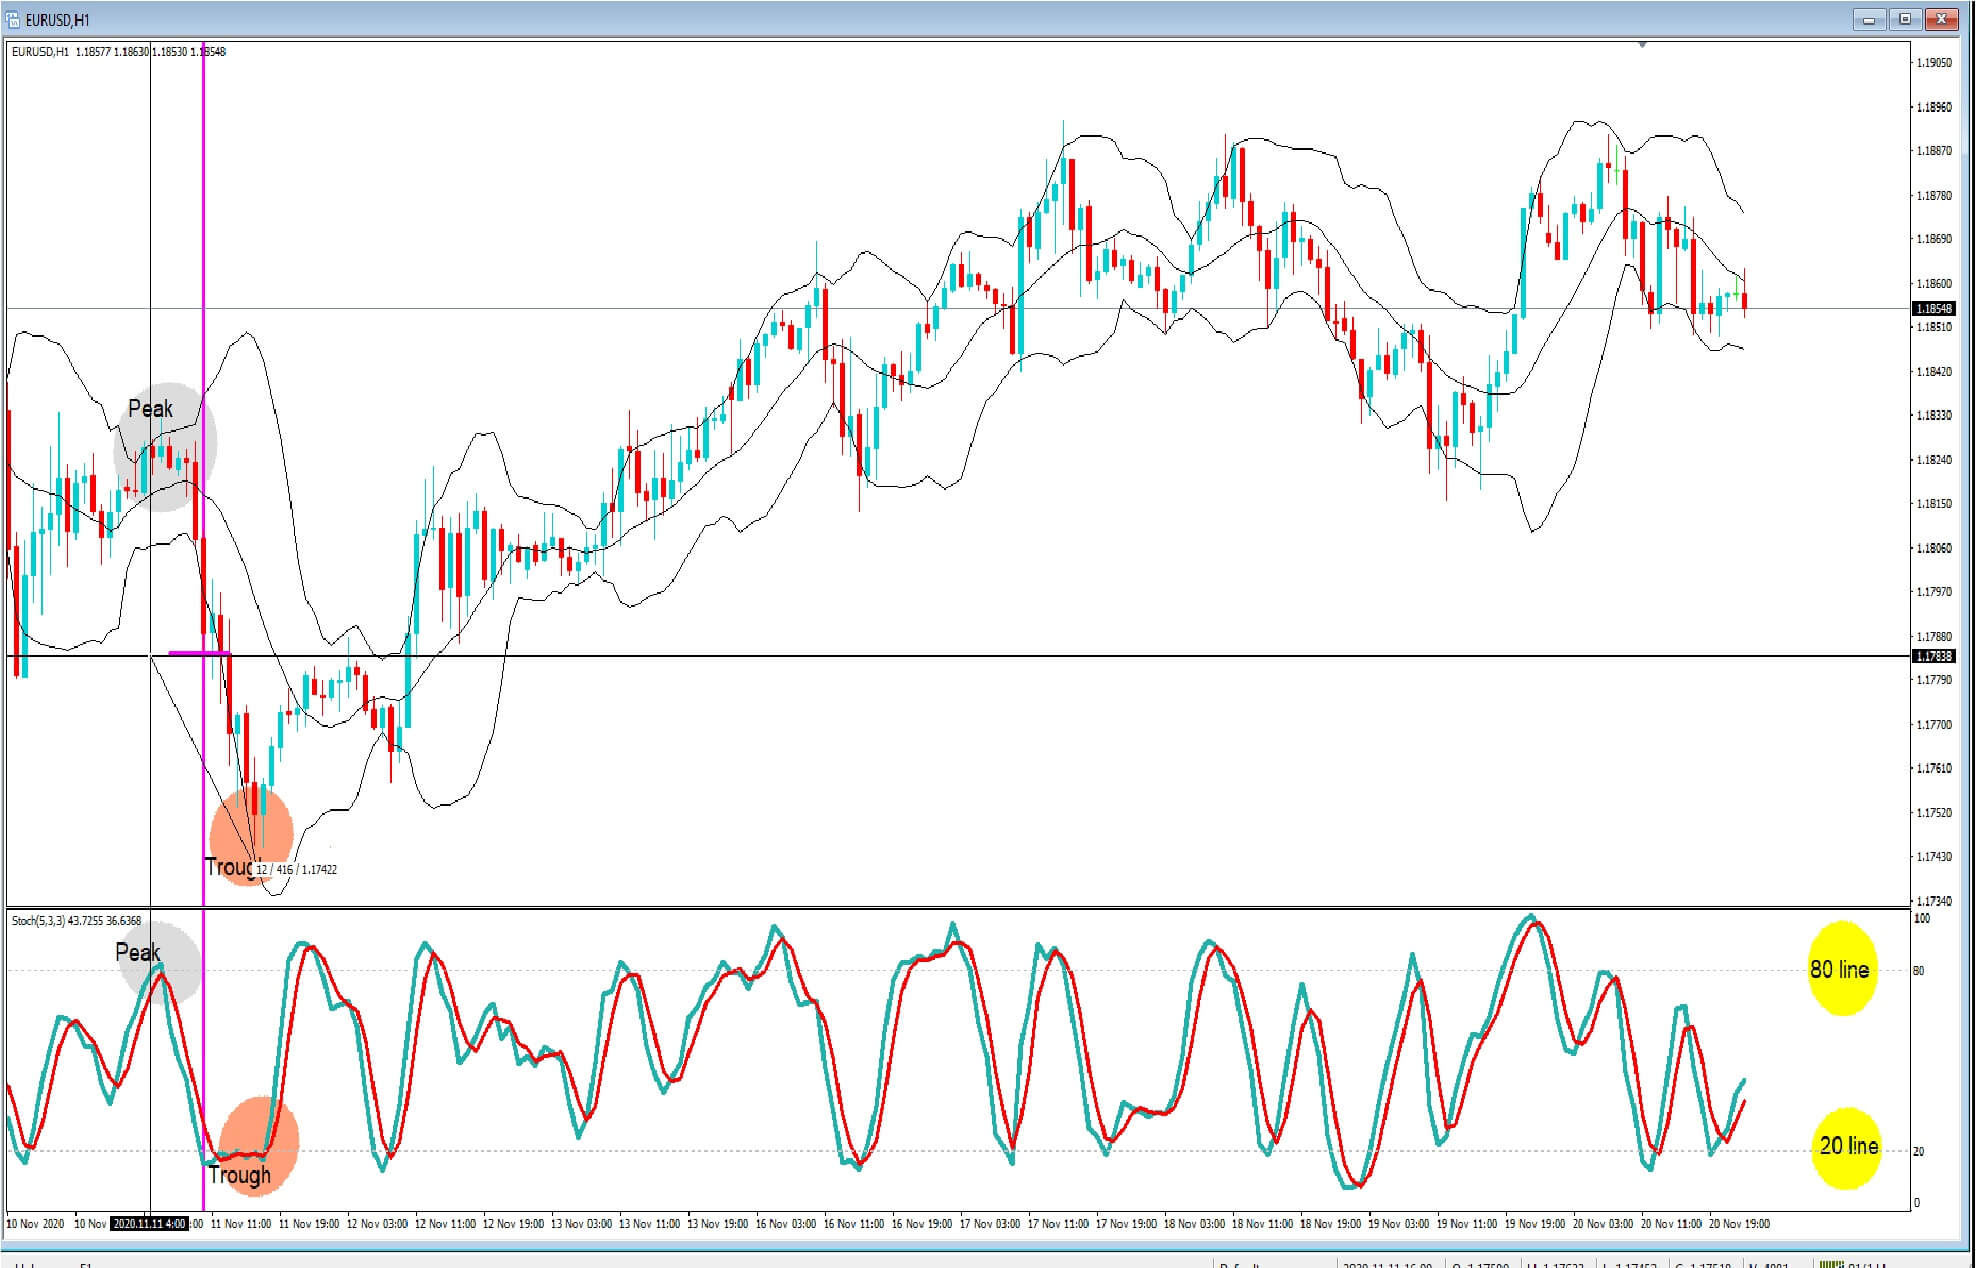
To try and gauge the best way wait to take advantage of when a market is overbought or oversold, we must first take a look at the biggest by volume currency pair traded in the forex market: the Euro against the US dollar, a so-called major currency pair. And this is a one-hour chart of recent price action.

To establish when a pair is oversold or overbought, there are a multitude of tools available. We will focus on one oscillator and price patterns. 

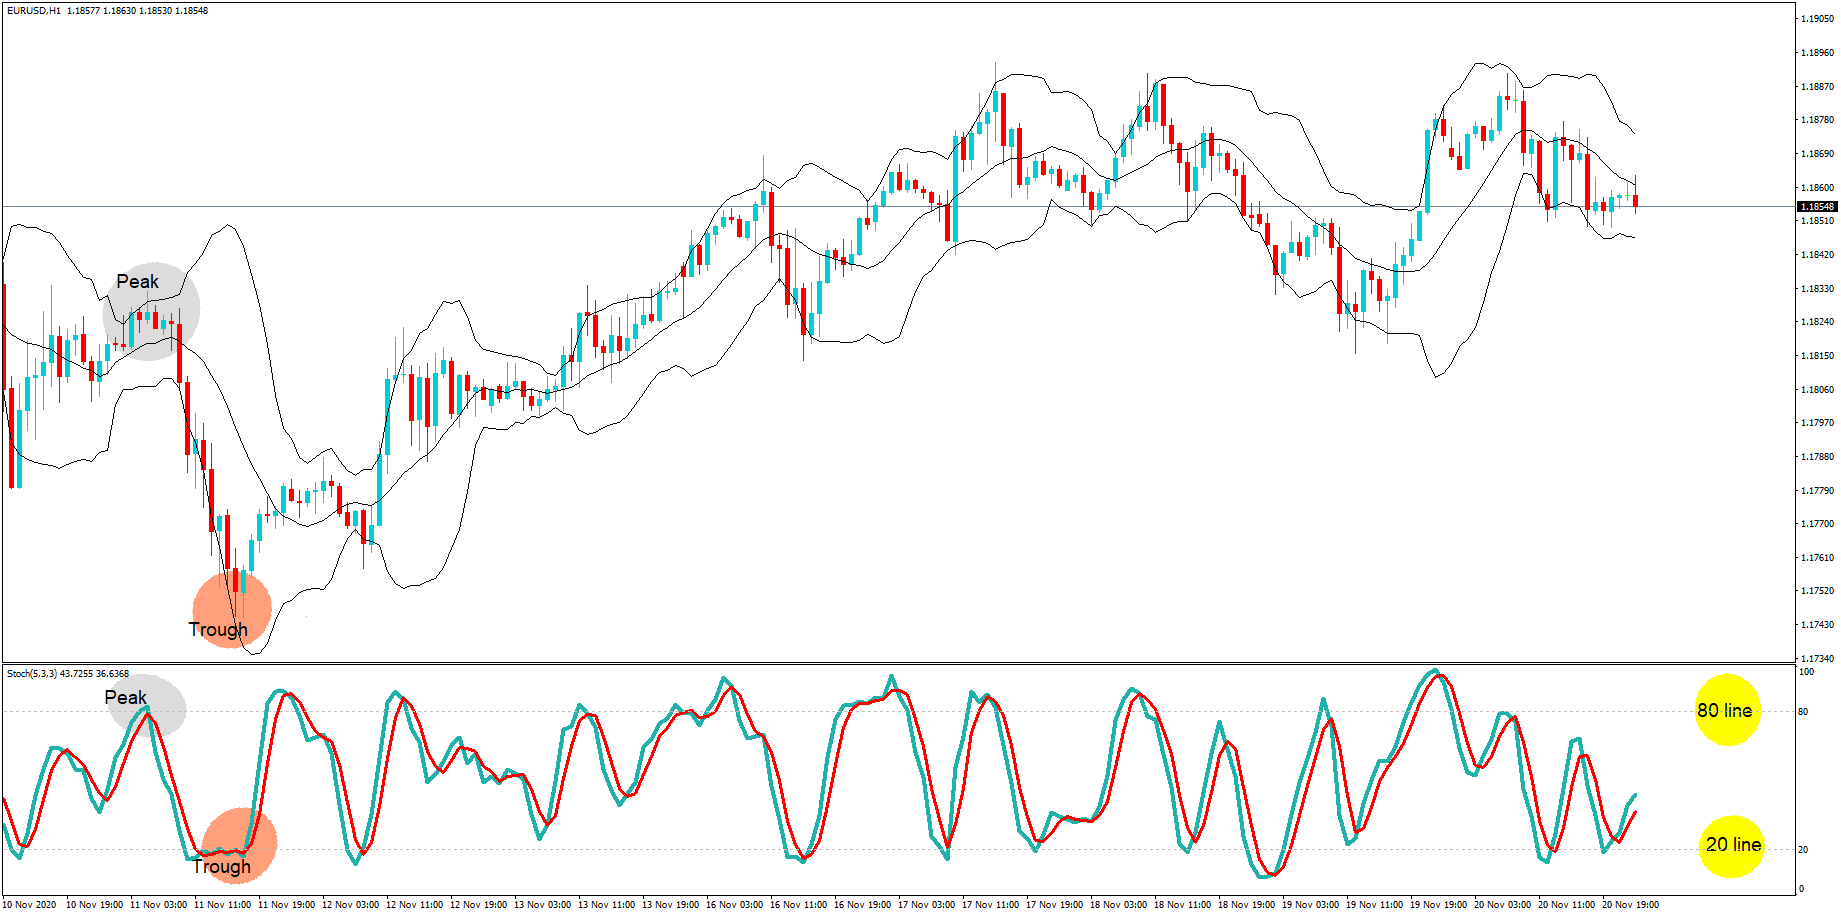
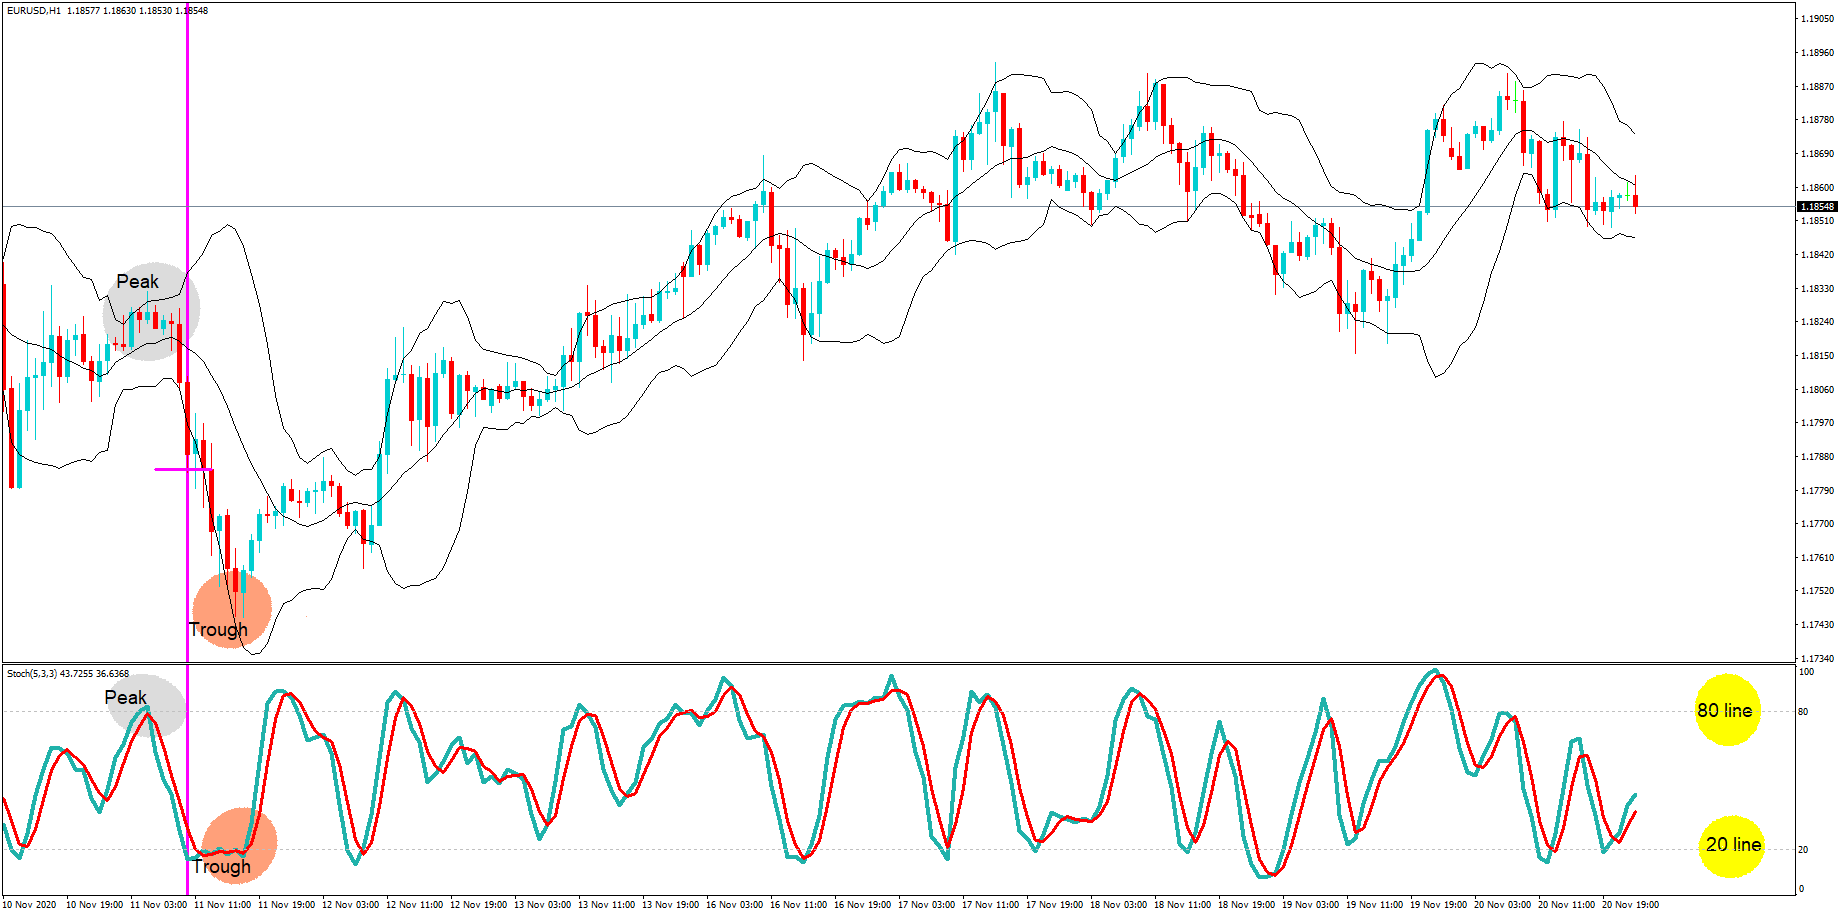
First of all, we have the stochastic oscillator.  This tool consists of two moving averages that crossover at certain points, and when they move up and cross the 80-line, an asset is said to be overbought, and when the moving averages move lower and under than the 20-line, it is said to be oversold.

One of the problems with the stochastic oscillator, as we can see here, if we draw a magenta coloured vertical line, the market is actually oversold at the halfway point between the peak and the trough of this move.  The pair continues to move lower after it is oversold. This is common with the stochastic.

…in this example, it has moved lower by a further 41 pips after showing as oversold, before price action eventually does turn around and move higher, and it is then when the stochastic begins to comply with the price action.

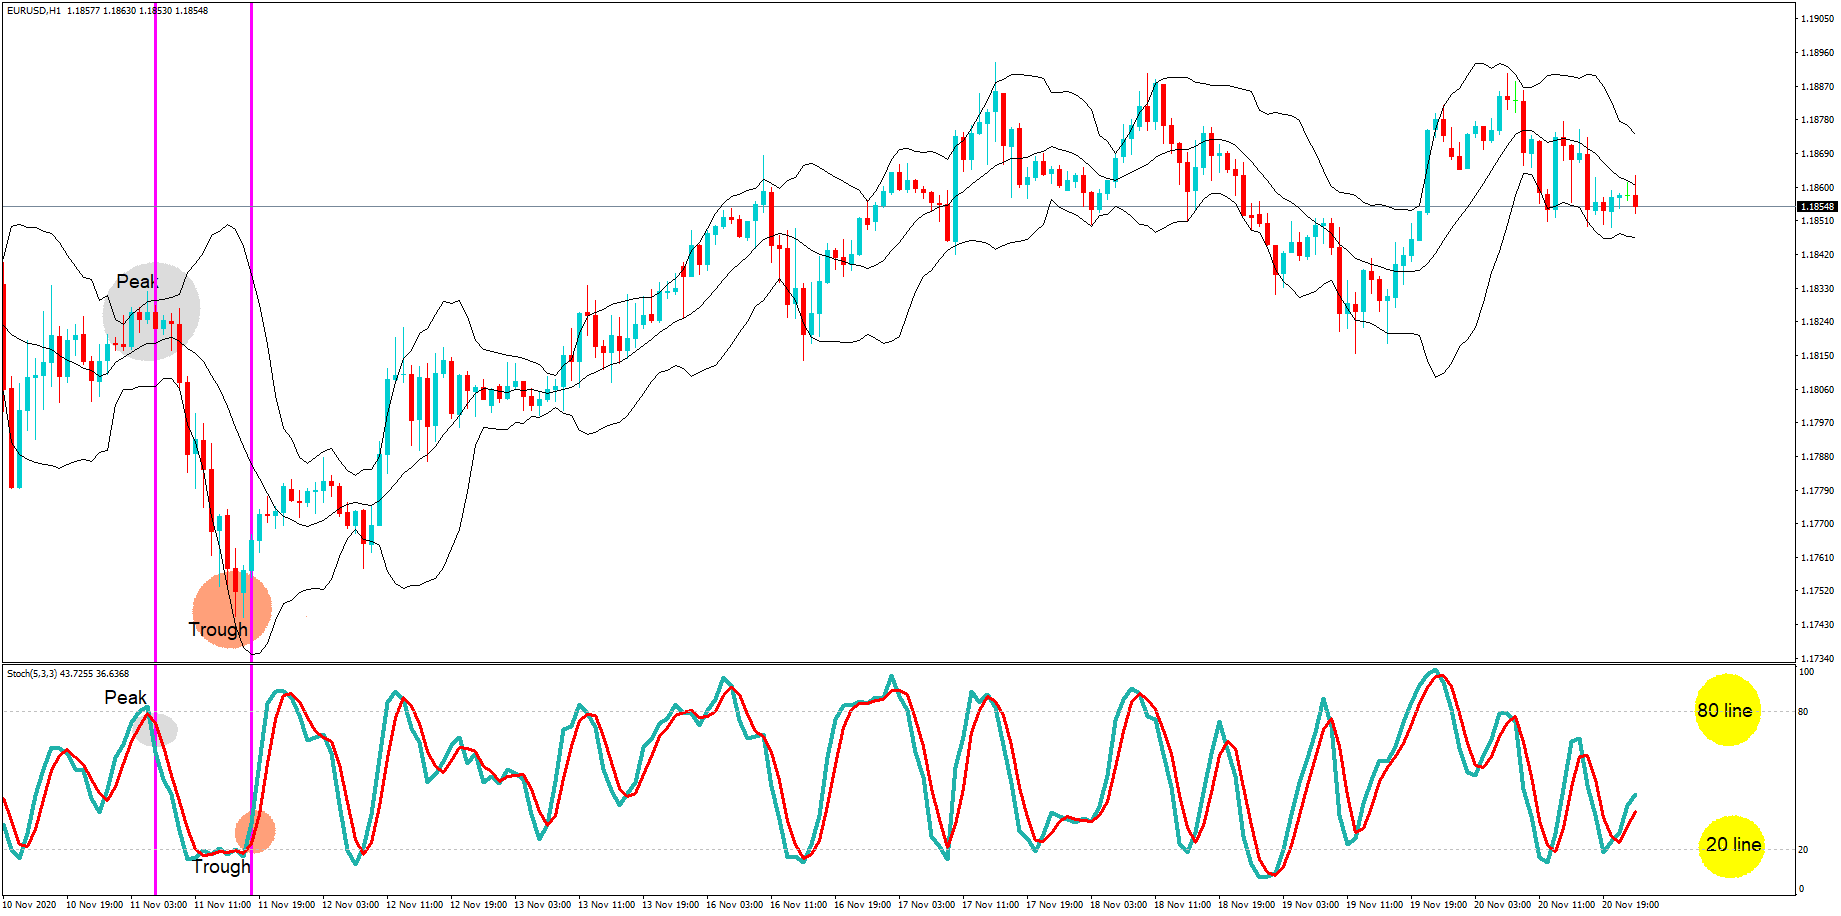
One way that professional traders will guard against using the stochastic oscillator to get into a trade too early is to wait until the indicator has gone above the 80 and its moving averages have crossed over and moved under the line before they enter a short trade, or have moved under the 20 line, crossed over, and moved up above the line before they will enter a long trade. 

Professional traders will very rarely use a single indicator such as the stochastic on its own to enter a trade.

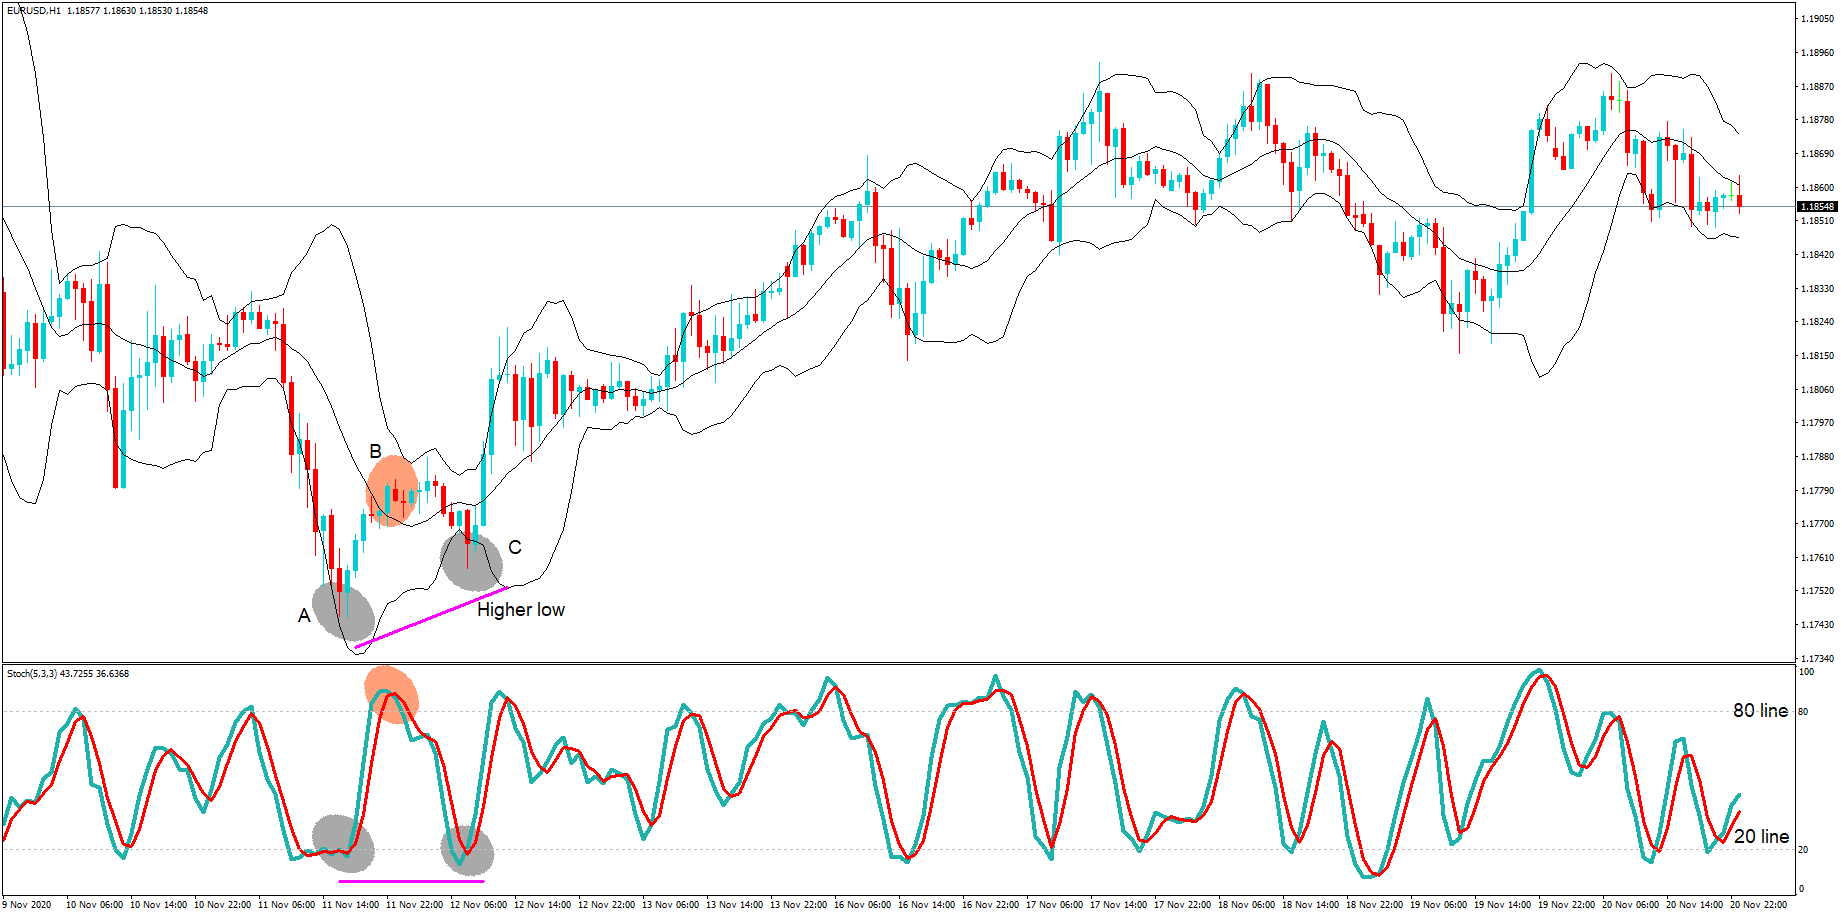
In this A B C scenario, we have more clues about potential future price direction.  First, we have the stochastic showing oversold at position A, and when price action reverts higher to position B, price action appears to stay inflated and ignores the stochastic, initially. However, when price moves lower at position C, we have a divergence in the stochastic and price action, where the stochastic has moved lower to the 20% line, and price action at position C has not moved lower to the level at position A. It has formed a higher low, and this is an indication in itself that price action may be fading to the downside, especially when coupled with the hesitation to move lower at position B, and whereby a bear candle spike outside of the Bollinger band at position C is another hint that price action may move back inside the bands, because, as you will probably know, 95% of price action will revert inside the Bollinger bands if it spikes outside.

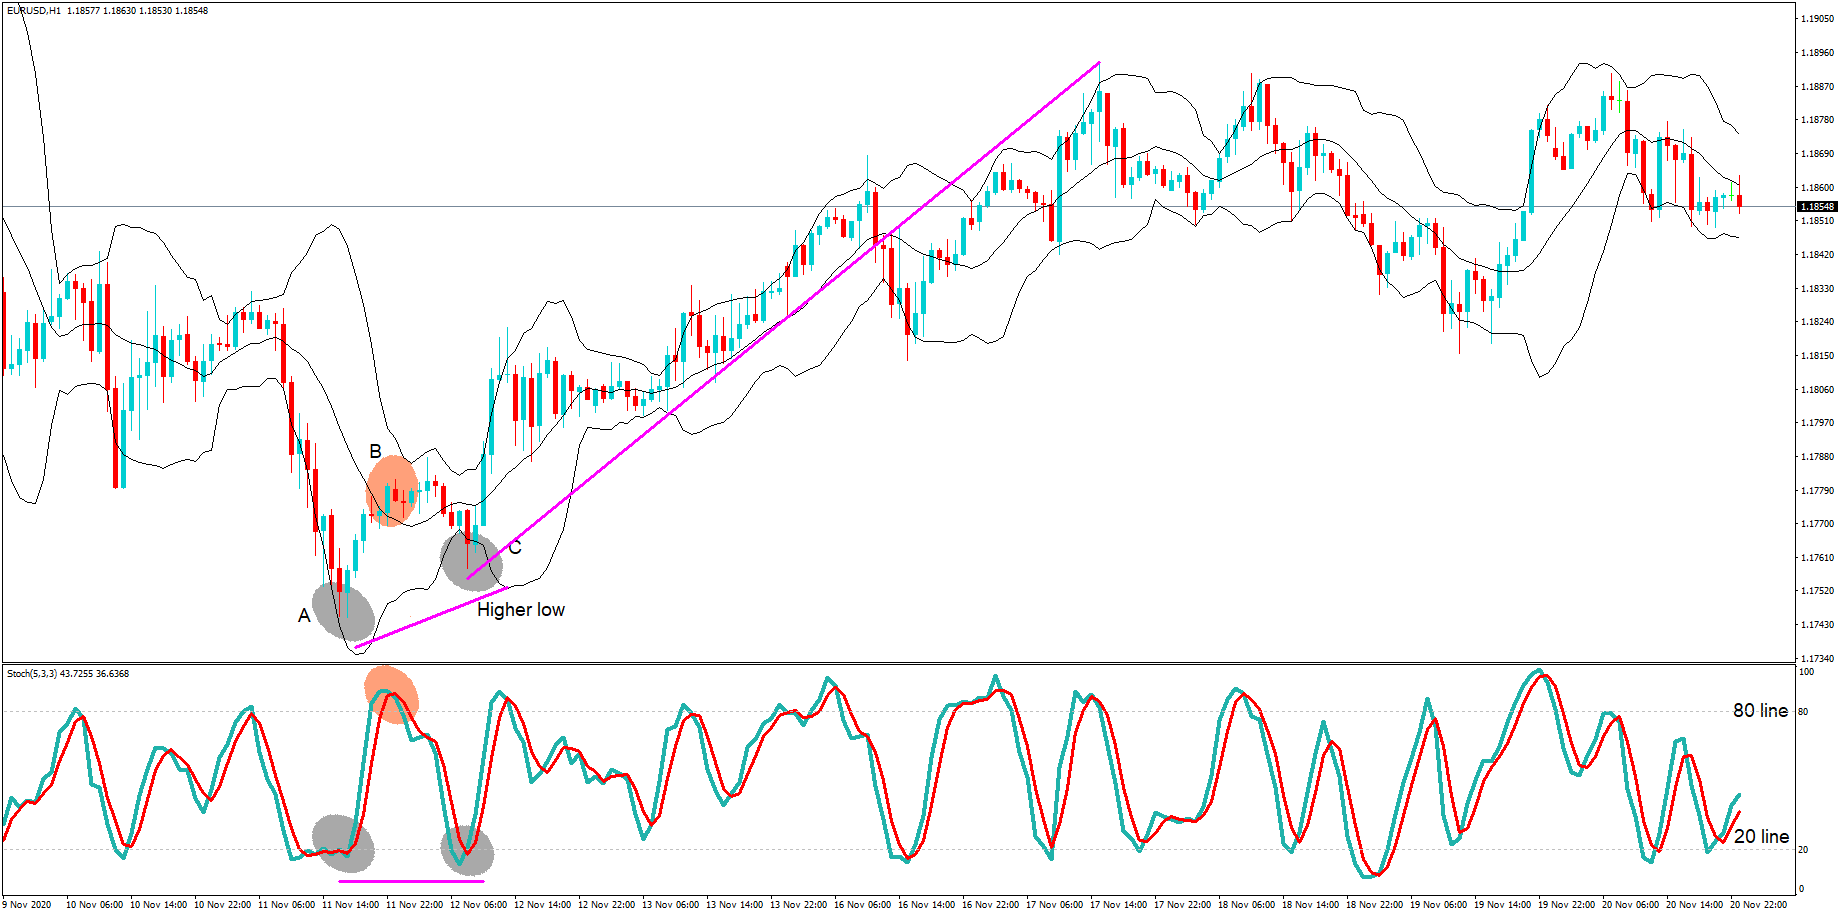
This setup, simply by using the stochastic to show oversold, where its moving averages have moved under the 20 line, then crossed over and moved higher than the 20-line, plus divergence in price action, and a higher low set up, and a candle spike outside the Bollinger bands has been the set up for this bull trade which saw 140 pips to the upside.

Simply look out for this setup in reverse to take on a bear trade.


Categories
Forex Basic Strategies Forex Daily Topic

Trading The Forex Market Like A Pro Using The Williams %R Indicator

Introduction

In the forex market, the Relative Strength Index (RSI) is the most sought after technical indicator for measuring overbought and oversold conditions in the market. However, there are times when RSI can give misleading signals. To overcome some of these limitations of RSI, we use William’s %R (Williams Percentage Range) to help us identify when an asset is oversold or overbought.

Having determined that the asset has moved too much in one direction, we can position ourselves on the other side of the market after suitable confirmation. In today’s article, let’s discuss a strategy based on William’s %R indicator to identify when the market has become overbought or oversold. Let us first get into the specifications of the strategy.

Time Frame

The strategy works well on higher time frames such as ‘Weekly’ and ‘Daily.’ Therefore, the strategy is suitable for swing and long-term traders.

Indicators

We use the following indicators in the strategy:

  • William’s %R
  • Simple Moving Average (standard setting)

Currency Pairs

The strategy applies to all currency pairs listed on the broker’s platform, including major, minor, and exotic pairs. This is one of the distinguishing features of the strategy.

Strategy Concept

The William’s %R indicator usually ranges between 0 to -100, where a reading of 0 to -20 tells us that the asset is overbought. On the other hand, if %R falls in the range of -80 and -100, the asset is said to be oversold. As with other technical indicators, %R generates accurate trading signals when used in conjunction with other analytical tools such as chart patterns and systems.

Just because an asset may appear overbought and oversold based on the %R, this doesn’t necessarily mean that the price will reverse. Hence, we include a few concepts of the chart pattern and price action to confirm that the reversal is real. The more we wait, the higher the confirmation. But this reduces the risk-to-reward (RR) ratio moderately. This depends more on the type of trader if he is more conservative or aggressive.

In the strategy, we firstly establish a trend that is mostly in the overbought or oversold situation. This means William’s %R should indicate an overbought situation of the market for a major part of the trend during an uptrend. On the other hand, in a downtrend, William’s %R should indicate an oversold market situation for a major part of the trend. When the trend remains in the overbought or oversold condition for most of the time, the reversal tends to be sharp in nature.

This is why the above condition is important for the strategy. Next, we wait for the ‘Bullish Engulfing’ pattern to appear on the price chart, in a reversal of a downtrend. Likewise, in a reversal of an uptrend, we wait for the ‘Bearish Engulfing’ pattern to appear on the chart. This is the first sign of reversal. The reversal is confirmed when the price starts moving above the moving average, in a downtrend, and below the moving average, in an uptrend.

Stop-loss for the trade will be placed below the ‘engulfing’ pattern in a ‘long’ position and above the ‘engulfing’ pattern in a ‘short’ position.

Trade Setup

In order to explain the strategy, we will be executing a ‘long’ trade in EUR/USD currency pair using the below-mentioned rules. Here are the steps to execute the strategy.

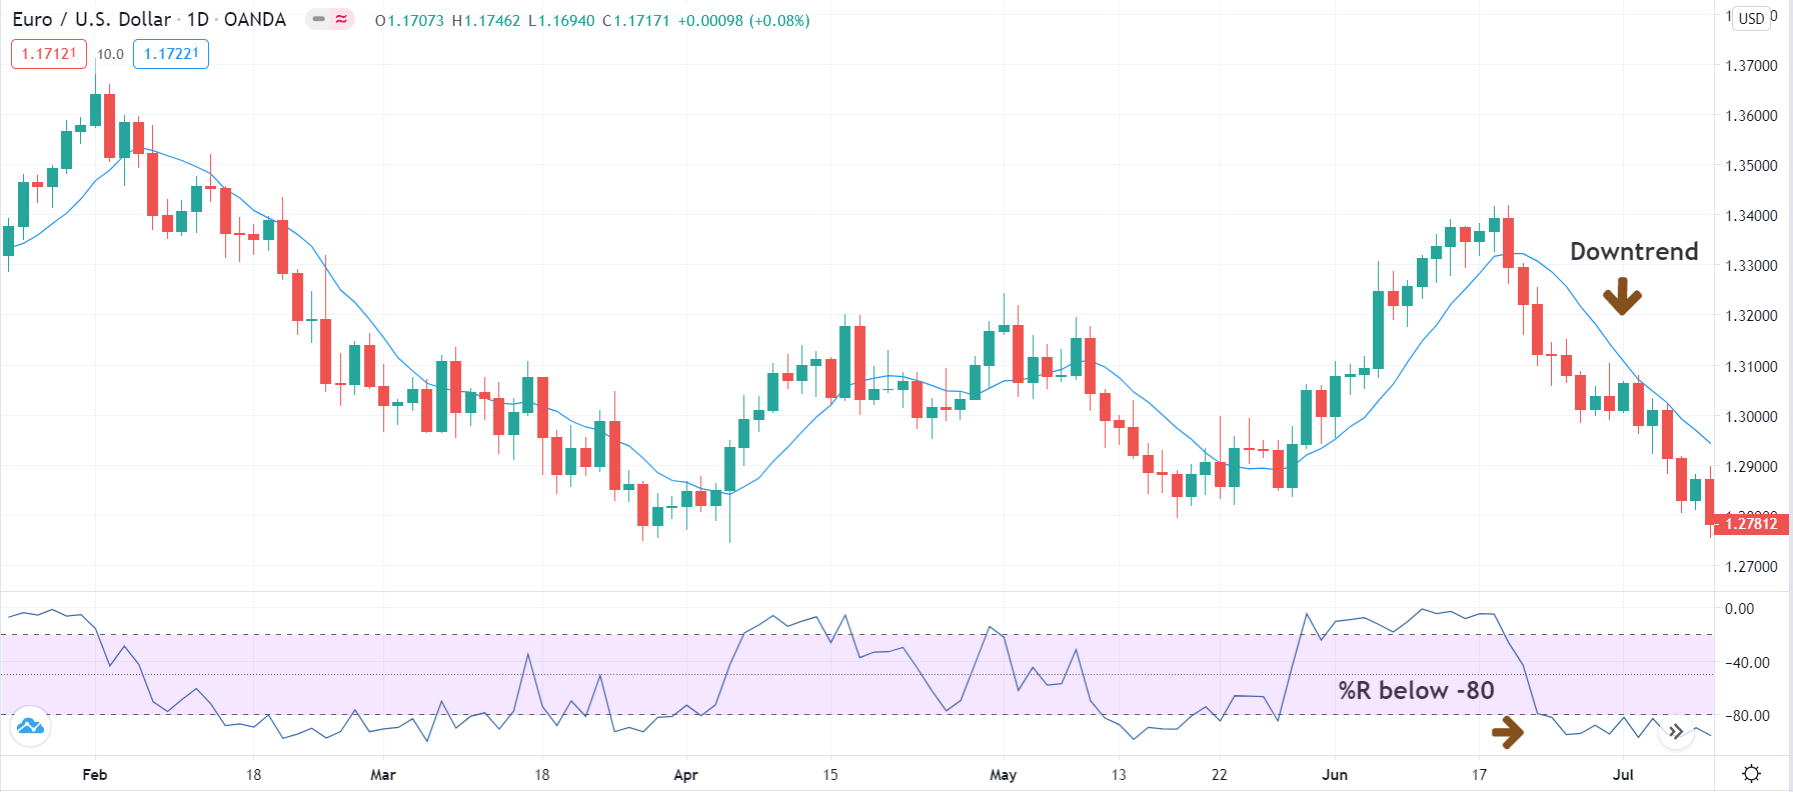
Step 1: The first step of the strategy is to identify the major trend of the trend. An easy to determine trend is if the price is below the simple moving average, the market is in a downtrend, and if the price is above the simple moving average, the market is in an uptrend. Here we need to make sure that William’s %R indicates an overbought/oversold market situation for the major part of the trend.

The below image shows an example of a downtrend that is oversold.
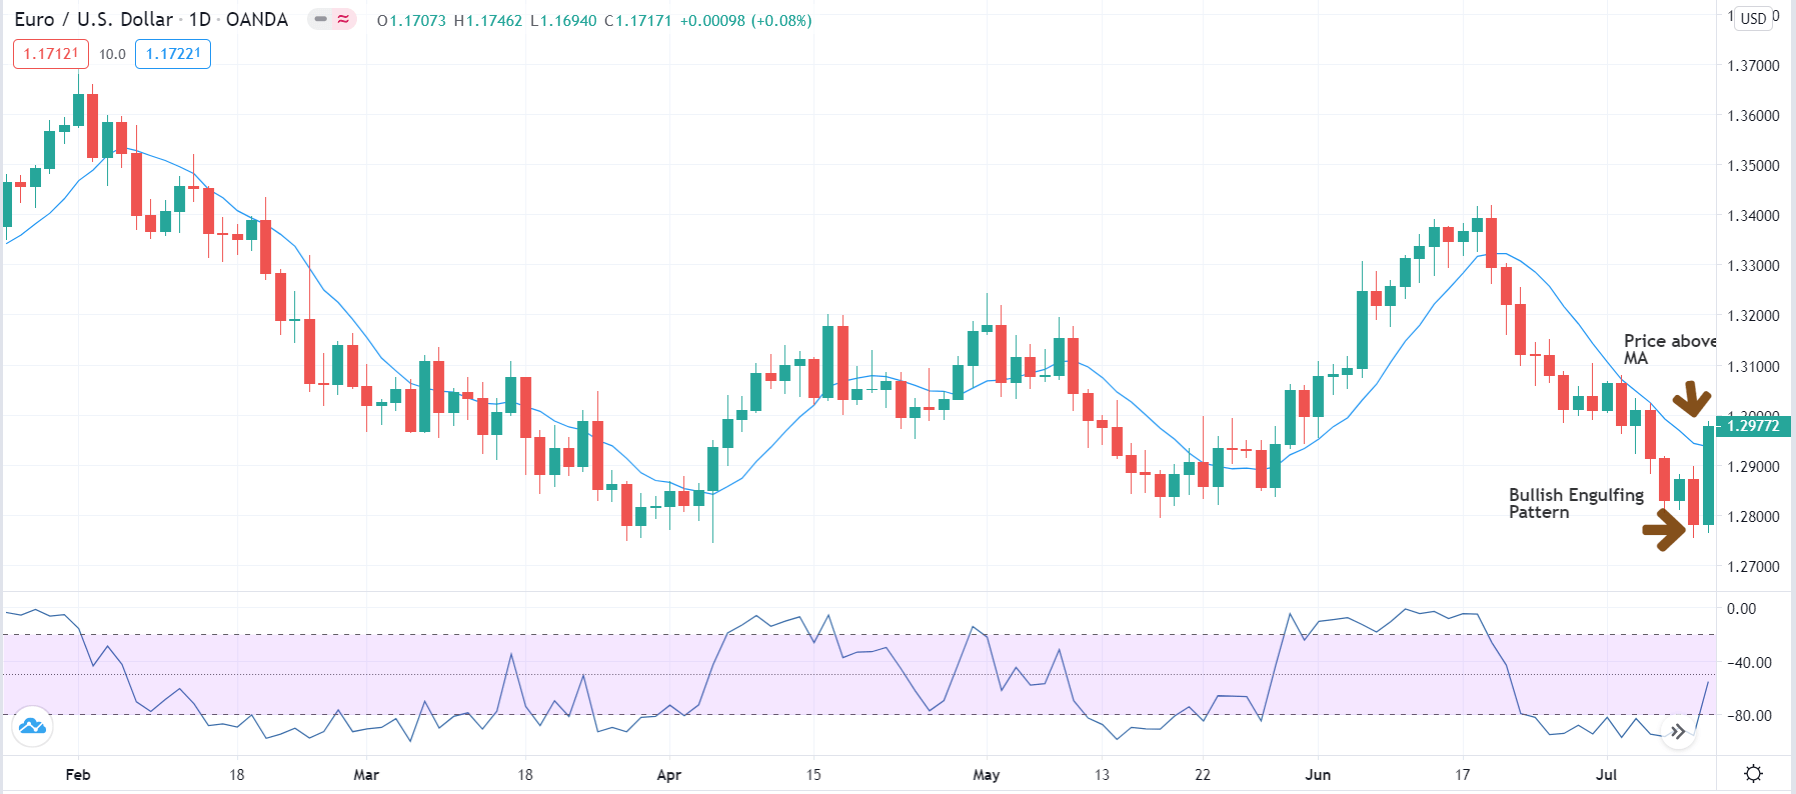
Step 2: The next step is to wait for the market to present the ‘Engulfing’ pattern on the chart. In a downtrend, the ‘Bullish Engulfing’ pattern indicates a reversal of the trend, while in an uptrend, the ‘Bearish Engulfing’ pattern indicates a reversal of the trend. If the second of the engulfing pattern closes above the MA in a reversal of the downtrend, the reversal will be more prominent. Similarly, if the second candle closes below the MA in a reversal of the uptrend, the reversal can be resilient.
Step 3: The rule of entering the trade is fairly simple. We enter ‘long’ when the price starts moving further above the moving average after the occurrence of an ‘engulfing’ pattern. Similarly, we enter ‘short’ when the price starts moving further below the moving average after the occurrence of the ‘engulfing’ pattern.

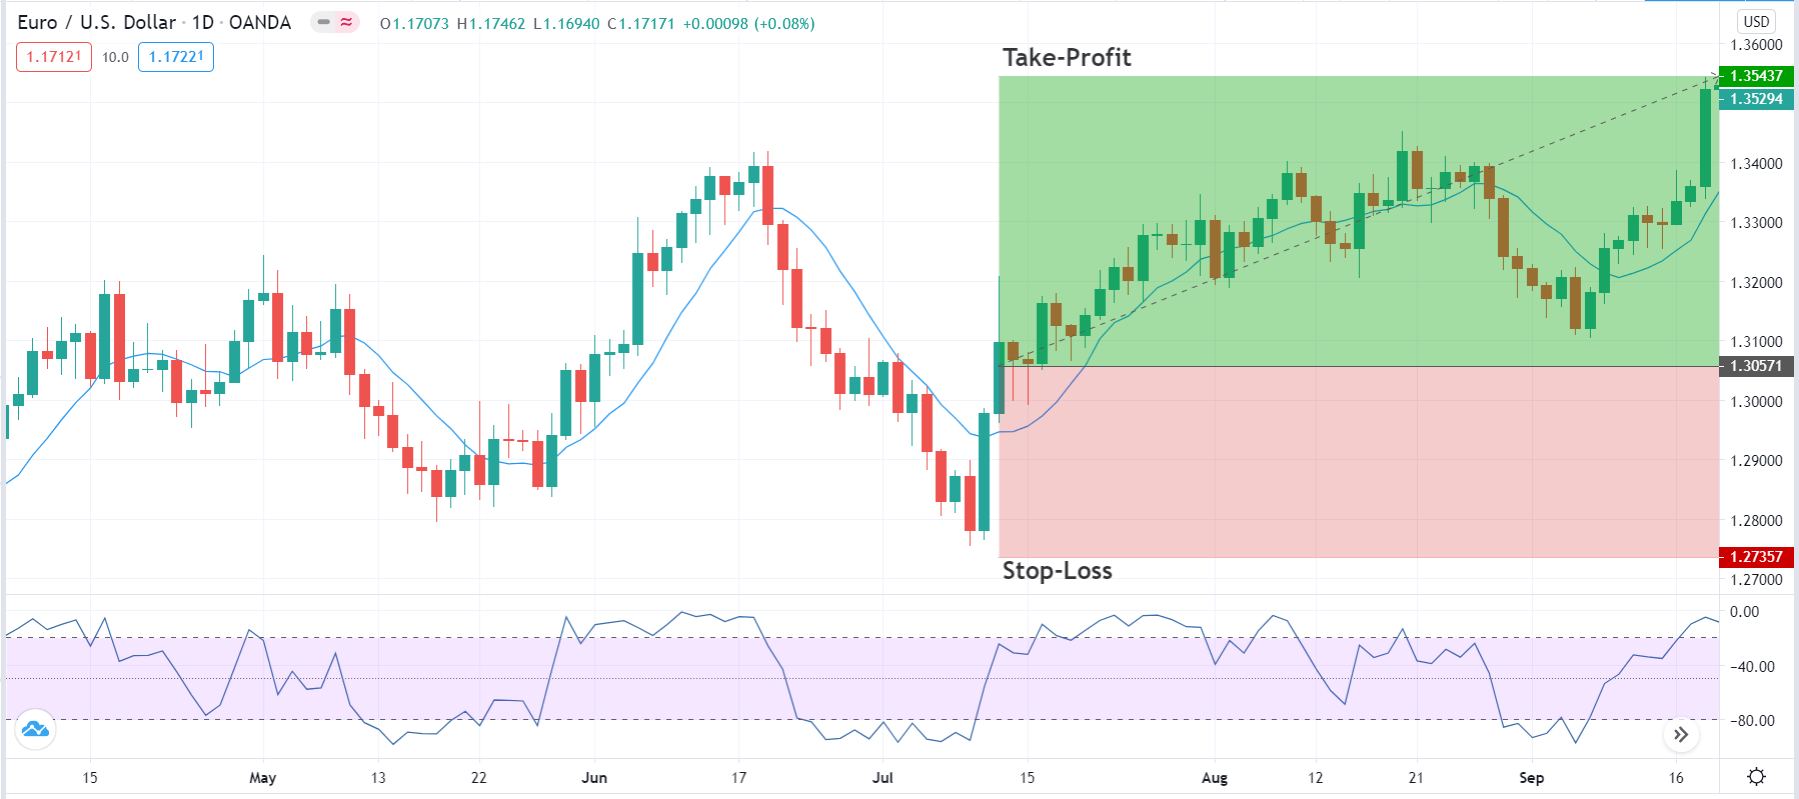
Step 4: Lastly, we need to determine the stop-loss and take-profit for the trade. In a ‘long’ position, stop-loss is placed below the ‘Bullish Engulfing’ pattern. In a ‘short’ position, it is placed above the ‘Bearish Engulfing’ pattern. The take-profit is set at a point where the resultant risk-to-reward (RR) ratio of the trade will be 1.5. However, partial profits can be taken at the opposing ‘support’ and ‘resistance’ levels that might be a hurdle for the price.

In our example, the risk-to-reward (RR) ratio of 1.5 was achieved after a period of one month since traded on the ‘Daily’ time frame.
Strategy Roundup

William’s %R is a very powerful indicator that helps us identify opportunities during a reversal phase of the market. It is important to note that %R should never be used in isolation. Combining the %R indicator with chart pattern, price action, and market trend gives us an edge in the market, which is difficult to get when applied individually. Trade executed using the above strategy can longer than expected to give desirable results since it is based on a higher time frame.

Categories
Forex Course

101. What Are Oscillators & How To Interpret Them?

Introduction

Technical Indicators are primarily used to confirm a price movement and the quality of a candlestick pattern, and also to create trading signals with them. Indicators are a great source of strength to confirm an existing analysis. Moreover, some indicators solely help in analyzing the trend, momentum, and volatility of the market.

As discussed previously discussed, there are two types of indicators, leading and lagging. And oscillators fall under the leading indicators. That is, they determine the trend of the market before-hand.

Indicator construction

There are two ways through which indicators are designed:

  1. Non-bounded
  2. Oscillators

Non-bounded, as the name suggests, they are the indicators that are not bound in a specific range. They usually display the strength and weaknesses, and to an extent, generates buy and sell signals.

Oscillators, on the other hand, are indicators that are bound within a range. For example, 0-100 is the range they oscillate between. However, based on the type of oscillator, the range varies.

Oscillators

Oscillators are technical indicators that are mainly used to determine the oversold and overbought conditions. These non-trending indicators are used when the market is not showing any certain trend in either direction. They are unlike the moving averages (MA), which determine the trend and overall direction of the market.

When security is under an overbought or oversold situation, the oscillators show its real value. It indicates that one of the parties is losing its strength, and the other is slowly starting to gain together.

Interpreting Oscillators

Oscillators are constructed with lower and upper bounds. And these bounds form a range. In the below oscillator, the purple region represents range-bound, where 30 is the lower bound, and 70 is the upper bound. The upper and lower bounds are also referred to as peaks and troughs. Typically, the peaks and troughs in the oscillator correspond to the peaks and troughs in the market as well.

Extreme Regions

The oversold and overbought regions are the extreme regions. That is, when the oscillator line shoots above the upper bound, the market is considered to be overbought. On the contrary, if the oscillator falls beneath the lower bound, the market is said to be overbought.

An overbought market means that the buying volume has diminished over a few trading days. So, there could be a possibility for investors to sell their positions. However, note that this interpretation holds true when the market was in a predominant uptrend and is currently consolidating.

An oversold market indicates that the selling volume, which was high in the past days, has now diminished. This could mean that the sellers are done selling with the security and might begin closing their positions. Hence, indicating a turn-around in the market.

Midpoint Line

A crossover at midpoint region of the range depicts the gain in strength of the buyer or sellers. From the oscillator given, 50 is the midpoint line. So, if the oscillators cross above the 50 mark, it indicates bullishness in the market. And if cuts below 50, it could indicate bearishness in the market.

This concludes the lesson oscillators. In the coming lessons, we shall discuss some strategies using a few oscillators. Stay tuned. Happy trading!

[wp_quiz id=”70529″]
Categories
Forex Course

84. RVI (Relative Vigor Index) & Related Trading Strategies

Introduction

The Relative Vigor Index is one of the most popular indicators in the technical trading community. ‘John Ehlers’ developed this indicator, and it belongs to the oscillator family. The RVI is typically used to determine the strength of a trend in any given instrument. In a rising market, we generally expect the closing price to be higher than the opening price. Likewise, in a downtrend, we expect the closing price of any instrument to be lower than the opening price.

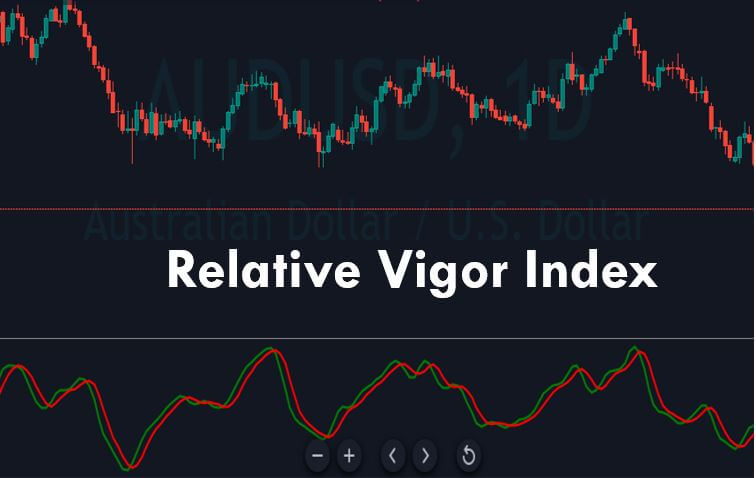
By comparing the opening price to its closing price, the RVI tries to gauge whether the trend is bullish or bearish. This predictive ability of the indicator makes it a leading indicator in the market. RVI consists of two lines, which are Green and Red in color. The Greenline is the standard moving average line, and the Redline is a 4-period volume weighted moving average. The Red is a trigger line as it provides the trading signal when it crosses above or below the Greenline.

Below how the price chart looks when the Relative Vigor Index is plotted on it.

Trading Strategies Using The RVI Indicator

A low value of the RVI indicates an oversold market, and when the RVI crosses above the signal line, it indicates a buying opportunity. Conversely, a high value indicates an overbought market, and the RVI crossing below the signal line indicates a selling opportunity.

Overbought and Oversold Crossovers

This is one of the basic and quite popular strategies using the RVI indicator. The trading opportunities that are generated in this strategy works well in all types of market conditions. The idea is to go long when the crossover happens at the oversold area and go short when the crossover happens at the overbought area. We must exit our positions when the indicator triggers an opposite signal.

As you can see in the below chart, we have generated a couple of trading opportunities in the USD/CAD Forex pair using the RVI indicator. We must follow all the rules of the strategy to generate an accurate trading signal. Place the stop-loss just below the closing of the recent candle and book the profit when the market gives an opposite signal.

Pairing RVI with RSI Indicator

In this strategy, we have paired the RVI indicator with the RSI indicator to identify accurate trading signals. Both of these indicators belong to the oscillator family, and when combined, they add great value. RSI indicator has only one line, which oscillates between the 70 to 30 levels. When it goes below the 30-level, it means that the market is oversold and above the 70 level means that the market is overbought.

Buy Example

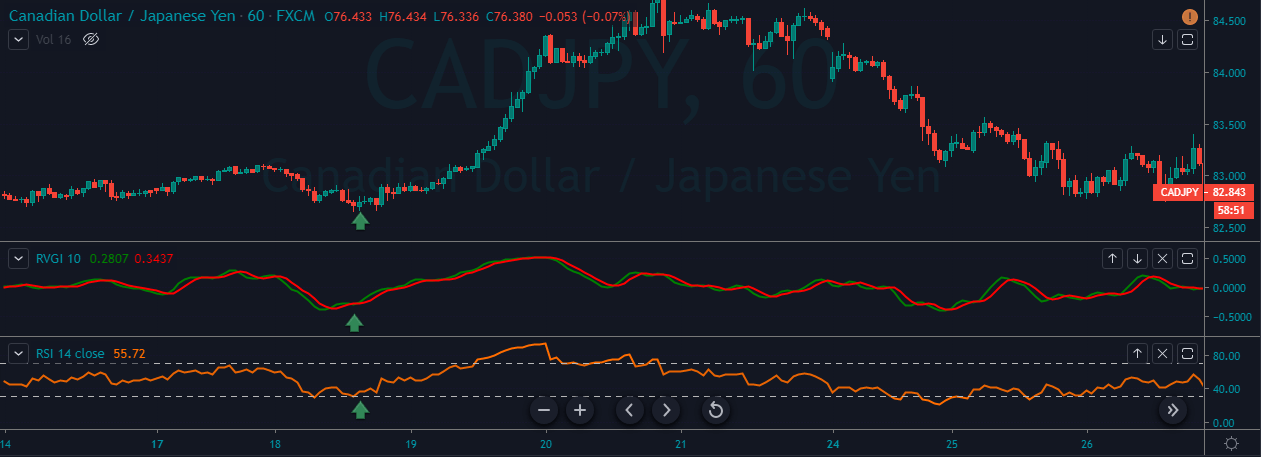
The idea is to go long when both the indicators give a crossover at the oversold area.

The below charts represent a buy signal generated by both of these indicators in the CAD/JPY Forex pair. When both of these indicators line up in one direction, that trade has a very high probability of performing in the anticipated direction, and we must look for deeper targets. In this kind of situation, we can even risk a bigger amount.

Sell Example

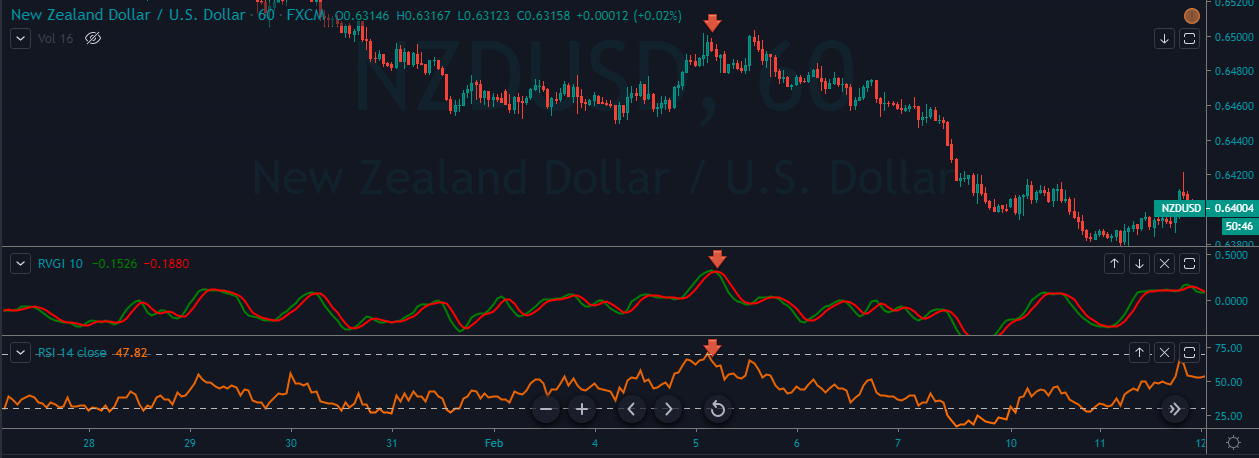
The idea is to go short when both the indicators give a crossover at the overbought area.

In the below chart, NZD/USD was in a downtrend. During the pullback, both the indicators aligned in one direction giving us a selling signal. Expect deeper targets and make sure to exit the position when any of the indicators gives an opposite signal at the oversold area.

That’s about the RVI and the trading strategies using this indicator. Try these strategies in a demo account to master them and only then use them in the live market. Cheers.

[wp_quiz id=”67178″]
Categories
Forex Course

81. Learn To Trade Using The ‘RSI’ Indicator

Introduction

In our previous article, we have learned how to trade the markets using the Bollinger Bands. We hope you have used that indicator in a demo account and got a hang of it. Now, in this course lesson, let’s learn the identification of trading opportunities using a reliable indicator know as RSI.

RSI is one of the most famous indicators used in the Forex and the Stock market. It stands for the ‘Relative Strength Index’ and is developed by an American technical analyst – J. Welles Wilder. This momentum indicator measures the magnitude of the price change to identify the oversold and overbought market conditions.

The RSI indicator consists of a line graph that oscillates between zero and 100 levels. Traditionally, the market is considered overbought when the indicator goes above the 70-level. Likewise, the market is considered oversold when RSI goes below the 30-level. These traditional levels can be adjusted according to different market situations. But if you are a novice trader, it is advisable to go with the default setting of the RSI.

When the market is in an overbought condition, it indicates a sell signal in the currency pair. Likewise, if the market is in an oversold condition, we can expect a reversal to the buy-side. To confirm the buy and sell signals generated by the oversold and overbought market conditions, it is advisable to also look for centerline crossovers.

When the RSI line goes above the 50-level, it means that the strength of the uptrend is increasing, and it is safe to hold our positions up to the 70-level. When the centerline goes below the 50-level, it indicates the weakening in strength and any open sell position until the 30-level is good to hold.

RSI is one of those indicators which is not overlapped with the price action. It stays below the price charts. Below we can see the snippet of how the RSI would look on the charts. The highlighted light purple region marks the 70 and 30 levels, and the moving line in the middle is the RSI line.

How To Trade Using The RSI Indicator

There are various ways to use the RSI indicator to generate consistent signals from the market. You can use this indicator stand-alone, or you can pair it with other indicators and with candlestick patterns for additional confirmation. In this article, let’s learn the traditional way of using the RSI indicator along with RSI divergence and RSI trendline breakout strategies.

Traditional Overbought/Oversold Strategy

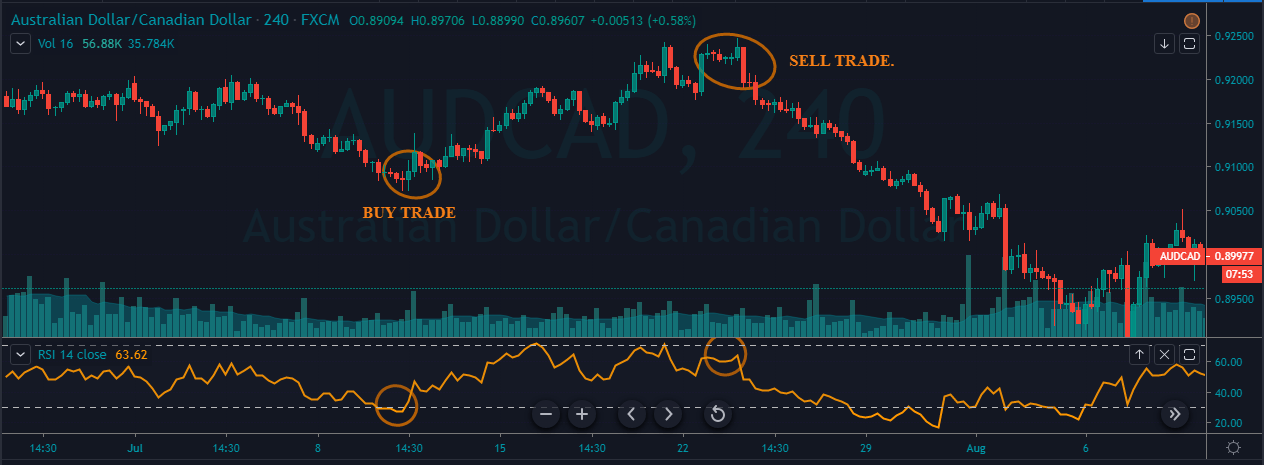
In the traditional way, we just hit the Buy when the RSI indicator gives sharp reversal at the oversold area. Contrarily, we go short when the RSI indicator reverses at the overbought area. The image below represents the Buy and Sell trade in the AUD/CAD Forex pair. We must close our positions when the market triggers the opposite signal. Stop-loss can be placed just below the close of the recent candle.

RSI Divergence Strategy

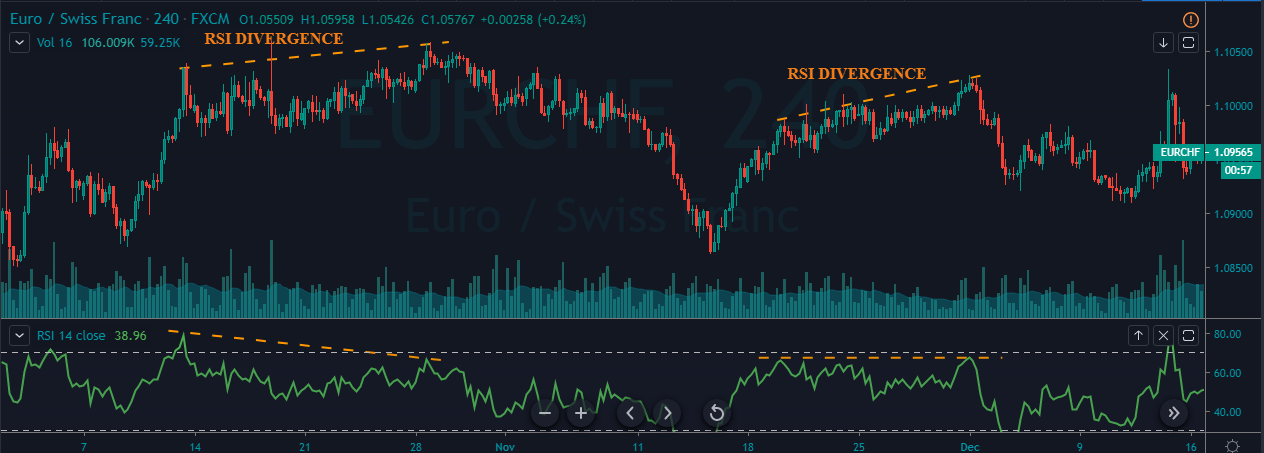
Divergence is when the price action moves into one direction, and the indicator moves in another direction. It essentially means that the indicator does not agree with the price move, and soon a reversal is expected. In other words, RSI divergence is known as a trend reversal indication.

In the below image, price action prints the RSI divergence twice, and both times the market reversed to the opposite side. When the market gives us a reversal, find any candlestick pattern or any reliable indicator to confirm the trading signal generated.

In the below image, we have identified the market divergence twice, and both the times the market reversed. If traded correctly, this strategy will result in high profitable trades.

Trendline Breakout Strategy

RSI trend line breaks out is a quite popular strategy as it is used by most of the professional traders. In the image below, when price action and the RSI indicator breaks the trend line, we can see the market blasting to the north.

Always remember to strictly go long in an uptrend, and go short in a downtrend while using this strategy. Buying must be done when the market is in an overbought condition, and the selling must be done when the market is in an oversold condition.

If you want to confirm the entry, wait for the price action to hold above the breakout line to know that the breakout is valid. Exit your positions when the RSI reaches the opposite market condition.

That’s about RSI and trading strategies using this indicator. Try using this indicator on a demo account today and experiment with the above-given strategies. Let us know if you have any questions in the comments below. Cheers!

[wp_quiz id=”66690″]
Categories
Forex Basic Strategies

The Most Simple Scalping Strategy To Trade The Forex Market!

What is Scalping?

Scalping is one of the trading styles in the forex market, which is gaining popularity with the emergence of artificial intelligence and automated trading systems. Nowadays, there are a set of traders who enjoy scalping than day trading, swing trading, or position trading.

The main difference between scalping and other styles of trading is that in scalping, the trading time frame is very short and face-paced. The holding period does not last more than a few minutes, whereas ‘positional’ traders hold their trades from 1-Hour to few weeks. Scalpers find trading opportunities on very short timeframes such as the 1-Minute and 3-Minutes.

Impulsive traders are the ones who are most attracted to scalping, as they don’t want to wait for a trade to set up on the higher time frame. Sadly, new traders fall into this trap and start scalping the market, totally unaware of the risk it carries.

To scalp, a trader needs to be experienced. We recommend first being consistently profitable on the higher time frame or swing trading and then move on to scalping. Because this form of trading is extremely difficult as it requires a trader to make decisions in mere seconds or minutes.

5-Minute Scalping Strategy

In this section, we’ll cover a simple yet very effective scalping strategy on the 5-minute timeframe. The most suitable time to implement this strategy is during volatile market conditions. This means the best results are obtained during the New York-London session overlap (8:00 AM to 12:00 PM EST). During this time, trading costs are also relatively low, and liquidity is high, which is essential for the scalpers to take a trade.
We will be using two exponential moving averages in this strategy. Below are the indicators that one needs to apply to their charts.

  • 50-Period exponential moving average
  • 200-Period exponential moving average
  • Stochastic indicator

The Strategy

Let us look at the detailed steps involved in the 5-minute scalping strategy.

Step 1️⃣ – Identify the current trend

The two EMAs are used to indicate the trend in the 5-minute chart. To identify the larger trend, a trader will have to change the time frame to 15-minutes. Identifying the bigger trend is crucial to understand the overall direction of the market. The 50-period EMA is much faster than the 200-period EMA, which means it reacts to price changes more quickly.

If a faster (50-period) EMA crosses above the slower EMA (200-period), it means the prices are starting to rise, and the uptrend is more likely to be established. Similarly, a cross of faster EMA below the slower EMA indicates a drop in the price, and that also means a downtrend is about to form. Always make sure to take trades in the direction of the major trend.

Step 2️⃣ – Look for a pullback

Once we determine the current trend on the 5-minute chart based on EMA’s, it is time to wait for a pullback and stabilization of the price. This is one of the most important steps in this strategy as prices tend to make false moves after strong ups or downs. By waiting for the pullbacks, we can prevent ourselves from entering long or short positions too early.

Step 3️⃣ – Confirmation with the Stochastic Indicator

Finally, the Stochastic indicator gives the confirmation signal and helps us to take only highly-profitable trades. A reading above 80 indicates that the recent up move was strong, and a down move can be expected at any time. This is referred to as the overbought market condition. Whereas, a reading below 20 indicates that the recent down move was strong, and an up move is about to come. This market condition is referred to as the oversold market condition. After a pullback to the EMA’s, the Stochastic Indicator’s final confirmation gives us the perfect trade entry.

Let us understand this strategy better with the help of an example.

Chart-1

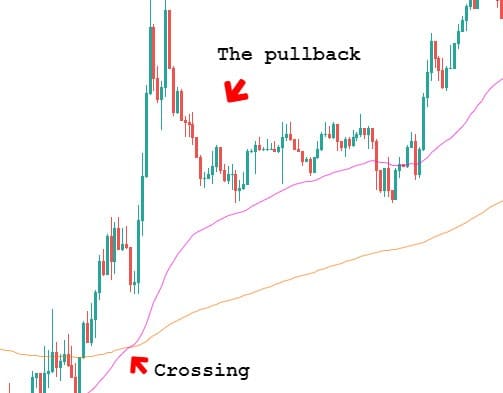
The above figure is a 5-minute chart of a currency pair, and the 200-period EMA is represented by the orange line while the 50-period EMA is represented by the pink line. The cross of the pink line above the orange line signals that the currency pair is entering into an uptrend on the 5-minute chart. As long as the faster EMA remains above the slower EMA, we’ll only look for buying opportunities. This step is to identify the direction and crossing of the two EMAs.

Chart-2

A trader shouldn’t be going ‘long’ as soon as they see the lines crossing. They should always wait for the pullback and only then take an entry. In ‘chart-2’, when we move further, we were getting the kind of pullback that we exactly need.

The next question is, at which point to buy?

Chart-3

The Stochastic plotted in the above chart helps in giving us the perfect entry points by getting into the oversold area. One can take a risk-free entry after all the indicators support the direction of the market.

Chart-4
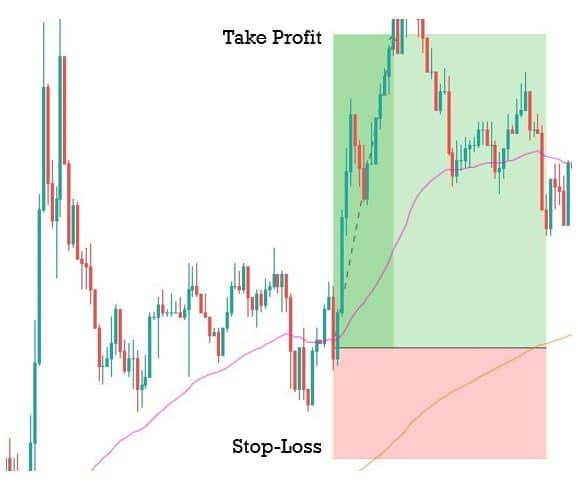
Finally, the trade would look something like this (chart-4). The risk to reward ratio (RRR) of this trade is 2:5, which is very good. Also, make sure to place precise stop-loss and take profit orders, as shown above.

Final words

Scalping is a faced-paced way of trading that is preferred by a lot of traders these days. The main difference between scalping and other styles of trading is the timeframes involved in analyzing the market. This type of trading carries certain risks that are unavoidable, such as high trading costs and market noise, which can impact your profits. We hope you find this article informative. Let us know if you have any questions below. Cheers!