Introduction
The Relative Vigor Index is one of the most popular indicators in the technical trading community. ‘John Ehlers’ developed this indicator, and it belongs to the oscillator family. The RVI is typically used to determine the strength of a trend in any given instrument. In a rising market, we generally expect the closing price to be higher than the opening price. Likewise, in a downtrend, we expect the closing price of any instrument to be lower than the opening price.
By comparing the opening price to its closing price, the RVI tries to gauge whether the trend is bullish or bearish. This predictive ability of the indicator makes it a leading indicator in the market. RVI consists of two lines, which are Green and Red in color. The Greenline is the standard moving average line, and the Redline is a 4-period volume weighted moving average. The Red is a trigger line as it provides the trading signal when it crosses above or below the Greenline.
Below how the price chart looks when the Relative Vigor Index is plotted on it.

Trading Strategies Using The RVI Indicator
A low value of the RVI indicates an oversold market, and when the RVI crosses above the signal line, it indicates a buying opportunity. Conversely, a high value indicates an overbought market, and the RVI crossing below the signal line indicates a selling opportunity.
Overbought and Oversold Crossovers
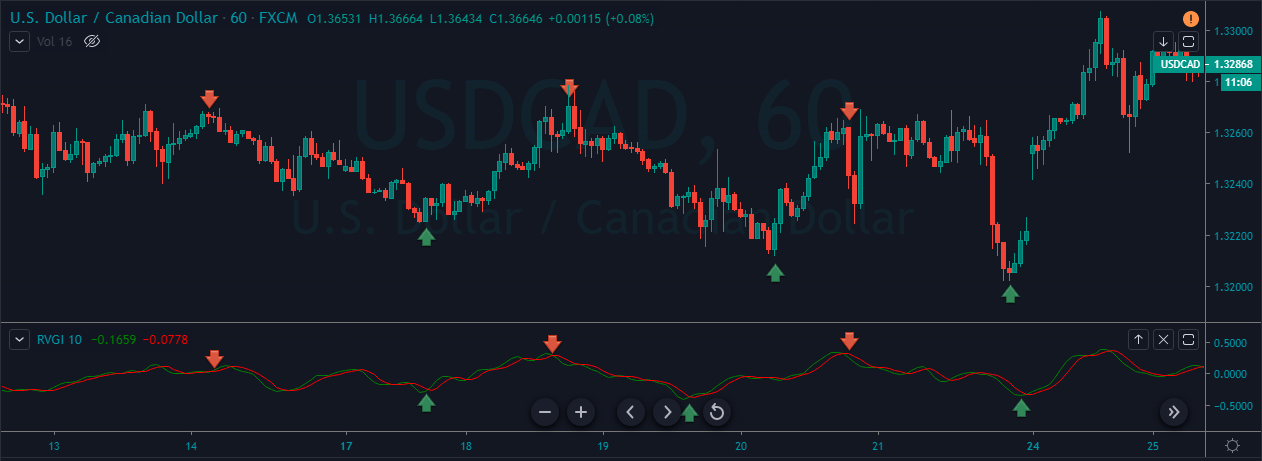
This is one of the basic and quite popular strategies using the RVI indicator. The trading opportunities that are generated in this strategy works well in all types of market conditions. The idea is to go long when the crossover happens at the oversold area and go short when the crossover happens at the overbought area. We must exit our positions when the indicator triggers an opposite signal.
As you can see in the below chart, we have generated a couple of trading opportunities in the USD/CAD Forex pair using the RVI indicator. We must follow all the rules of the strategy to generate an accurate trading signal. Place the stop-loss just below the closing of the recent candle and book the profit when the market gives an opposite signal.
Pairing RVI with RSI Indicator
In this strategy, we have paired the RVI indicator with the RSI indicator to identify accurate trading signals. Both of these indicators belong to the oscillator family, and when combined, they add great value. RSI indicator has only one line, which oscillates between the 70 to 30 levels. When it goes below the 30-level, it means that the market is oversold and above the 70 level means that the market is overbought.
Buy Example
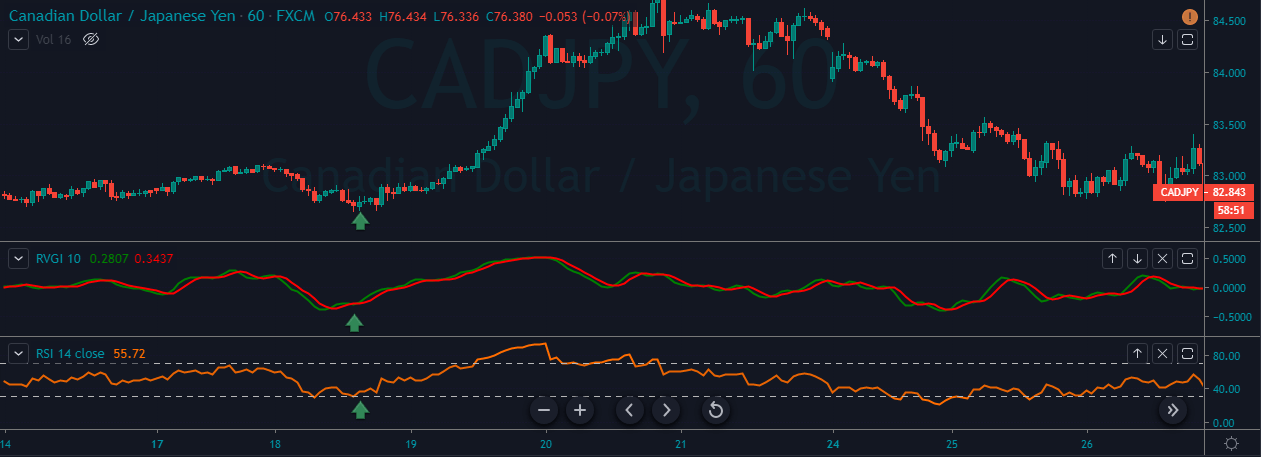
The idea is to go long when both the indicators give a crossover at the oversold area.
The below charts represent a buy signal generated by both of these indicators in the CAD/JPY Forex pair. When both of these indicators line up in one direction, that trade has a very high probability of performing in the anticipated direction, and we must look for deeper targets. In this kind of situation, we can even risk a bigger amount.
Sell Example
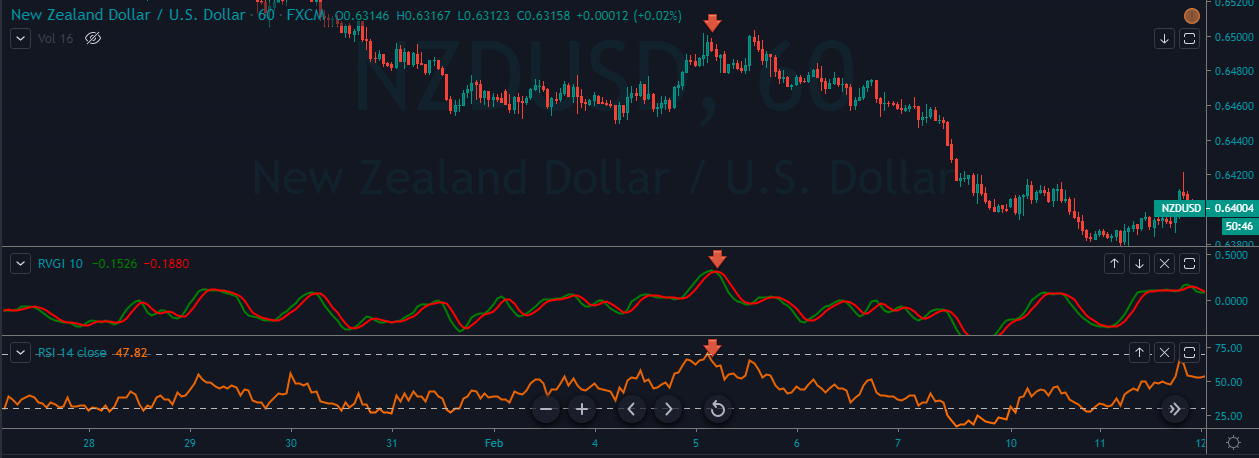
The idea is to go short when both the indicators give a crossover at the overbought area.
In the below chart, NZD/USD was in a downtrend. During the pullback, both the indicators aligned in one direction giving us a selling signal. Expect deeper targets and make sure to exit the position when any of the indicators gives an opposite signal at the oversold area.
That’s about the RVI and the trading strategies using this indicator. Try these strategies in a demo account to master them and only then use them in the live market. Cheers.
[wp_quiz id=”67178″]