Introduction
In our previous article, we have learned how to trade the markets using the Bollinger Bands. We hope you have used that indicator in a demo account and got a hang of it. Now, in this course lesson, let’s learn the identification of trading opportunities using a reliable indicator know as RSI.
RSI is one of the most famous indicators used in the Forex and the Stock market. It stands for the ‘Relative Strength Index’ and is developed by an American technical analyst – J. Welles Wilder. This momentum indicator measures the magnitude of the price change to identify the oversold and overbought market conditions.
The RSI indicator consists of a line graph that oscillates between zero and 100 levels. Traditionally, the market is considered overbought when the indicator goes above the 70-level. Likewise, the market is considered oversold when RSI goes below the 30-level. These traditional levels can be adjusted according to different market situations. But if you are a novice trader, it is advisable to go with the default setting of the RSI.
When the market is in an overbought condition, it indicates a sell signal in the currency pair. Likewise, if the market is in an oversold condition, we can expect a reversal to the buy-side. To confirm the buy and sell signals generated by the oversold and overbought market conditions, it is advisable to also look for centerline crossovers.
When the RSI line goes above the 50-level, it means that the strength of the uptrend is increasing, and it is safe to hold our positions up to the 70-level. When the centerline goes below the 50-level, it indicates the weakening in strength and any open sell position until the 30-level is good to hold.
RSI is one of those indicators which is not overlapped with the price action. It stays below the price charts. Below we can see the snippet of how the RSI would look on the charts. The highlighted light purple region marks the 70 and 30 levels, and the moving line in the middle is the RSI line.

How To Trade Using The RSI Indicator
There are various ways to use the RSI indicator to generate consistent signals from the market. You can use this indicator stand-alone, or you can pair it with other indicators and with candlestick patterns for additional confirmation. In this article, let’s learn the traditional way of using the RSI indicator along with RSI divergence and RSI trendline breakout strategies.
Traditional Overbought/Oversold Strategy
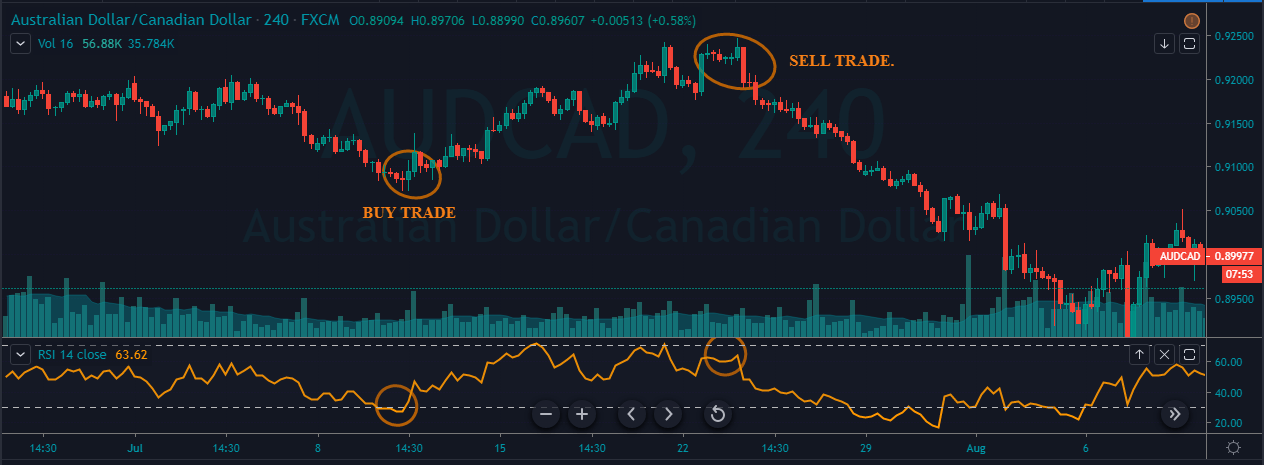
In the traditional way, we just hit the Buy when the RSI indicator gives sharp reversal at the oversold area. Contrarily, we go short when the RSI indicator reverses at the overbought area. The image below represents the Buy and Sell trade in the AUD/CAD Forex pair. We must close our positions when the market triggers the opposite signal. Stop-loss can be placed just below the close of the recent candle.
RSI Divergence Strategy
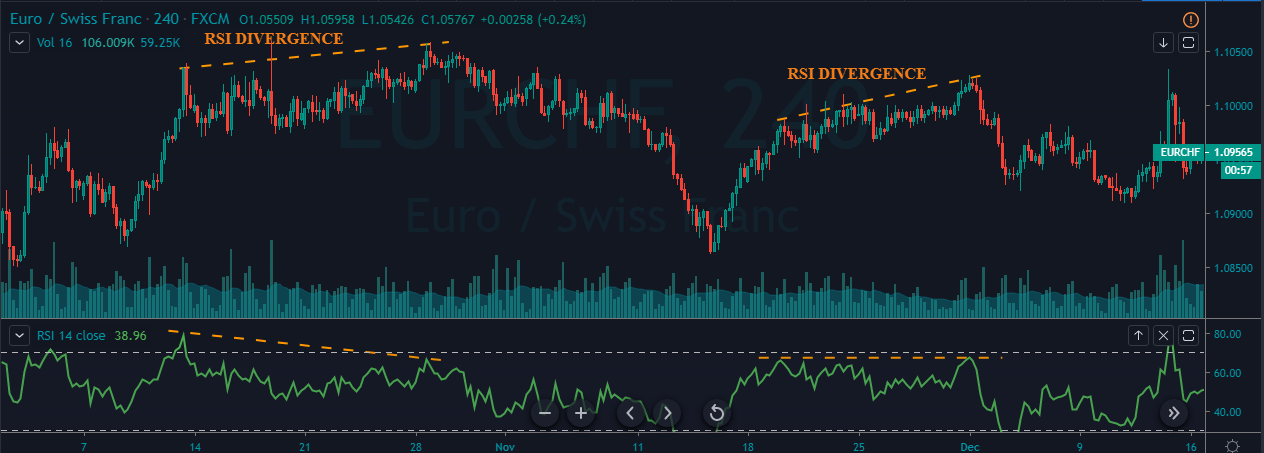
Divergence is when the price action moves into one direction, and the indicator moves in another direction. It essentially means that the indicator does not agree with the price move, and soon a reversal is expected. In other words, RSI divergence is known as a trend reversal indication.
In the below image, price action prints the RSI divergence twice, and both times the market reversed to the opposite side. When the market gives us a reversal, find any candlestick pattern or any reliable indicator to confirm the trading signal generated.
In the below image, we have identified the market divergence twice, and both the times the market reversed. If traded correctly, this strategy will result in high profitable trades.
Trendline Breakout Strategy
RSI trend line breaks out is a quite popular strategy as it is used by most of the professional traders. In the image below, when price action and the RSI indicator breaks the trend line, we can see the market blasting to the north.
Always remember to strictly go long in an uptrend, and go short in a downtrend while using this strategy. Buying must be done when the market is in an overbought condition, and the selling must be done when the market is in an oversold condition.
If you want to confirm the entry, wait for the price action to hold above the breakout line to know that the breakout is valid. Exit your positions when the RSI reaches the opposite market condition.
That’s about RSI and trading strategies using this indicator. Try using this indicator on a demo account today and experiment with the above-given strategies. Let us know if you have any questions in the comments below. Cheers! [wp_quiz id=”66690″]

