Categories
Forex Indicators

RSI: The Best Forex Indicator?

Far from being something that will help you operate profitably, the usual use of Forex indicators really causes more losses than gains among inexperienced traders. However, if you are going to use them, then you should know that the best Forex indicator is the RSI (Relative Strength Index).

What is the RSI (Relative Strength Index)?

The RSI reflects the momentum and it is well known that following the momentum in the foreign exchange market increases the chances of profits. The RSI is an indicator of momentum in the Forex market and, in fact, it is the best indicator of momentum. If you are willing to use the RSI, probably the best way to use it is to go long when it is above 50 in all time frames, and operate short if it is below 50 in all time frames. It is best to always operate with the trend of the last 10 weeks or so. The formula of the relative strength index was created in the 70s, as were many other concepts of technical analysis. 

Relative Strength Index – Forex Indicators

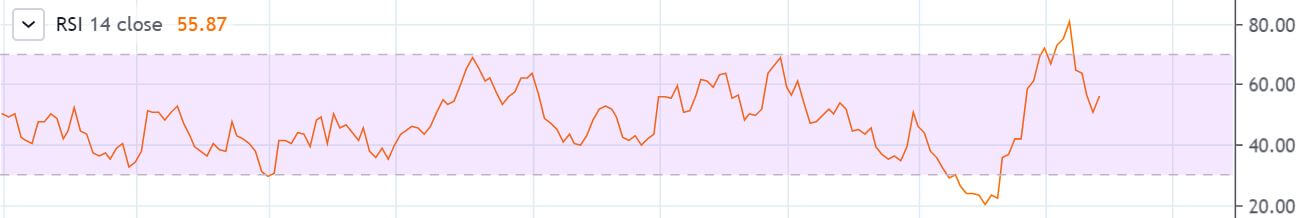
The calculation of the relative force is performed by calculating the ratio of upward changes per unit of time to downward changes per unit of time during the review period. The actual calculation of the indicator, however, is more complex than we need to know here. What is important to know is that if we look back over a period of, say, 10 units of time and each of those 10 candles closed upwards, the RSI will show a number very close to 100. If each and every one of those 10 closed candles, the number will always be very close to 0. If the financial asset is fairly balanced between drops and raises, the RSI will show 50. The relative force index is defined as a pulse oscillator. Shows whether bulls or bears are winning in the review period, and this period can be adjusted by the trader.

Technical Analysis of the Relative Force Index

The RSI indicator is normally used in forex trading strategies in the following ways:

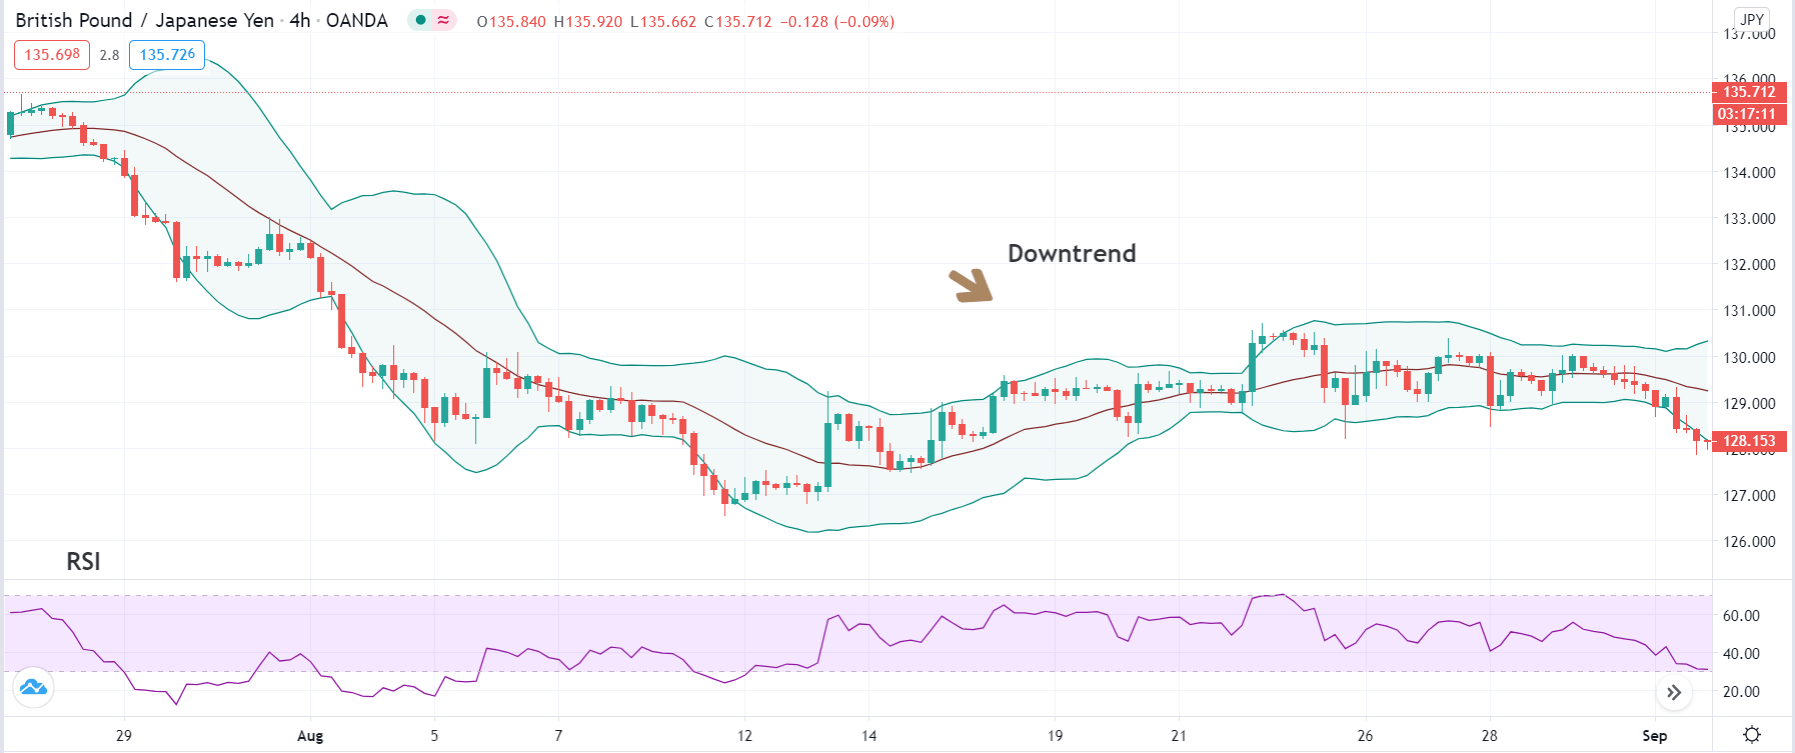
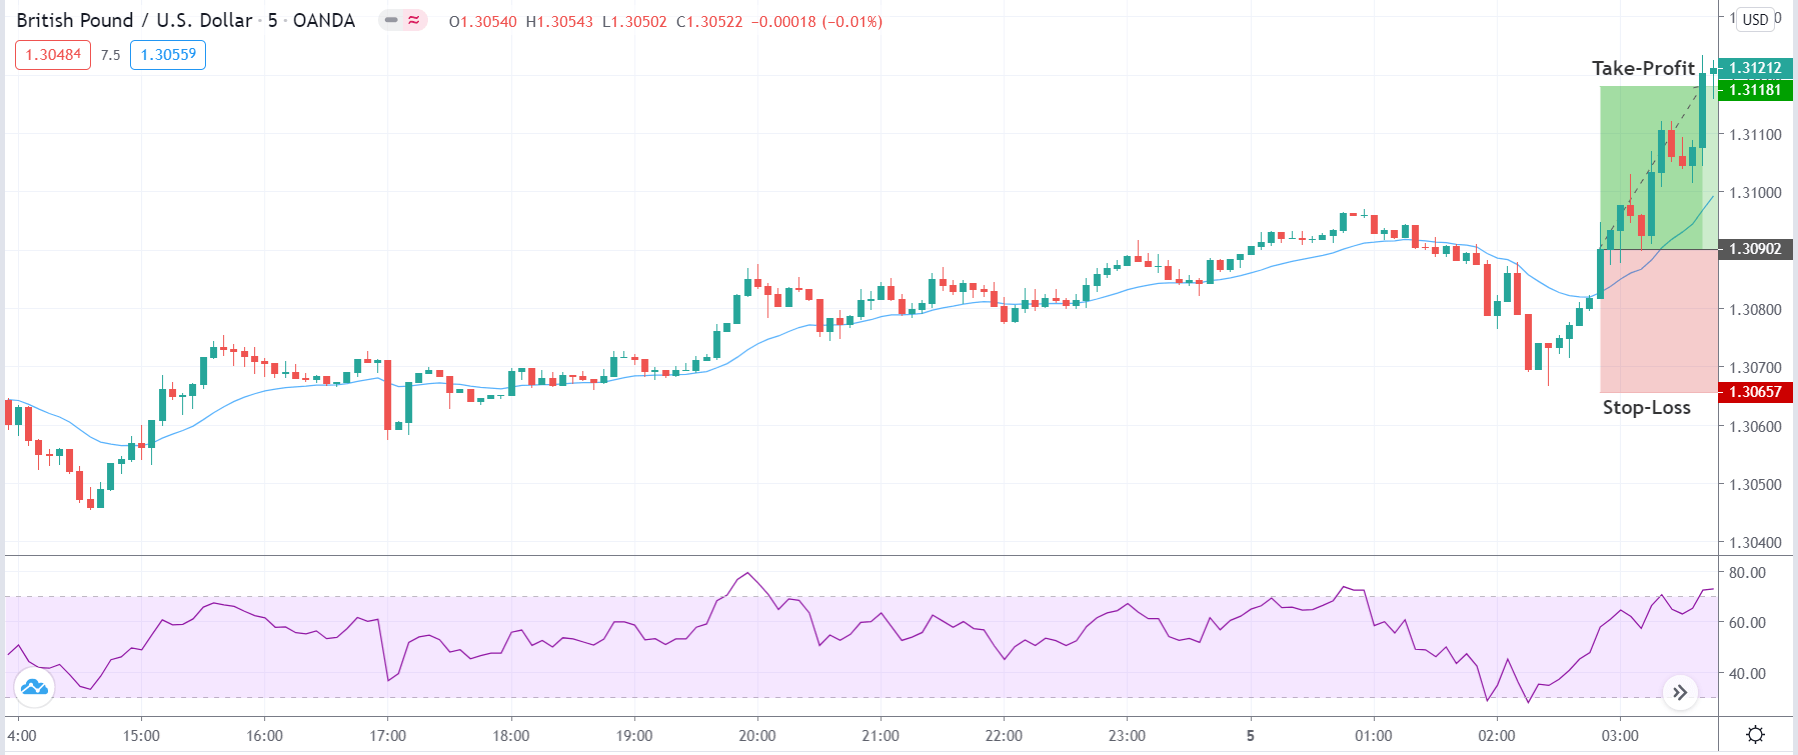
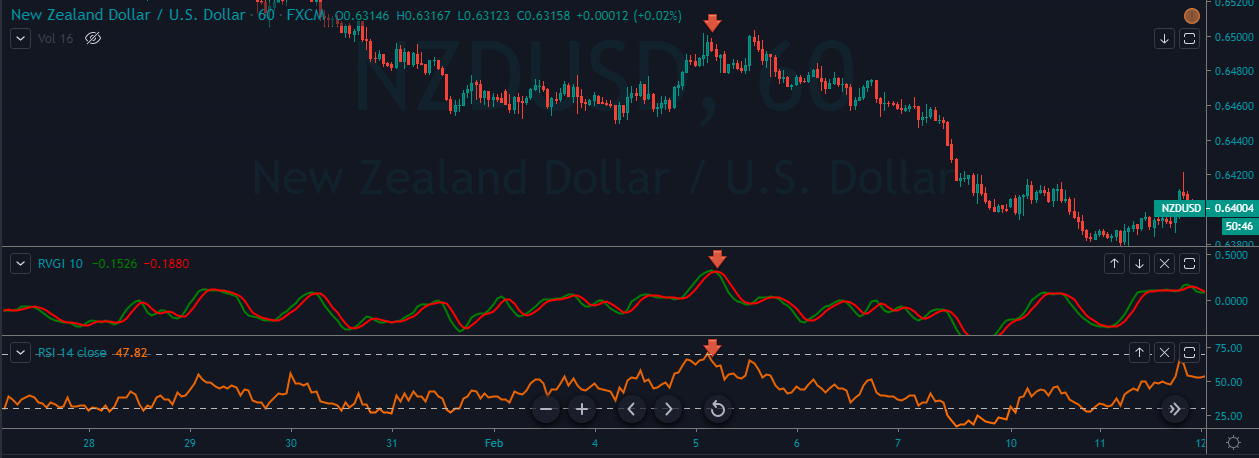
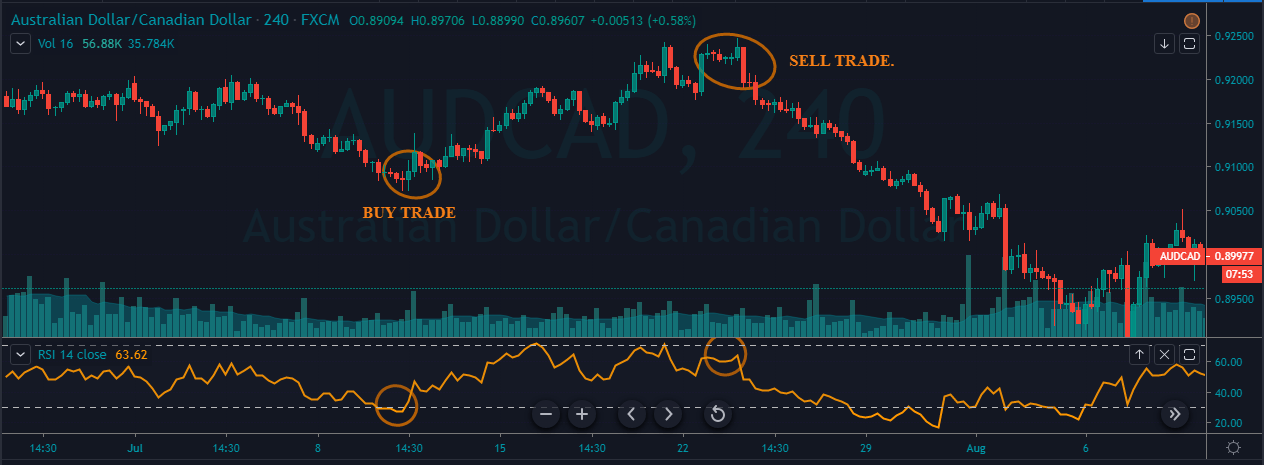
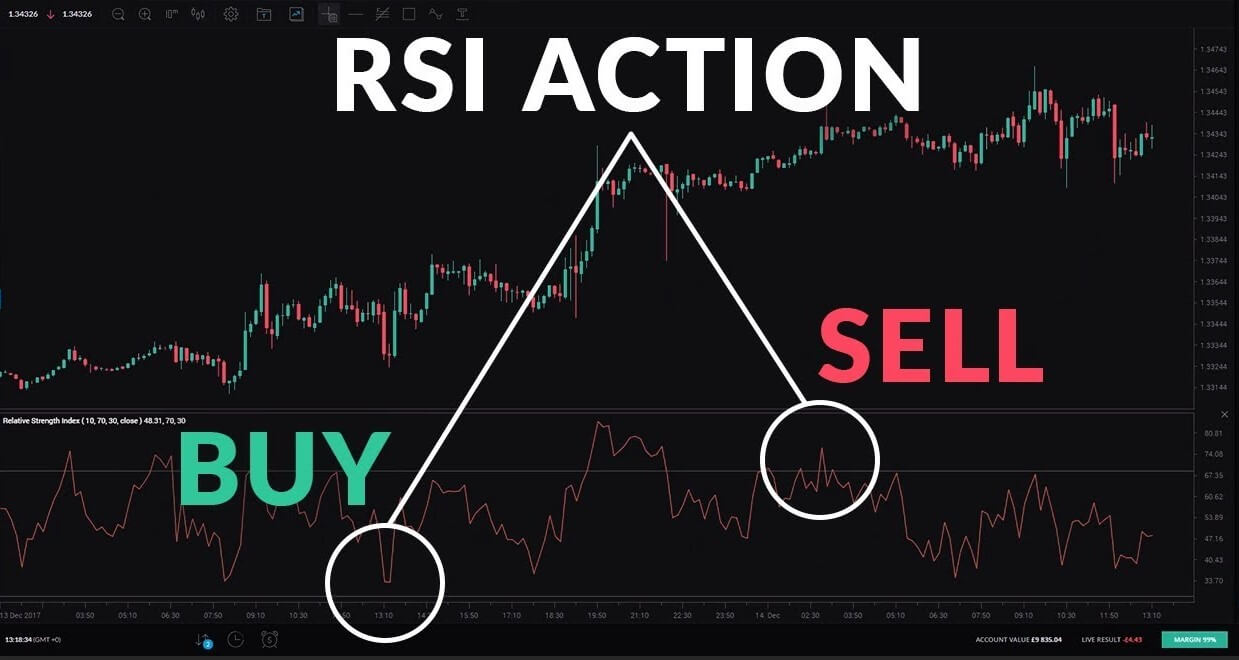
  1. When the RSI is above 70, a price drop should be expected. A drop below 70 after having been above 70 is taken as confirmation that the price is starting a downward movement.
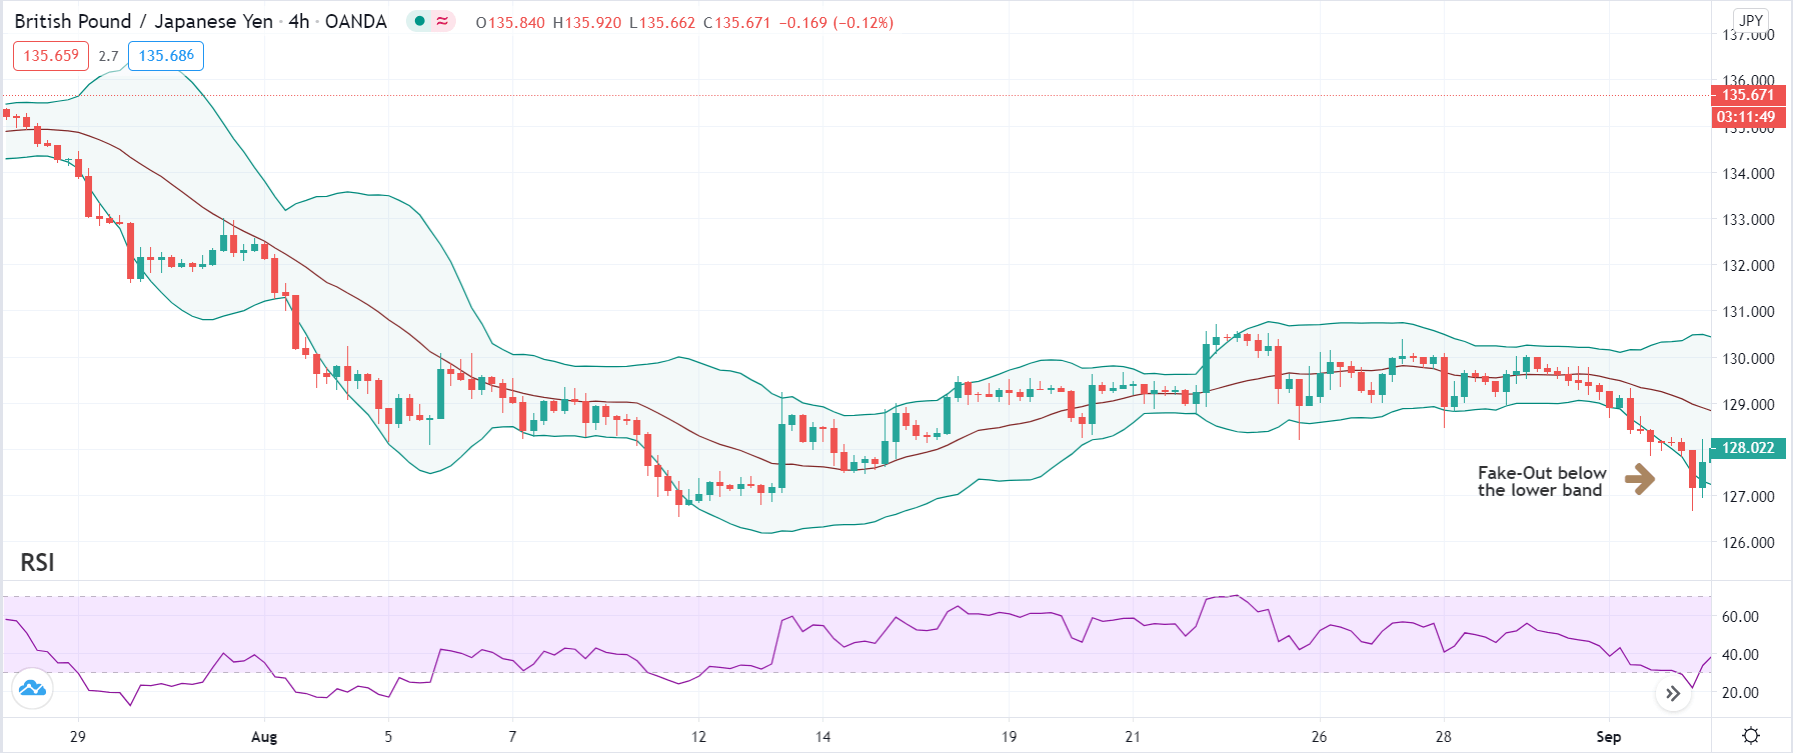
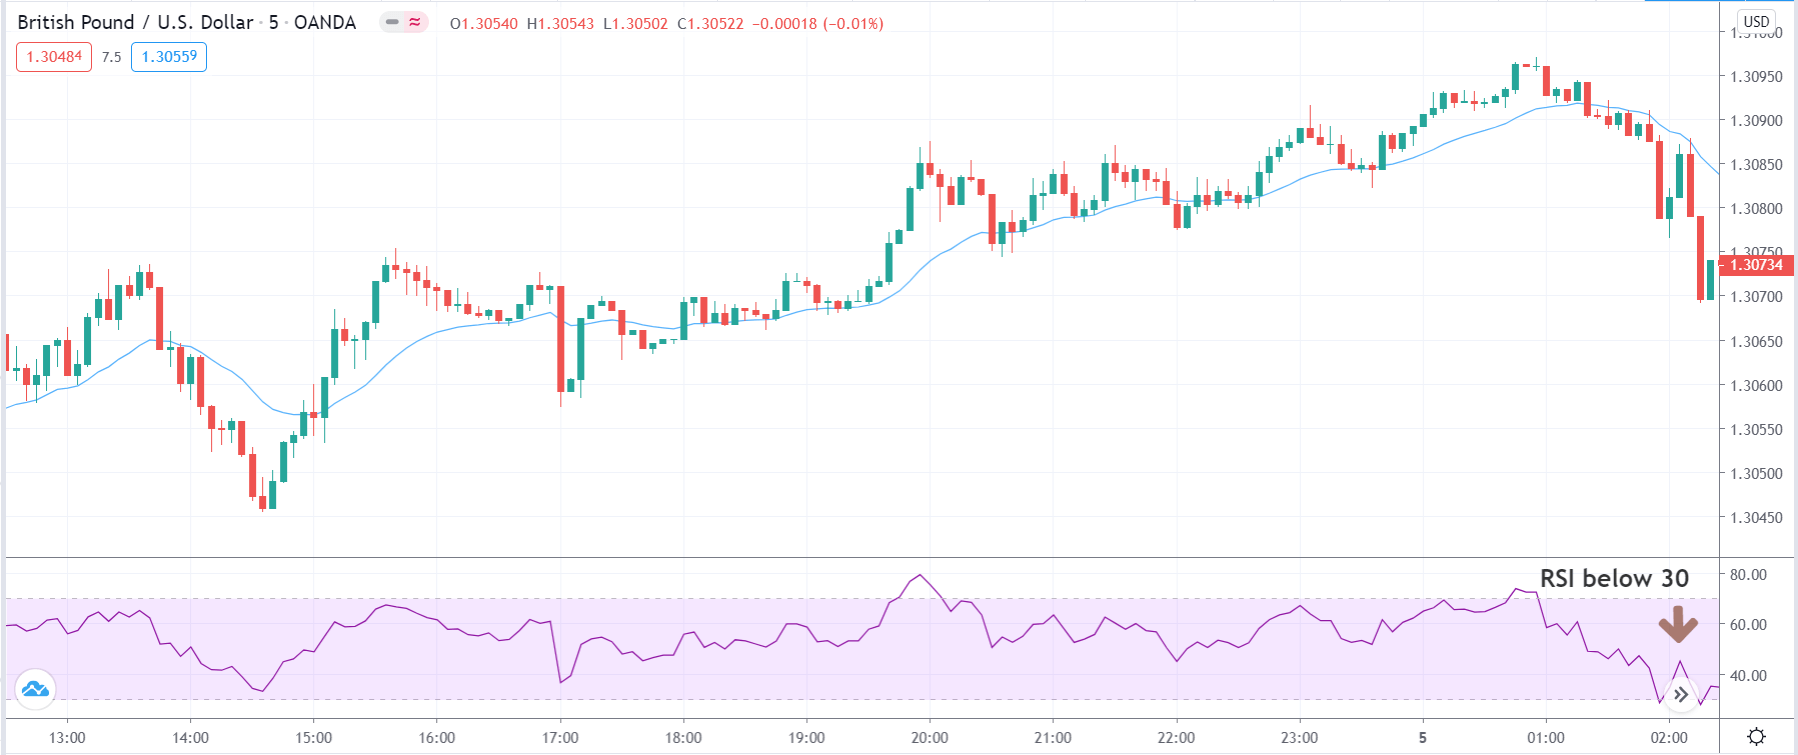
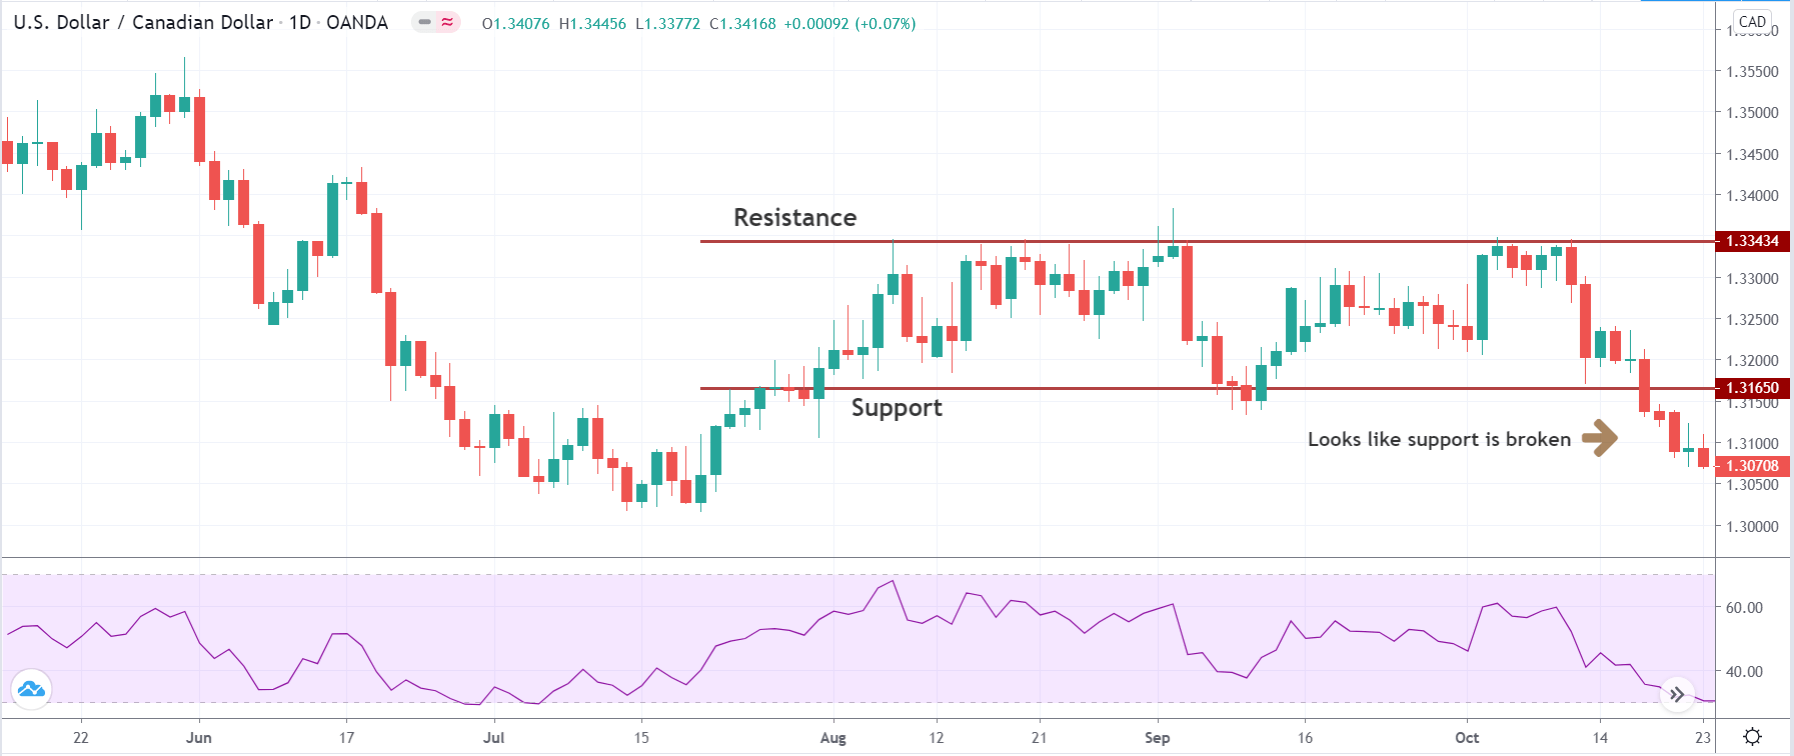
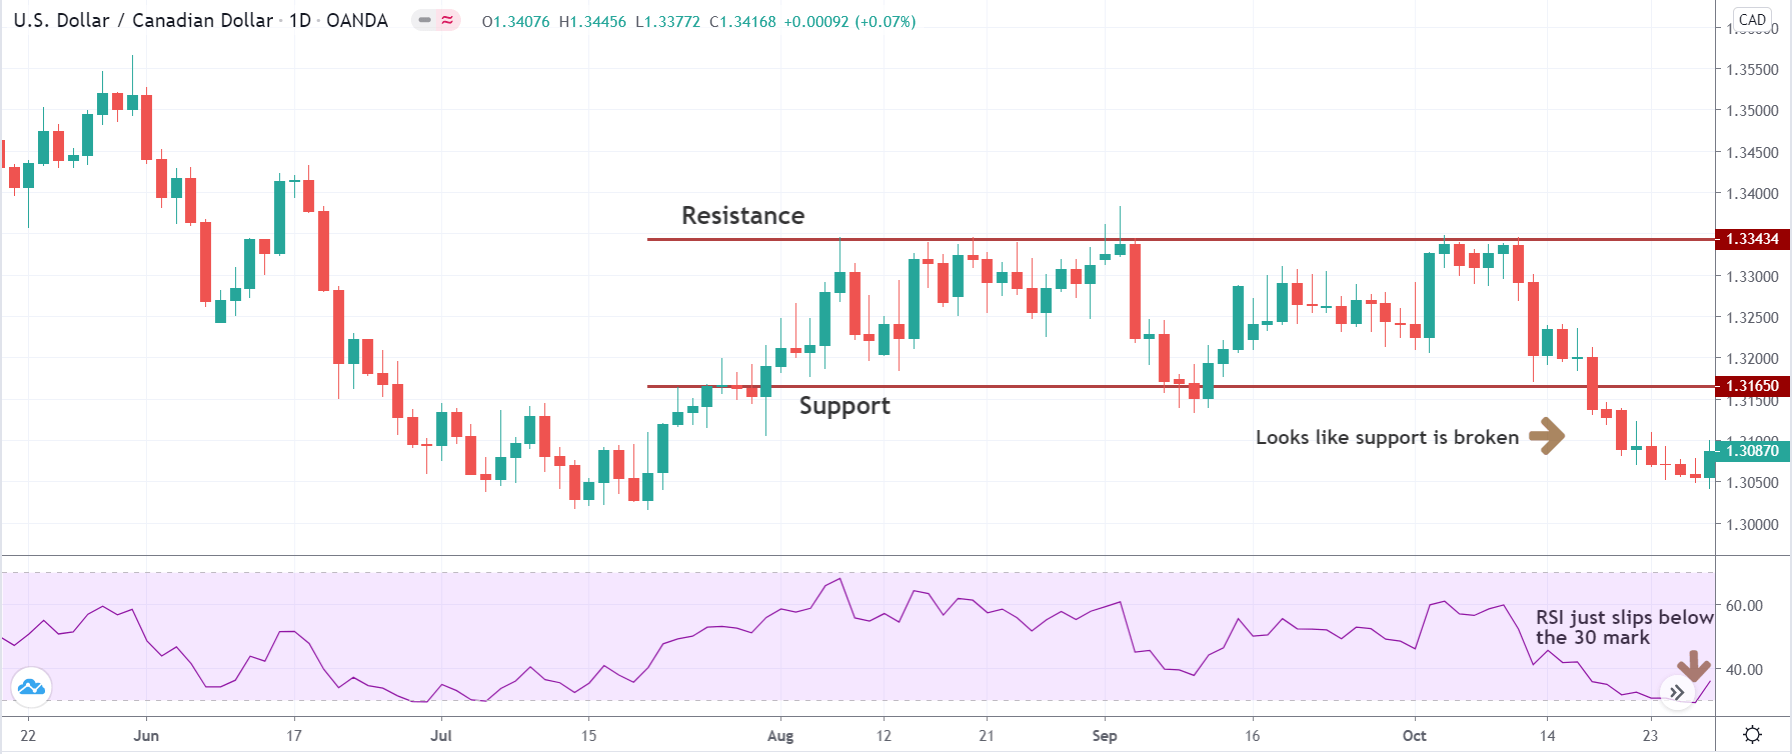
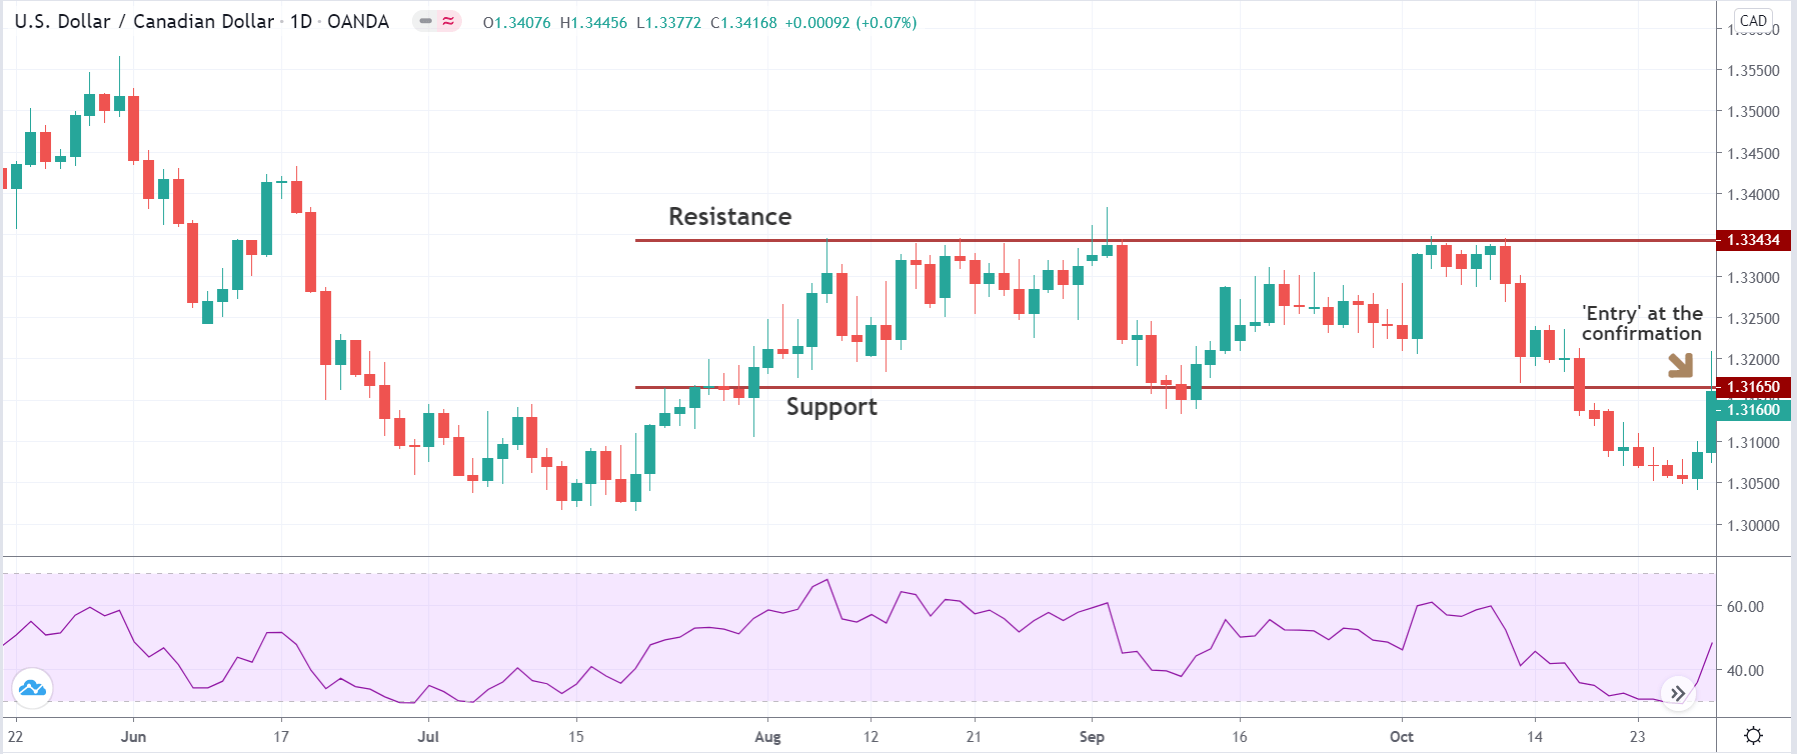
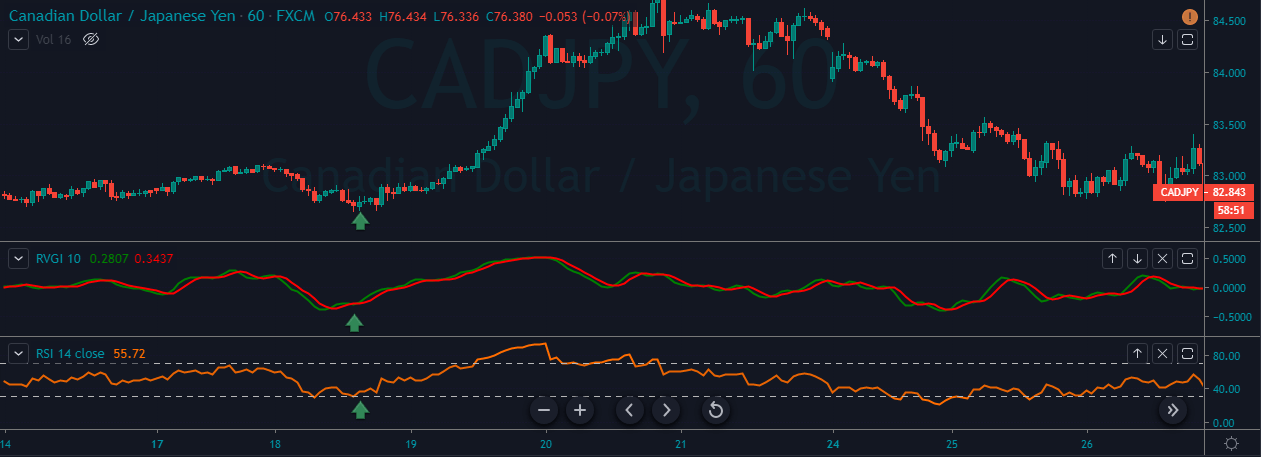
  2. When the RSI is below 30, a price increase should be expected. A rise above the level of 30 after having been below 30 is taken as confirmation that the price is starting an upward movement.
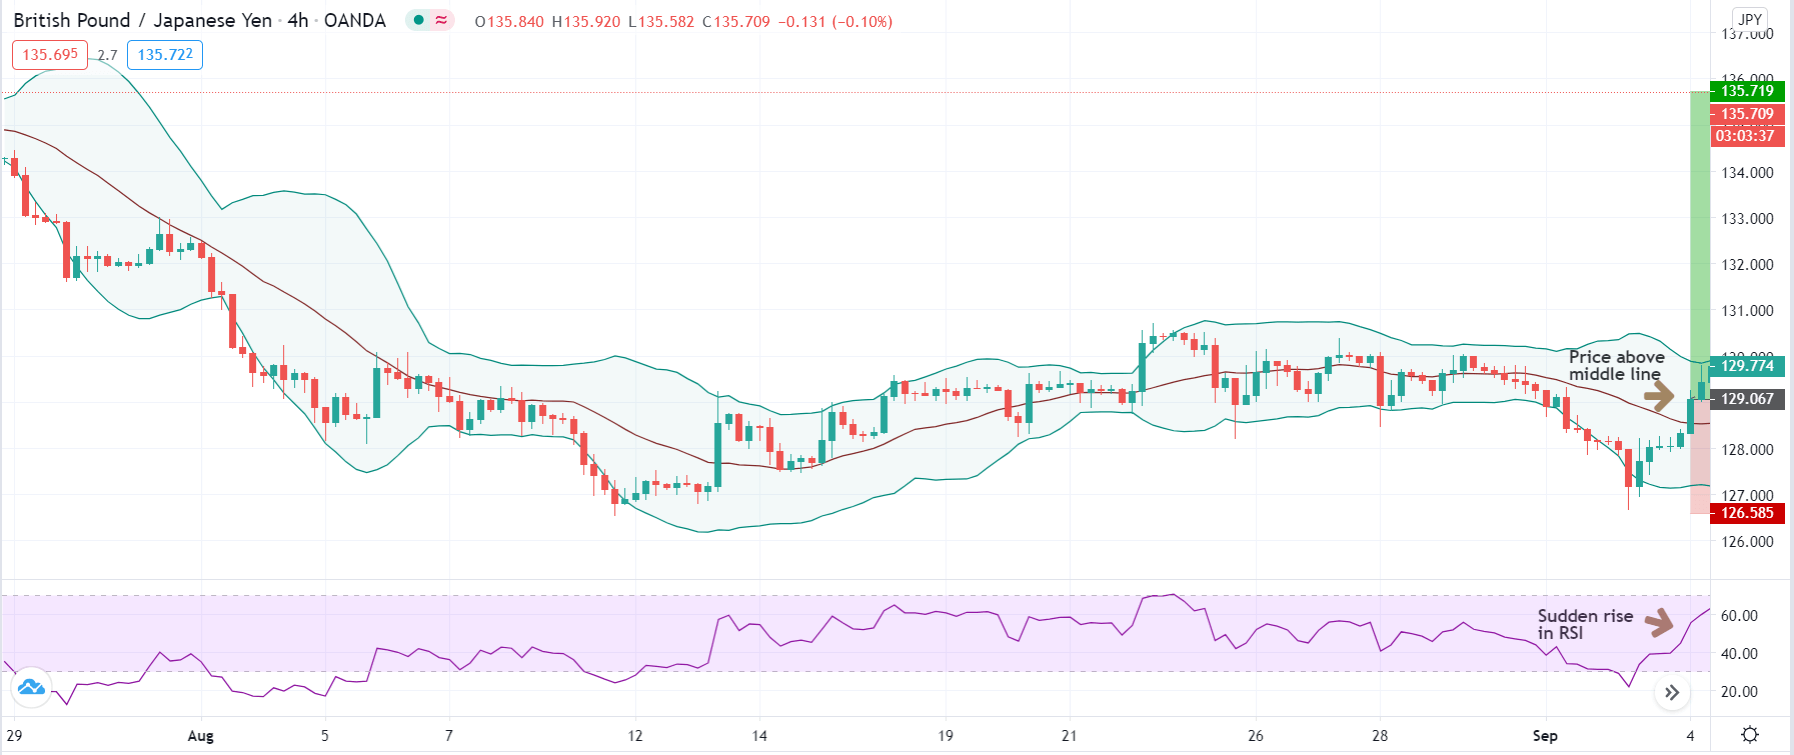
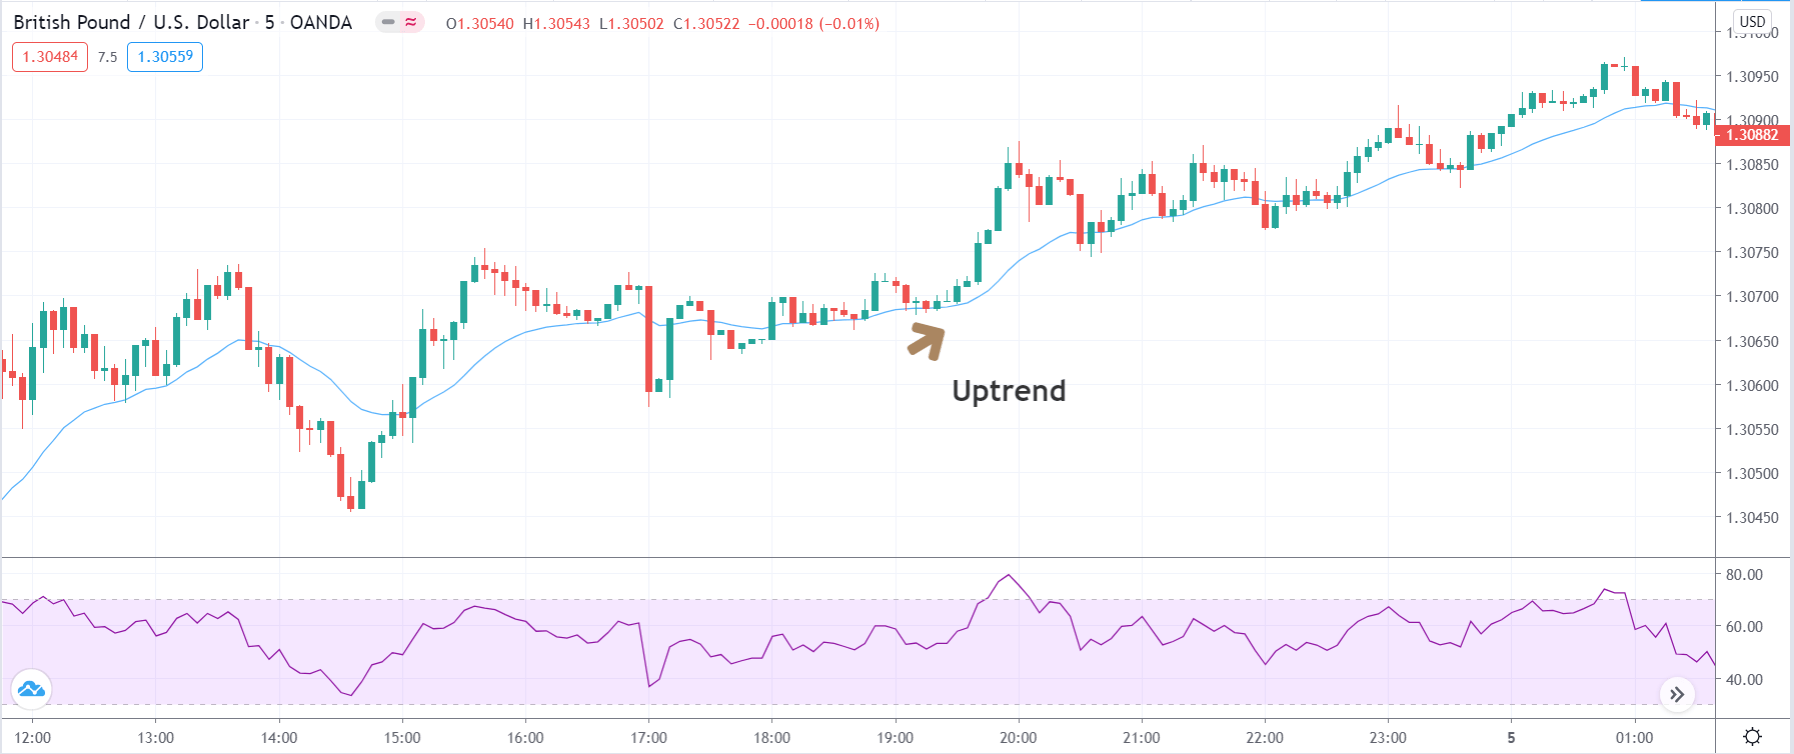
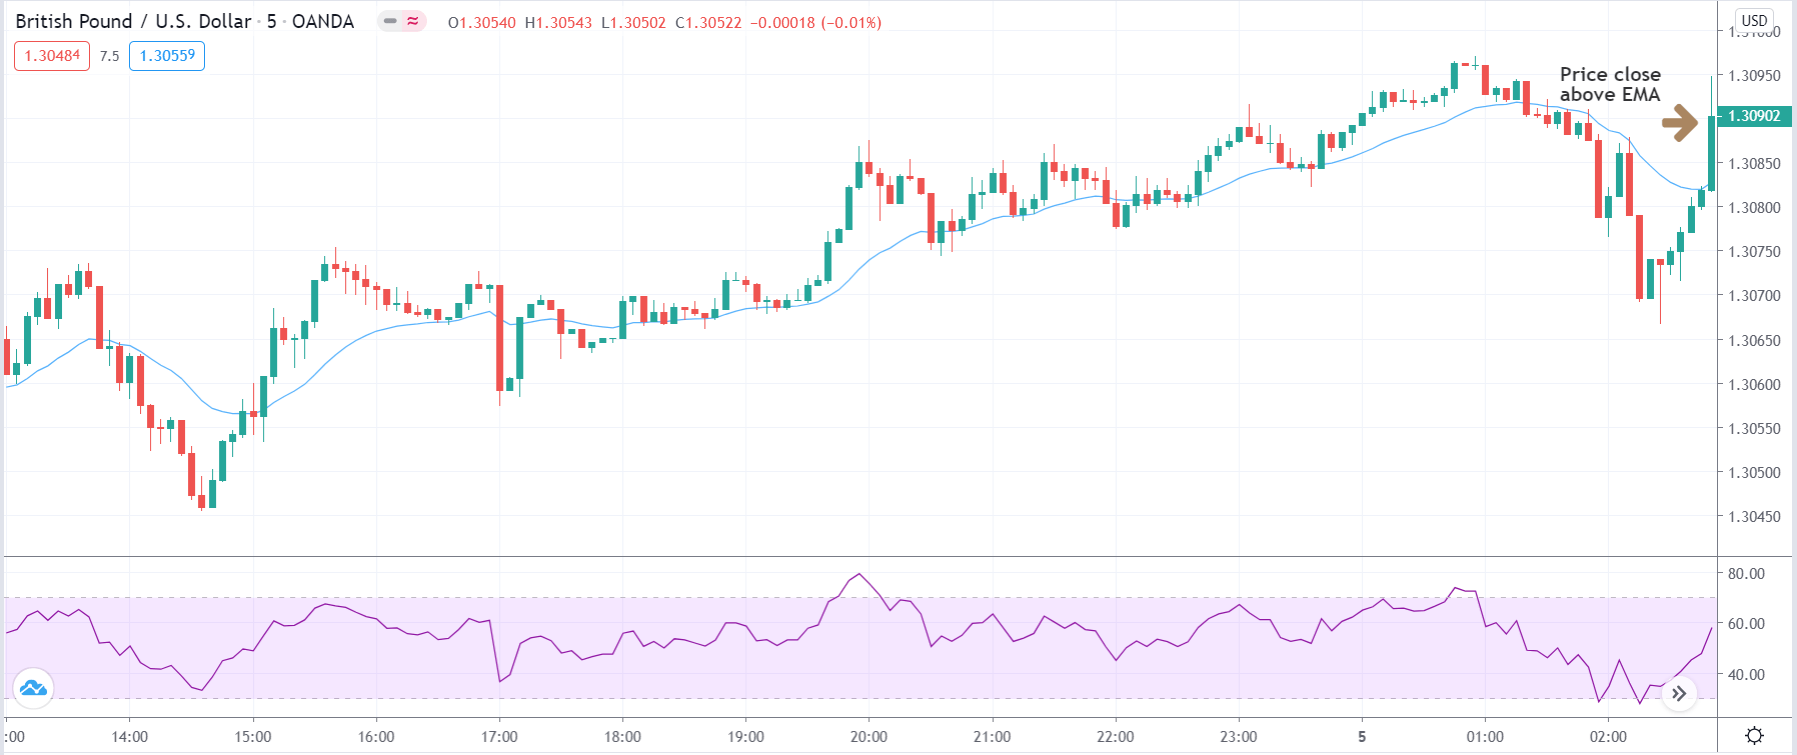
  3. When the RSI crosses above 50 after being below 50, it is taken as a sign that the price is beginning a bullish movement.
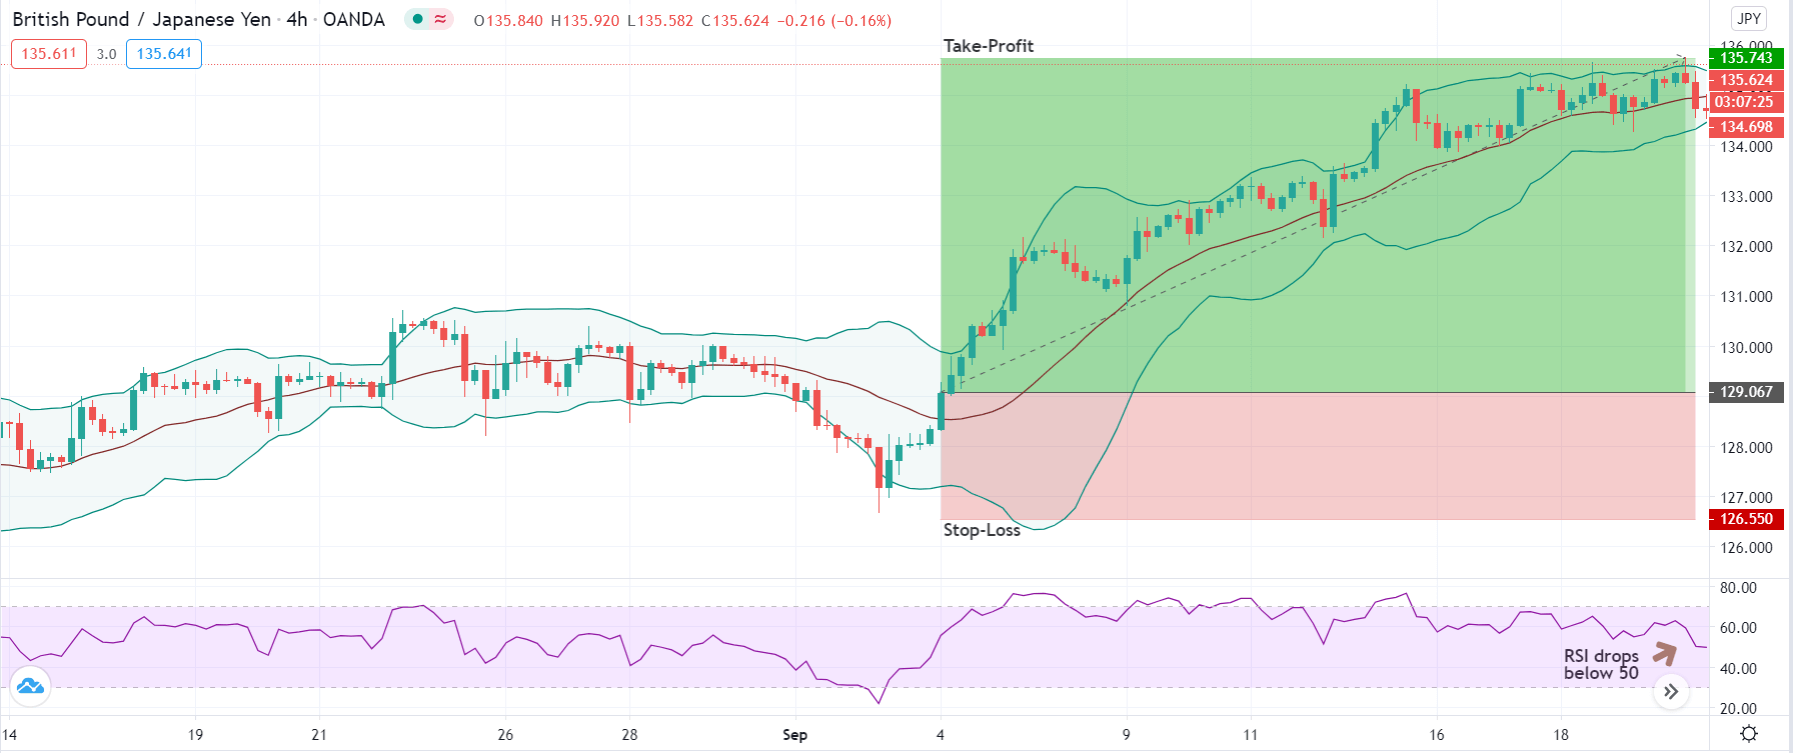
  4. When the RSI crosses below 50 after being above 50, it is taken as a sign that the price is beginning a bearish movement.

Methods 3 and 4 described above in relation to crossing the level of 50 are generally higher than the first and second methods concerning 30 and 70. That’s because more long-term Forex earnings can be achieved by following trends instead of always expecting prices to bounce back to where they were: just be careful not to move the stop loss to the break-even point too quickly.

Forex Indicators

This is a point where we will pay more attention – if it is better to follow trends, or “diminish” them by doing trades against them. There are many outdated tips on this subject, most of which were in the years prior to 1971, at a time when exchange rates, although they were fixed at the price of gold or other currencies. In this era, trading was mainly in shares or, to a lesser extent, in raw materials. It is a reality that commodities and stocks tend to show markedly different pricing behaviour from the exchange rates of Forex currency pairs – stocks and commodities show trends more often, are more volatile, and follow longer and stronger trends than Forex currency pairs, which show a stronger tendency to return to average.

This means that when making Forex trades, most of the time, using the RSI to trades against directional moves using methods 1 and 2 described above, will work more often, but it will generate less utility than the use of Methods 3 and 4 to track trading trends in the direction of the strong prevailing trend, where such a trend exists. Although it may seem attractive to try to earn smaller amounts more often and use money management to increase profits quickly, It is much more difficult to build a cost-effective medium-reversion model than to build a cost-effective trend tracking model, even when trading with Forex currency pairs. The best way to operate at RSI 50 level crossings is to use the indicator in multiple time frames for the same currency pair.

Crossing The 50 Level In Various Time Frames

Open several charts of the same currency pair in several time frames: weekly, daily, H4, up to the minute. Open the RSI flag in all charts and make sure the 50 level is checked. Virtually all forex graphics programs or software include the RSI, so it should not be difficult to use it. A good period to use in this indicator is 10. It is also important that the market review period is the same in all different time frames.

If you can find a currency pair that in all the higher time frames is above or below 50, and in the lower time frames is on the other side of 50, then you can expect the lower time frame to cross again above 50 and should accordingly open an operation in the direction of the long-term trend.

The higher or lower the RSI, the better the operation. In the forex markets, it is a universal law: strong trends are more likely to continue and a reversal that then turns tends to move very well in the direction of the trend. This method is a smart way to use a forex indicator because it identifies setbacks within strong trends and tells you when the setback is likely to end.

Categories
Forex Basic Strategies

Generating Reliable Trading Signals Using ‘The Power of Two’ Forex Strategy

Introduction 

In the previous article, we discussed a strategy that was based on three indicators, namely the RSI, Stochastic, and SMA. It was not only a bit complex in nature but involved many rules that had to be fulfilled before we could make a ‘trade.’ Also, the probability of occurrence of the signal was lower as it involved many indicators.

In today’s article, we will discuss a setup that is observed more often in the market and has a higher probability of success. Again, the strategy may not be suitable for day traders as it used a longer time frame for analysis. In this strategy, we will be examining the 4-hour time frame chart of the currency pairs. This is simpler than the previous strategy.

Time Frame

As mentioned in the previous paragraph, the strategy yields the best results when applied on the 4-hour time frame. However, the ‘daily’ is also a suitable time frame for the strategy.

Indicators

We will be using the Relative Strength Index (RSI), with a 14-bar period. The overbought and oversold levels stand at 70 and 30, respectively. We also apply the Bollinger Band indicator with its default settings.

Currency Pairs

This is the best part of the strategy, where we can apply on all currency pairs listed on the broker’s platform, including few minor and exotic pairs.

Strategy Concept

The strategy is based on a simple concept that the RSI is a very powerful indicator of a trend. It can accurately identify the highs and lows that will give rise to a new trend. This is combined with the Bollinger Band indicator to generate exact entry points for the strategy.

The trend becomes especially reliable when the reading of RSI makes a swift jump from an oversold level to a median level (above 50) and vice-versa. The Bollinger Band indicates the formation of a ‘low,’ after which we can execute a ‘long’ trade. Similarly, when Bollinger Band pin-points a ‘high,’ we execute ‘short’ trades in the market. The exact rules of ‘entry’ will be discussed in the next section of the article.

The risk-to-reward (RR) of the trades done using this strategy is highly appealing. This is because it employs a small stop-loss with a much higher take-profit. If the market is in a strong trending state, traders can ride their profits as long as they see signs of reversal.

Trade Setup 

In order to explain the strategy, we have considered the 4-hour chart of GBP/JPY, where we will be illustrating a ‘long’ trade. Here are the steps to execute the strategy.

Step 1

The first step is to open the 4-hour timeframe of the desired currency pair and plot Bollinger Band and RSI indicator on it. Just from the appearance and basic knowledge of trends, identify the trend of the market. This means if the market is making higher highs and higher lows, the market is in an uptrend. And if we see lower lows and lower highs on the chart, it is a downtrend. We can also take the assistance of a simple moving average (SMA) to get a clear picture of the trend.

In the case of GBP/JPY, it is evident from the below image that the market is in a strong downtrend.


Step 2

Next, we need to wait for the price to go above the highest point visible on the chart, where we will be analyzing signs of a reversal to the downside. Similarly, we need to wait for the price to go below the lowest point visible on the chart, where we will be analyzing the signs of a reversal to the upside. For example, suppose the price is near its lowest point visible on the chart. In that case, we say that market may be reversing to the upside if a bearish candle closes below the lower band of the Bollinger Band, and the immediate next candle is a bullish candle that closes above the lower band. This has to be accompanied by the RSI moving into the oversold zone (below 30).

In case of a reversal of an uptrend, a bullish candle should close above the upper band of the Bollinger band with a bearish candle that closes below the upper band. At this price, the RSI should indicate an overbought situation of the market (above 70).

Step 3

This is the easiest step of the strategy where we have to only observe the movement of price following the ‘two-candle’ pattern discussed in the previous step. Essentially, we need to see that the price starts moving in the direction of the reversal, i.e., above or below the median line of Bollinger Band. This should again be accompanied by a rising RSI for ‘long’ entry and falling RSI for a ‘short’ entry.

In the below image, we can see how the rise in price above the median line goes with a sudden rise in RSI.

Step 4

In this step, we determine the stop-loss and take-profit for the trade done using this strategy. The stop-loss is placed just below the ‘low’ or above the ‘high’ from where the market reverses. However, there is no fixed take-profit level here. We exit a ‘long’ trade once RSI goes below 50 and start moving lower. While a ‘short’ trade is exited as soon as RSI goes past the level of 50.

As we can see in the image below, the market reversed fully, and the trade turned to be extremely profitable.

Strategy Roundup

When Bollinger Band and RSI are combined to generate trade signals, we can accurately identify the market top and bottom where we take advantage of the reversal. But this can only be done efficiently after practicing well. The above strategy is suitable for swing and part-time traders.

Categories
Forex Basic Strategies

Learning To Trade The Forex Market Using ‘2-Period RSI’ Trading Strategy

Introduction

When we look for a trade setup, most of the times we do not have an idea of the strategy, we will be using for taking a particular trade. From there, we start to pick random indicators and start trading using those indicators without a proper strategy associated with that indicator. With our 2-Period RSI strategy, we will solve this confusion by looking at the market with a systematic approach that involves using the RSI indicator. In addition to the RSI indicator, we will also use a 20-period EMA. Most importantly, we will look to take trades in the direction of the main trend.

Now that we know what our goals are, we will look into the various parameters of the strategy and understand how to apply the same.

Time Frame

This strategy works well on the 5-minutes and 15-minutes time frame. This is a perfect intraday trading strategy.

Indicators

The strategy uses RSI as its major indicator. We also use the EMA for identification of the trend. Both the indicators are applied with their default settings.

Currency Pairs

This strategy is applicable to most of the currency pairs listed on the broker’s platform. However, illiquid pair should be completely avoided.

Strategy Concept 

The concept of the strategy is very simple if we have a clear understanding of the previously discussed strategy. The basic idea of here is to trade the retracement of an established trend. Therefore, the strategy can only be used when the market is trending. Once the trend has been identified, we wait for a ‘pullback’ in the price and then take an ‘entry’ in the direction of the market after a suitable confirmation. The Relative Strength Index (RSI) is an important indicator in this strategy which helps us in measuring the over-extended phase of the retracement.

A reading above 70 indicates an over-extended ‘up’ move while a reading below 30 indicates an over-extended ‘down’ move. In an uptrend, we will look for a retracement that is overextended, implying that the RSI should be below 30. While in a downtrend, we will look for a retracement that is overextended, implying that the RSI should be above 70. The crucial part of the strategy is that we don’t enter for a ‘buy’ or ‘sell’ soon after the RSI gives an indication, but instead wait for a sign of reversal that confirms the continuation of the trend.

Trade Setup

In order to explain the strategy, we will be taking a ‘long’ trade in the GBP/USD currency pair on the 5-minutes chart using the 2-period RSI strategy.

Step 1

The first step is to identify the major direction of the market. Many technical indicators help in identification of the trend, but the one that is suitable for this strategy is the EMA. We will identify the trend of the market using the 20-period EMA, which is best suited as per the conditions of the strategy.

In our example, we have identified an uptrend whose retracement shall be evaluated.

Step 2

Next, we need to wait for the market to turn from its highest or lowest point, depending on the trend, and then check if that is a retracement or a reversal. After the price starts to pull back, we wait until the RSI shows a reading below 30, in an uptrend and above 70, in a downtrend. Once that happens, we become alert and watch the price cautiously.

Step 3

Now we wait for the price to reverse and close above the 20-period EMA, in an uptrend and close below the EMA, in a downtrend. Ensuring this step is critical as it confirms the continuation of the trend. We enter the market with an appropriate position at the close of the candle. There are two ways of entering the market. One, wait for the candle to close and then enter. Second, enter at the crossing of the price above or below the EMA. The second approach is an aggressive form of ‘entry’ and is not recommended for everyone. There is also a conservative form of entry, that is entering at the re-test of the EMA.

In the below image, we can see that we are entering at the close of the bullish candle above the EMA. But since the candle is long and has a large body, the ‘entry’ price is much higher than what we were looking for.

Step 4

Finally, we determine the stop-loss and take-profit for the strategy. The stop-loss is placed below the ‘low’ from where the market reverses and starts moving higher in case of a ‘long’ trade. In a ‘short’ trade, it will be placed above the ‘high’ from where the market reverses and starts moving lower. Since we are trading with the trend, the ‘take-profit’ can be set at the new ’high’ or ‘low’ that will result in a higher risk-to-reward ratio.

In our case, the risk-to-reward ratio of the trade is just 1:1 since we took a late ‘entry.’

Strategy Roundup

We are making use of the RSI indicator in a most constructive way which helps us in identifying when the market is overbought or oversold. Using the concept of trends, we are applying the strategy to reduce risk and maximise gains. The rule for entering the market in this strategy is what stands out. We are entering only after getting clear signs of confirmation from the market. We can also trail our stop-loss and exit when we get signs of another reversal. This is an aggressive way of taking profit and is mostly done to increase the gains.

Categories
Forex Basic Strategies

Everything About The ‘RSI Rollercoaster’ Forex Trading Strategy

Introduction

Sometimes it is best to choose the simplest path of trading. The Relative Strength Index (RSI), invented by Welles Wilder, is one of the oldest and most popular technical analysis tools. If best traders in the world were asked to rank the technical indicators, RSI would certainly be accorded in the top five. It has the unique ability to measure turns in price by measuring the momentum of the turn, which is impossible by any other technical tool in technical analysis.

The standard RSI setting of 70 and 30 serves as a clear sign of overbought and oversold, respectively. The RSI rollercoaster is a strategy that we have developed to take advantage of these turns in the market. The purpose of RSI rollercoaster is to make money from range-bound currency pairs.

Time Frame

This strategy is suitable for trading on the ‘daily’ time frame. It can also be used on the smaller time frames, but the success rate is not very encouraging.

Indicators

As the name suggests, we will be using the RSI indicator for the strategy. No other indicators will be used. Sime knowledge of price action will be helpful.

Currency Pairs

This strategy applies to all the currency pairs listed on the broker’s platform. If trading on the lower time frame, we need to look for highly liquid currency pairs.

Strategy Concept

The key to the RSI rollercoaster strategy versus the traditional RSI strategy is the way of trading the overbought and oversold levels. Here we look for a reversal candle, which provides a sign of exhaustion before taking the trade. This way, we prevent ourselves from picking the top or bottom of a ‘range’ by waiting for an indicator confirmation.

This strategy works best in a ‘ranging’ market where overbought and oversold signals are far more true indications of change in direction. Furthermore, from experience, we have observed that the setup is much more accurate on the ‘daily’ charts than on the smaller time frames such as the 4 hours or 1 hour.

The primary reason for this difference is that ‘daily’ charts include far more data points into their subset and, therefore, change in momentum tends to be more meaningful on longer time frames. Nevertheless, the disproportionate risk to reward ratio in this setup makes even the shorter time frame trades worth considering. We keep in mind that although the setup will fail more frequently on the shorter time frames, the losses will generally be smaller, keeping the overall risk manageable.

Trade Setup

In order to explain the strategy, we have considered an example of such a trade that was carried out on the USD/CAD pair. As the strategy produces a better result on the ‘daily’ time frame, we will be applying it to the ‘daily’ time frame chart. Let us see the steps to execute the strategy.

Step 1

The first step of the strategy is to open the ‘daily’ (preferable) time frame chart of the desired currency pair. Identify key levels of ‘support’ and ‘resistance.’ A ‘support’ or ‘resistance’ is only valid if the price has reacted off from this area at least twice. If the price has reacted only once, that means a ‘range’ has not yet been established.

The below image shows the clear formation of a ‘range’ where the price has reacted multiple times from the ‘ends.’

Step 2

In this step, we wait for the RSI indicator to cross above the 70 ‘mark ‘when the price is near ‘resistance’ or cross below the 30 marks when the price is near ‘support.’ During this time, the price action of the chart is not of much importance. Once the RSI shows a reading below 70 after crossing it, we will look for ‘sell’ opportunities depending on the price action. Similarly, when the RSI shows a reading above 30 after crossing below it, we will look for ‘buy’ opportunities depending on the price action.

In this case, we can see that the price breaks down below ‘support,’ which is an indication of ‘sell’ as per the theory of support and resistance. But as per our strategy, we will not be looking at the price action in this step, and we will focus only on the RSI indicator.

A few days later, we see that the RSI goes below the 30 ‘mark’ for a moment and starts moving higher. This is our first indication of going ‘long’ in the market.

Step 3

We ‘enter’ for a ‘sell’ when the price moves back into the ‘range’ after the indication from RSI. Similarly, we enter for a ‘buy’ when the price moves back into the ‘range’ after the indication from RSI. This price action indicates a false breakout or breakdown, which is identified rightly with the help of an indicator.

In our case, we are entering ‘long’ in the currency pair after we get a confirmation in the form of a bullish candle, as we can see in the below image.

Step 4

In this step, we determine the ‘stop-loss’ and ‘take-profit‘ levels for the strategy. When executing a ‘long’ trade, the stop-loss will be placed just above the ‘high’ where the price created a false breakout. And when executing a ‘sell’ trade, the ‘stop-loss’ will be placed just below the ‘low’ from where the price created a false breakdown. The ‘take-profit’ depends on the major trend of the market. If we are trading against the trend, it should be kept at 1:1 risk to reward or even a little lesser than that. If the ‘trade’ is taking place with the trend, it can be kept at 1:2 risk to reward.

Strategy Roundup

The RSI rollercoaster strategy is designed to squeeze as much profit as possible out of the turns at ‘support’ and ‘resistance.’ Instead of immediately entering into a position when the market moves into an overbought or oversold zone, the RSI, along with a little bit of price action, keeps us away from the market until we get a confirmation sign of the exhaustion. The RSI rollercoaster is almost always in the market, as long as we see wild moves on either side of the ‘range’ to stop-out traders.

Categories
Forex Course

100. Leading and Lagging Indicators: How are they different from one another?

Introduction

When getting started with trading, the first things people look out for are indicators. Indicators exist in both technical analysis and fundamental analysis. The difference between the two beings, fundamental indicators indicate or predict a long-term trend while technical indicators predict or confirm a short-term trend.

One of the best forms of analyzing the markets is by using indicators, as it helps interpret the trend in the market and also the opportunities available in them. Indicators are of two types, namely, leading indicators and lagging indicators. The former one is used to predict the future trend while the latter is used to confirm a trend.

What is a Leading Indicator?

It is a type of technical indicator that forecasts future prices in the market using past prices. That is, when the indicator makes its move, the prices follow a similar move. These indicators lead the price; hence they are called leading indicators.

However, never there is a 100 percent surety that the price will move in the direction as predicted by the indicator. Yet, traders can get their ideas from the indicators, see how the market unfolds, and then act accordingly.

What is a lagging indicator?

A Lagging indicator is also a technical indicator that uses past prices and confirms the trend of the market. It does not predict future price movements. Basically, it follows the change in the prices.

Classifying Indicators

There are five types of indicators in technical analysis. Let’s put these indicators in the right bag.

Trend indicators – It is a lagging indicator to analyze if the market is moving up or down.

Mean reversion indicators – A lagging indicator that measures the length of the price swing before it retraces back.

Relative strength indicators – It is an oscillator which is a leading indicator that measures the buying and selling pressure in the market.

Momentum indicators – This leading indicator evaluates the speed with which the price changes over time.

Volume indicators – could act as a leading or a lagging indicator that tallies up trades and quantify the buyers and sellers in the market.

Examples of leading indicators

The widely accepted and used leading indicators include:

  • Fibonacci Retracement
  • Donchian channel
  • Support and Resistance levels

Difference between Leading and Lagging Indicators 

Conclusion

All novice traders are in the hunt for the so-called “best indicator” in trading. But there is no such thing as ‘best’ indicator. Every indicator is a useful indicator if applied in the right way. For instance, we cannot use a trend indicator to predict the future of the market and then undermine that it does not work. Instead, one must understand the category under which an indicator falls and then use it accordingly.

I hope you were able to comprehend the types of indicators and the difference between them. In the next lesson, we shall apply some of the indicators into the real market and test them.

[wp_quiz id=”70435″]
Categories
Forex Course

84. RVI (Relative Vigor Index) & Related Trading Strategies

Introduction

The Relative Vigor Index is one of the most popular indicators in the technical trading community. ‘John Ehlers’ developed this indicator, and it belongs to the oscillator family. The RVI is typically used to determine the strength of a trend in any given instrument. In a rising market, we generally expect the closing price to be higher than the opening price. Likewise, in a downtrend, we expect the closing price of any instrument to be lower than the opening price.

By comparing the opening price to its closing price, the RVI tries to gauge whether the trend is bullish or bearish. This predictive ability of the indicator makes it a leading indicator in the market. RVI consists of two lines, which are Green and Red in color. The Greenline is the standard moving average line, and the Redline is a 4-period volume weighted moving average. The Red is a trigger line as it provides the trading signal when it crosses above or below the Greenline.

Below how the price chart looks when the Relative Vigor Index is plotted on it.

Trading Strategies Using The RVI Indicator

A low value of the RVI indicates an oversold market, and when the RVI crosses above the signal line, it indicates a buying opportunity. Conversely, a high value indicates an overbought market, and the RVI crossing below the signal line indicates a selling opportunity.

Overbought and Oversold Crossovers

This is one of the basic and quite popular strategies using the RVI indicator. The trading opportunities that are generated in this strategy works well in all types of market conditions. The idea is to go long when the crossover happens at the oversold area and go short when the crossover happens at the overbought area. We must exit our positions when the indicator triggers an opposite signal.

As you can see in the below chart, we have generated a couple of trading opportunities in the USD/CAD Forex pair using the RVI indicator. We must follow all the rules of the strategy to generate an accurate trading signal. Place the stop-loss just below the closing of the recent candle and book the profit when the market gives an opposite signal.

Pairing RVI with RSI Indicator

In this strategy, we have paired the RVI indicator with the RSI indicator to identify accurate trading signals. Both of these indicators belong to the oscillator family, and when combined, they add great value. RSI indicator has only one line, which oscillates between the 70 to 30 levels. When it goes below the 30-level, it means that the market is oversold and above the 70 level means that the market is overbought.

Buy Example

The idea is to go long when both the indicators give a crossover at the oversold area.

The below charts represent a buy signal generated by both of these indicators in the CAD/JPY Forex pair. When both of these indicators line up in one direction, that trade has a very high probability of performing in the anticipated direction, and we must look for deeper targets. In this kind of situation, we can even risk a bigger amount.

Sell Example

The idea is to go short when both the indicators give a crossover at the overbought area.

In the below chart, NZD/USD was in a downtrend. During the pullback, both the indicators aligned in one direction giving us a selling signal. Expect deeper targets and make sure to exit the position when any of the indicators gives an opposite signal at the oversold area.

That’s about the RVI and the trading strategies using this indicator. Try these strategies in a demo account to master them and only then use them in the live market. Cheers.

[wp_quiz id=”67178″]
Categories
Forex Course

81. Learn To Trade Using The ‘RSI’ Indicator

Introduction

In our previous article, we have learned how to trade the markets using the Bollinger Bands. We hope you have used that indicator in a demo account and got a hang of it. Now, in this course lesson, let’s learn the identification of trading opportunities using a reliable indicator know as RSI.

RSI is one of the most famous indicators used in the Forex and the Stock market. It stands for the ‘Relative Strength Index’ and is developed by an American technical analyst – J. Welles Wilder. This momentum indicator measures the magnitude of the price change to identify the oversold and overbought market conditions.

The RSI indicator consists of a line graph that oscillates between zero and 100 levels. Traditionally, the market is considered overbought when the indicator goes above the 70-level. Likewise, the market is considered oversold when RSI goes below the 30-level. These traditional levels can be adjusted according to different market situations. But if you are a novice trader, it is advisable to go with the default setting of the RSI.

When the market is in an overbought condition, it indicates a sell signal in the currency pair. Likewise, if the market is in an oversold condition, we can expect a reversal to the buy-side. To confirm the buy and sell signals generated by the oversold and overbought market conditions, it is advisable to also look for centerline crossovers.

When the RSI line goes above the 50-level, it means that the strength of the uptrend is increasing, and it is safe to hold our positions up to the 70-level. When the centerline goes below the 50-level, it indicates the weakening in strength and any open sell position until the 30-level is good to hold.

RSI is one of those indicators which is not overlapped with the price action. It stays below the price charts. Below we can see the snippet of how the RSI would look on the charts. The highlighted light purple region marks the 70 and 30 levels, and the moving line in the middle is the RSI line.

How To Trade Using The RSI Indicator

There are various ways to use the RSI indicator to generate consistent signals from the market. You can use this indicator stand-alone, or you can pair it with other indicators and with candlestick patterns for additional confirmation. In this article, let’s learn the traditional way of using the RSI indicator along with RSI divergence and RSI trendline breakout strategies.

Traditional Overbought/Oversold Strategy

In the traditional way, we just hit the Buy when the RSI indicator gives sharp reversal at the oversold area. Contrarily, we go short when the RSI indicator reverses at the overbought area. The image below represents the Buy and Sell trade in the AUD/CAD Forex pair. We must close our positions when the market triggers the opposite signal. Stop-loss can be placed just below the close of the recent candle.

RSI Divergence Strategy

Divergence is when the price action moves into one direction, and the indicator moves in another direction. It essentially means that the indicator does not agree with the price move, and soon a reversal is expected. In other words, RSI divergence is known as a trend reversal indication.

In the below image, price action prints the RSI divergence twice, and both times the market reversed to the opposite side. When the market gives us a reversal, find any candlestick pattern or any reliable indicator to confirm the trading signal generated.

In the below image, we have identified the market divergence twice, and both the times the market reversed. If traded correctly, this strategy will result in high profitable trades.

Trendline Breakout Strategy

RSI trend line breaks out is a quite popular strategy as it is used by most of the professional traders. In the image below, when price action and the RSI indicator breaks the trend line, we can see the market blasting to the north.

Always remember to strictly go long in an uptrend, and go short in a downtrend while using this strategy. Buying must be done when the market is in an overbought condition, and the selling must be done when the market is in an oversold condition.

If you want to confirm the entry, wait for the price action to hold above the breakout line to know that the breakout is valid. Exit your positions when the RSI reaches the opposite market condition.

That’s about RSI and trading strategies using this indicator. Try using this indicator on a demo account today and experiment with the above-given strategies. Let us know if you have any questions in the comments below. Cheers!

[wp_quiz id=”66690″]