Categories
Forex Basic Strategies Forex Trading Strategies

Chandelier Exit and Donchain Channel Strategies

In the final article of our five strategy series, we will present one of the most successful strategies containing two not-so-popular indicators. Whatsmore, these two indicators are role-specific and could be implemented in other strategies. What makes them our pick as the most successful example is the fact they completely solve the decision-making process when to enter and when to exit a trade, closely related to risk management.

Chandelier Exit Strategy

We will start with the indicator designed to tell you when to exit. It is called Chandelier Exit. If you are wondering why we start with an indicator for exits before entries, it is because entries can even be random, but you need to know how not to turn your profits into losses, and how to keep your losses limited. This is how Chandelier Exit looks like on S&P 500 2020 bull resume run on a daily time frame (blue line):

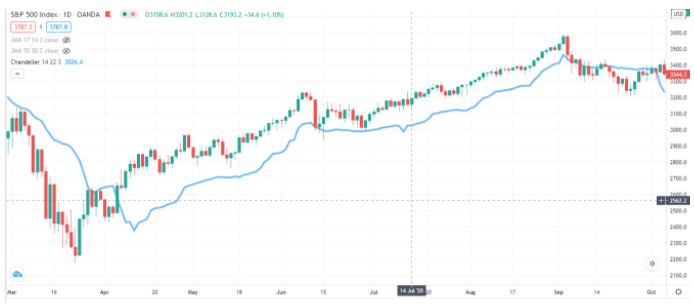
One of the most important aspects of trading is knowing where to put Stop Loss and Take Profit orders. These two limiting orders are the backbone of money management that could be realized using this indicator. Notice how the indicator blue line acts as a support for this bull run. In June the price nearly pierced the line, further supporting the trend until it really is the right time to consider long positions in September when the price closed below Chandelier Exit. On the other side, this is a form of a trailing stop that also acts as a profit taker – it closes the long position when the trend is likely over. This way you avoid the pressure when the price is testing the support and avoid letting profits shrink too much. The balance of getting out too early and too late is what this indicator does great by default settings. Additionally, it puts you in a firm seat once the trend is rolling, and emotions at bay. Even though this example is for the bullish trend, the same applies to shorting. 

The secret of this indicator that creates this balance is the volatility component in its code. To measure volatility, Chandelier Exit uses ATR, the same indicator we use for money management as explained in our previous articles. Highest High and the Lowest Low range in 22 periods (default) is used in the calculus. If you are wondering why 22, it is because a month has 22 trading days. 

Does it mean you should use it on a daily time frame? The best answer would be to adapt it to your strategy for the best possible outcome. Here is a simple optimization method that could be applied to any indicator: 

  • Backtest a fast setting and then a slow one. Choose the better option and then try 50% slower and faster settings. If the results are better for the slower then keep decreasing the periods until the results stop getting better. Make sure that you have a good trading sample, have at least 100 trades in the first runs or you might not get valid results. Specifically for the Chandelier Exit, try to change the ATR factor first.

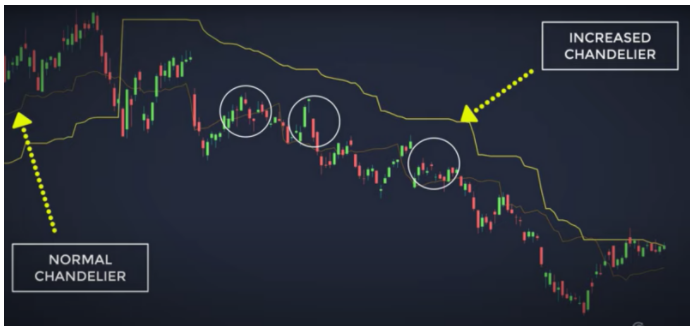
Chandelier Exit acts as a support/resistance line despite its name that sounds as it is for exits only. As the markets are different in volatility, the indicator needs adjustments. For a quick fit, traders eyeball the best entries and exits for obvious trends and then play with the period setting around that number. Volatile markets will require more than default setting while calmer will require shorter. Forex major currency pairs are not volatile as some indices, stocks, or crypto. 

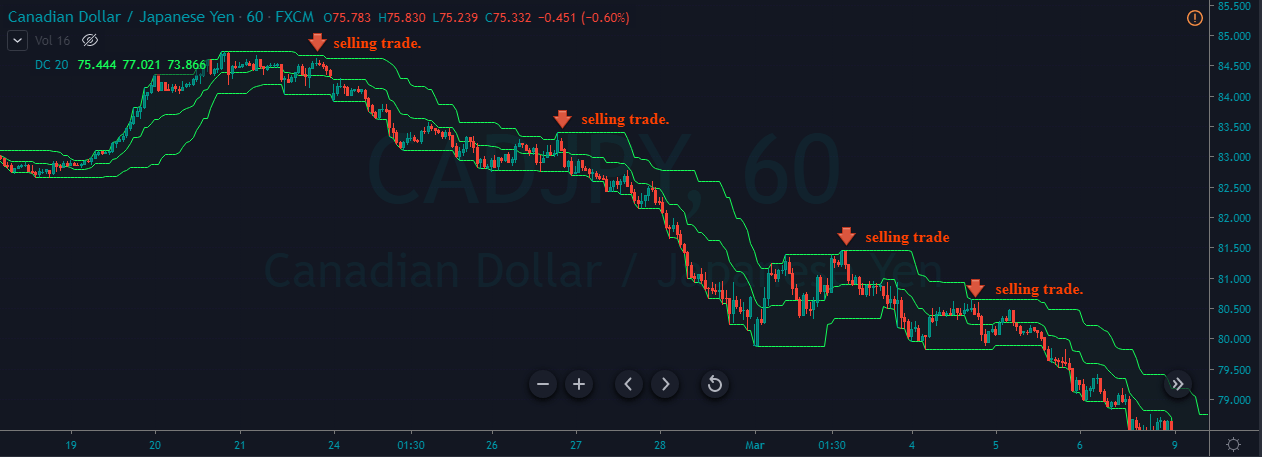
The picture below shows how the default value of the Chandelier Exit settings is not adequate to the market volatility.

Credit: The Secret Mindset

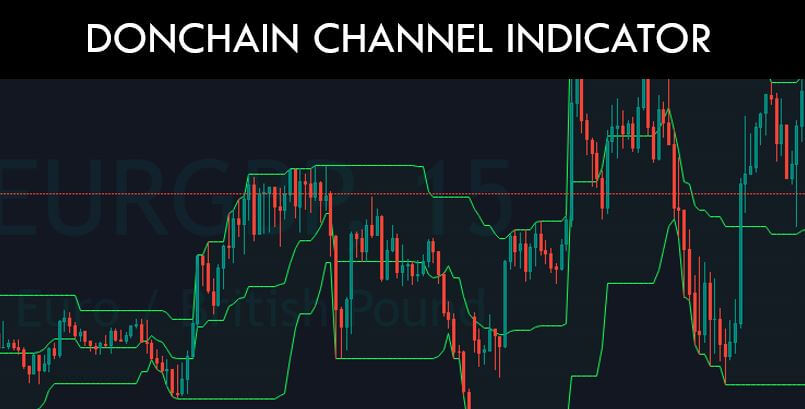
Donchain Channel Strategy

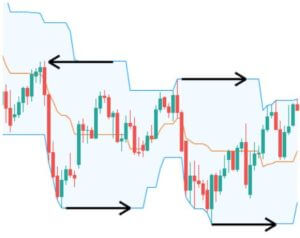
This indicator measures higher highs and lower lows for the set period (default is 20). It forms a channel similar to the popular Bollinger Bands but it has special properties that are very useful to set up money management. Volatility is the core of what these channels represent, they are expanding when the volatility increases and contract when it is calming down. Now, while it may sound the same as the Bollinger Bands, it is actually the primary element of the famous Turtles Strategy and not a reversal idea stemming from the Bollinger Bands. 

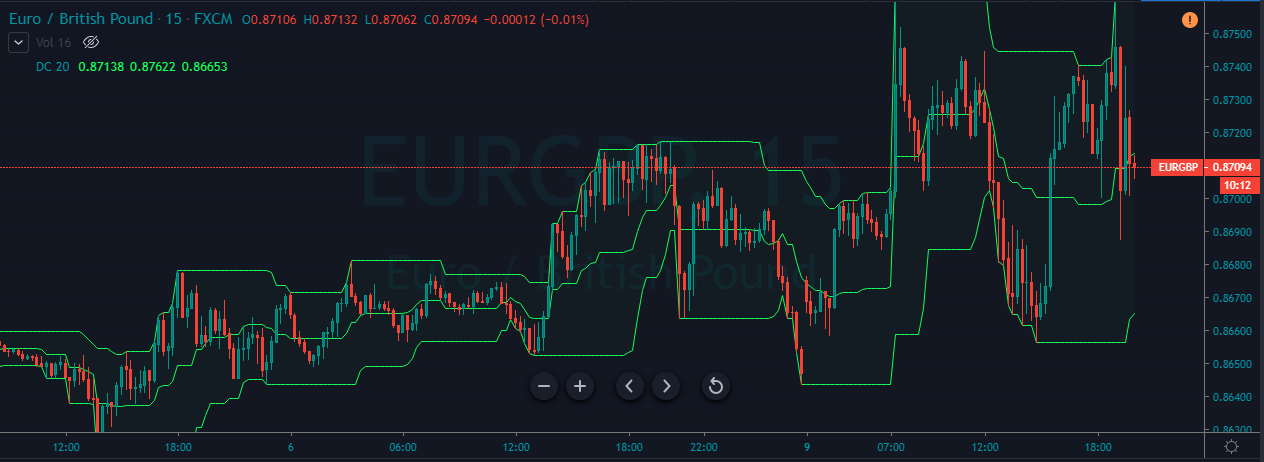
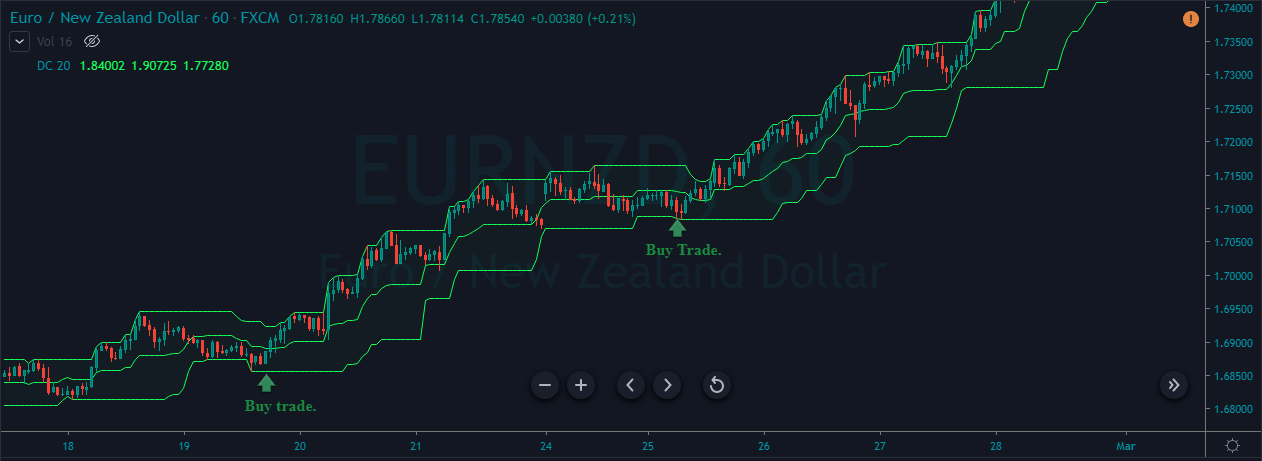
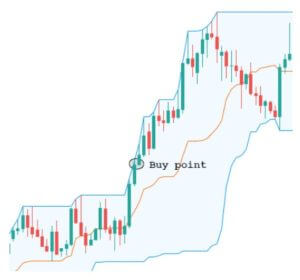
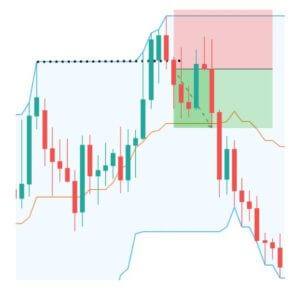
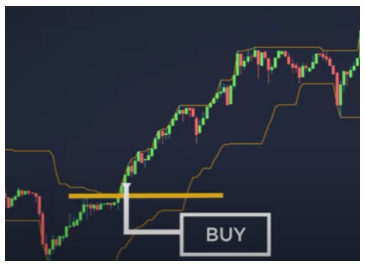
This strategy follows the breakout principle where the price is breaking through the Donchain channels, meaning the channels are representing support and resistance lines. Whenever the price closes outside the channel it is a signal to enter a trade. If you wonder where to exit, that would be when the price pierces the other side of the channel, signaling an entry just in the opposite way. Now, beginners may question how to find a signal since the channel lines are adapting to the new price lows or highs for the specified period. The answer lies in the line extension. Simply just draw or imagine an extended horizontal line covering the channel wall before the latest candle and see if the price has closed outside the channel. If it is then that is your entry or exit signal. Just do not consider these breakouts as the oversold or overbought areas. 

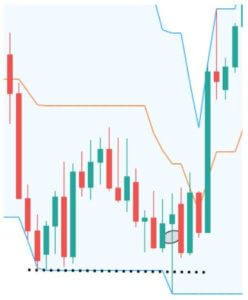
The Donchain Channel is very closely tied with the simple Support And Resistance PA trading to the point it is just a facilitator so you can see the lines. As with the S/R trading, previous resistance that was violated becomes support and vice versa. As for money management, Stop Loss acts as the profit taker and as the loss limiter. Placing the Stop loss on the chain lines is actually a trailing stop that you can move manually or you can set up a custom one that follows 2xATR value in 20 periods which is also the default for the Donchain Channel. 

Another option for money management is to use the midpoint of the channel as the exit line. Some traders use this type for more active trading where the exit is more aggressive to capture profits. However, entries then should also be more frequent since long trend following is likely to be interrupted with shallow exits at the midpoint. One more option that is often overlooked is to use the midpoint as the first Take Profit point and then moving the Stop Loss to breakeven. The remaining half of the position might continue if the trend resumes thus giving you the potential of the long trend while the risk is nullified. Most traders consider this option as the best since it blends the best of the two worlds, following long trends and having some profits while the risk is open only until the first Take Profit. 

How you set up money management rules should be closely related to the win rate and the Stop Loss/Take Profit distance. If you have a high win rate then consider expanding up the Take Profit distance to capture more gains from a trending market. While the risk amount is up to you, experienced traders do not risk more than 5% per trade of the total balance. 

You may notice both strategy examples are trend following on mid to long term timeframes, they are not designed for smaller time frames. There is too much noise and sudden high-intensity candles that trigger false signals regardless of the settings. If you still consider using smaller time frames, use the Donchain and the Chandelier Exit with a higher timeframe filter for gauging general trends. This way you ensure a higher probability for a winning trade in that direction. 

As this is the final example of the series, try to use something out of each strategy to make up your unique setup. Keep perfecting it, even if the effort does not bear winning results, know you have so much more experience that will serve you permanently. 

Categories
Forex Course

100. Leading and Lagging Indicators: How are they different from one another?

Introduction

When getting started with trading, the first things people look out for are indicators. Indicators exist in both technical analysis and fundamental analysis. The difference between the two beings, fundamental indicators indicate or predict a long-term trend while technical indicators predict or confirm a short-term trend.

One of the best forms of analyzing the markets is by using indicators, as it helps interpret the trend in the market and also the opportunities available in them. Indicators are of two types, namely, leading indicators and lagging indicators. The former one is used to predict the future trend while the latter is used to confirm a trend.

What is a Leading Indicator?

It is a type of technical indicator that forecasts future prices in the market using past prices. That is, when the indicator makes its move, the prices follow a similar move. These indicators lead the price; hence they are called leading indicators.

However, never there is a 100 percent surety that the price will move in the direction as predicted by the indicator. Yet, traders can get their ideas from the indicators, see how the market unfolds, and then act accordingly.

What is a lagging indicator?

A Lagging indicator is also a technical indicator that uses past prices and confirms the trend of the market. It does not predict future price movements. Basically, it follows the change in the prices.

Classifying Indicators

There are five types of indicators in technical analysis. Let’s put these indicators in the right bag.

Trend indicators – It is a lagging indicator to analyze if the market is moving up or down.

Mean reversion indicators – A lagging indicator that measures the length of the price swing before it retraces back.

Relative strength indicators – It is an oscillator which is a leading indicator that measures the buying and selling pressure in the market.

Momentum indicators – This leading indicator evaluates the speed with which the price changes over time.

Volume indicators – could act as a leading or a lagging indicator that tallies up trades and quantify the buyers and sellers in the market.

Examples of leading indicators

The widely accepted and used leading indicators include:

  • Fibonacci Retracement
  • Donchian channel
  • Support and Resistance levels

Difference between Leading and Lagging Indicators 

Conclusion

All novice traders are in the hunt for the so-called “best indicator” in trading. But there is no such thing as ‘best’ indicator. Every indicator is a useful indicator if applied in the right way. For instance, we cannot use a trend indicator to predict the future of the market and then undermine that it does not work. Instead, one must understand the category under which an indicator falls and then use it accordingly.

I hope you were able to comprehend the types of indicators and the difference between them. In the next lesson, we shall apply some of the indicators into the real market and test them.

[wp_quiz id=”70435″]
Categories
Forex Course

83. Learning To Trade The Donchain Channel Indicator

Introduction

The Donchain channel indicator is one of the quite popular technical indicators in the market. It is developed by Richard Donchian in the mid-twentieth century. This indicator consists of three moving average lines calculated by the highest high and lowest low of the last ‘n’ period. The upper Donchian band marks the highest price of the security over the ‘n’ period of time, whereas the lower band of the indicator marks the lowest price of a security over the “n” period of time. The area between the upper and lower band represents the Donchian channel.

If the price action is stable, the Donchian channel stays in a narrow range, and in volatile market conditions, the Donchian channel indicator will be wider. In this way, the Donchian channel is a wonderful indicator to assess the volatility of the market. The upper Donchian band indicates the extent of bullish energy, highlighting the price action achieved a new high in a particular period. Whereas the centerline of the indicator identifies the mean reversion price for a particular period. The bottom line identifies the extent of bearish energy, highlighting the lowest price achieved by the sellers in a fight with the buyers.

Below is how the price chart looks once the Donchain Channel indicator is plotted on to it.

Trading Strategies Using The Donchain Channel Indicator

Scalping Strategy

This strategy is made for traders who prefer to make quick bucks from the market. By following this strategy, we can get a couple of trades in a single trading session. The idea is to go long when the price action hits the lower band and go short when the price hit the upper band. The preferred time frame will be a 5- or 3-minute chart.

The image above represents a couple of buying and selling trading opportunities. Scalping is the easiest way to make quick bucks from the market. When we take a buy or sell trade, and if the price action goes five pip against your entry, we suggest you close the trade and wait for the price action to give another trading opportunity. Book the profit when price action hits the opposite band of the indicator.

Donchain Channel To Trade The Trending Market

If the market is in an uptrend, it is advisable to go only for the buy trades, and if it is in a downtrend, only go for sell trades. In this way, we can filter out false trading opportunities, and by following the trend, we can easily hold our position for longer targets.

Buy Trade

The below image represents two buying opportunities that we have identified in the EUR/NZD pair. We can see that the trend was up, and if we take any of those small sell trades, we will end up on the losing side. So on a higher timeframe, it is advisable to trade with the trend. We have captured the whole buying movement in this Forex pair. This is the easiest and safest way to trade the market using this indicator

Sell Trade

The below image represents a couple of selling opportunities in the CAD/JPY Forex pair. We can scale our positions when the market gives an opportunity to do so. Or, we can close our positions when the opposite signal is triggered. Always wait for the desired signal with patience to trade the market.

The advantage of trading with the trend is that whenever the market gives us the trading opportunity, we can easily hit the trade without worrying much. Another advantage of trading with the trend is that we can go with a smaller stop-loss as the price action spikes very less in a trending market.

These are only a few applications of the Donchain Channel Indicator. You can follow our strategy section to learn many advanced applications of this indicator. Stay tuned to learn many more technical indicators. Cheers!

[wp_quiz id=”67024″]
Categories
Forex Basic Strategies Forex Swing Trading

How To Trade The Infamous Turtle Soup Strategy?

In this article, we shall be covering the Turtle soup strategy by fading the Donchian channel, and Connor’s RSI strategy.

What is the Donchian Channel indicator?

The Donchian channel is an indicator that considers the high and low for N number of periods. For this particular Turtle Soup strategy, we will be setting the value of N=20, which accounts for the most recent 20 days.

This indicator works based on the highs and lows made by the market. The channel makes a stair-stepping pattern for every high or low made in a period of 20 days.

Below is a chart that shows the Donchian indicator applied to it.

From the above chart, we can clearly see that the top and bottom lines (blue lines) are moving in the form of a stair-stepping pattern representing the highs and lows over the past 20 days. Precisely, the black arrows represent the highs and lows in a look back of 20 days.

Trading the Turtle Soup Strategy

The Turtle Soup is a strategy developed by a trader and author Linda Bradford-Raschke. She published this strategy in one of her books named “Street Smarts: High Probability Short-Term Trading Strategies.” Talking about history, this strategy was taught to a set of novice traders (called the Turtles) by Richard Dennis and William Eckhardt in the 1980s. Also, this strategy is in reference to a well-known strategy called ‘Turtle Trading.’ Over the years, Linda Bradford-Raschke inverted the logic and reasoning behind this strategy and came up with a short-term trading method using this strategy.

Strategy 1: Adding confirmation to Donchian Channel breakout

This is the typical Turtle strategy.

The Turtle strategy using the Donchian channel is simple. When the market breaks above the resistance line, we can prepare to go long. Similarly, when the market goes below the support line, we can go short.

Here are some of the tips and tricks for using this indicator.

  • When the market breaks above/below the lines, make sure that the price is holding above/below it.
  • The candle that breaks the line must be quite strong.

Trading Example

Consider the below figure. Reading from the left, we can see that the market was holding at the upper line of the channel. Later, a huge green candle broke above the channel. Many would hit a buy at this moment, but we wait for a confirmation. When another candle shows a bullish sentiment as well, we can hit the buy at the point shown on the chart.

According to the original Turtle trading strategy, a stop loss of ‘two volatile units is kept,’ which is equal to n-period ATR x 2.

However, to keep it simple, you can keep the stop loss a few pips below the candle, which broke the channel.

Let’s do the converse

In the above example, we saw the typical way of trading the Turtle strategy. In this set of examples, we shall reverse the logic. That is, we will look to go long when the price breaks below the channel and short when the price breaks above the channel. Let’s consider a few examples for the same.

Buy strategy

Let’s say the market makes a 20 day low and is visible on the Donchian channel. Later, the price comes down to that low and even tries to break below it. Once the price shoots right back up to the line, we anticipate on the buy.

Rules:

  • The new 20 day low must be at least four days apart from the previous 20 day low. So, you cannot compare the low of yesterday and the low of today as the difference is just one day apart.
  • Entry must be 5-10 pips above the previous 20 day low.
  • Stop loss must be placed 1-2 pips below the low of today.
  • Aim for a take profit of 1R.

Sell strategy

The sell strategy is just the opposite of the strategy discussed for a buy. When a 20 day high is challenged for the second time having a gap of at least four days from the previous low, we can look to go short.

Rules:

  • The 20 day high must be at least four days in the past.
  • Entry must be placed 5-10 pips below the 20 day low.
  • Stop loss must be placed 1-2 pip of today’s low.
  • Aim for a take profit of 1R.

Trading examples

Buy example

Below is the chart of the EUR/USD on the Daily timeframe. Starting from the left, we can see that the market came down and made a 20 day low (indicated by the black dotted line). Now that we have the first low, we wait for the price to down to that low in more than four candles (days). And when the price spikes below the prior low and comes back up, we can hit the buy at the encircled region.

As far as the stop loss and take profit is concerned, we can keep a stop loss 2-4 pips below the low of the present candle and aim for a good 1:1 RR on this trade.

Sell example

In the below chart, the market made a 20 day high up to the black dotted line. Later, the price goes above the previous 20 days high yet again. Here, the price holds above the line and then drops below the next candle. So, once it’s below by 5-10 pips from the previous 20 days high, we can go short. And the stop loss and take profit are self-explanatory.

Conclusion

With no disrespect to the turtle trading strategy, we can conclude that this strategy can be used in both ways. This strategy is backtested and proven by a number of experienced traders. Try this strategy in your trading activities and let us know if you have any questions in the comments below. Happy Trading!