Categories
Forex Basic Strategies

Pivot Trading Strategy – Easiest Way To Trade Pivot Points

Pivot points are the significant levels used by the market technician to determine the future movement and the major support/resistance levels on the price chart. Pivot point takes the prior period high, low, and close to estimate the future support and resistance levels. Pivot points are the leading indicator, and once they are set on a price chart, it will remain the same throughout the day.

Timeframes

The pivot point of the 1, 5, 10, and 15-minute chart use the prior day high, low, and close. Whereas the pivot points for the 30, 60, and 240-minute chart use the last week high, low, and close to calculate the pivot points. Once the new week starts, the pivot point appears on the price chart until the end of the week.
The pivot point for the daily and chart use the prior month data, and the pivot point for the weekly and the monthly chart use the last year’s data. The new pivot point for the year ahead will be calculated on the 1st of January. These would be based on the high, low, and close of the last year’s pivot points.

There is a total of seven basics pivot levels on the price chart.

  1. Basic pivot level – It is the middle of the center pivot line.
  2. Resistance 1 (R1) It is the first pivot point above the centerline.
  3. Resistance 2 (R2) It is the second pivot level above resistance 1.
  4. Resistance 3 (R3) It is the third pivot level above resistance 2.
  5. Support 1 (S1) It is the first pivot level below the middle pivot line.
  6. Support 2 (S2) It is the second pivot level below support 1.
  7. Support 3 (S3) It is the third pivot level below support 2.

Trading Strategies Using Pivot Points

There are various pivot point trading strategies in the market; this one is especially we created for our fellow traders, our strategy is backtested on demo and even on trading simulation, so you no need to put the work required to find out the probability of this strategy—all we suggest you follow this strategy very well to make consistent money from the market.

Pivot points most often work very well in trending market conditions; some traders even use pivot points on lower timeframes to scalp the markets. The strategy is to find out the uptrend in any instrument and wait for the pivot point to go above the Pivot point centerline, and then wait for the pullback back to the pivot line to take buy entry. You can close your position at resistance one if the market momentum is choppy, and even in a strong trending market, you can also book the profit at resistance two or three.

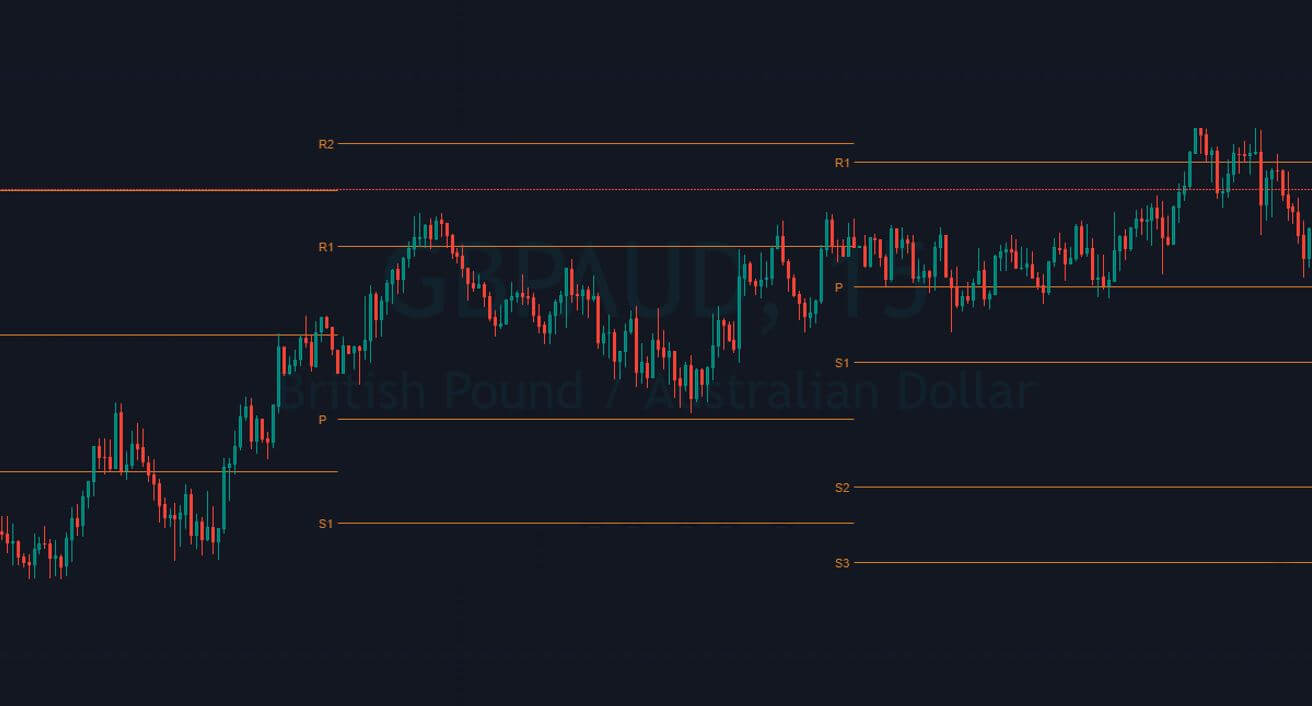
The image below represents the uptrend in the GBPAUD forex pair.

The image below represents our buying entry in this pair.  Notice that the day before our entry price action breaks the pivot line and the very next price action pullback to the pivot line. Keep in mind that the pullback must hold at the pivot line then only it confirms the buy trade, never place the limit order at the pivot line. Let the price action test the support line take entry.

The image below represents our entry, exit, and take profit in the GBPAUD forex pair. When you follow so many steps to take an entry, it means that you are going for the precision in the market, and for the precision entries, always put the stop loss just below the entry price. In the image below, notice that our stop loss was just below the pivot line, and for the take profit, we go to the R1 of the next day, which was R2 for the previous day. Take profit is an art in the market, and when you use the pivot points, it’s even easier to book profit. If the price action immediately approaches the R1, then you can expect the price action to hit the R2 or even R3. If the price action shows you the struggle to hit the R1, then simply do not expect the deeper targets.

Pivot Points + Double Moving Average

Moving average is a widely used indicator in the market which smooths out the price action by filtering out the noise from the random short-term price fluctuations. There are an infinite amount of moving averages in the market, which helps the traders to identify the market trend, entry, and exit also the potential reversals. When the moving average goes above the price action, it means that the trend is down, and when it goes below the price action, it indicates the uptrend in the security. In this strategy, we used the 30 and 15-period average to trade the market.

The trading strategy is, first of all, to find out the downtrend in any pair and wait for the prices to close below the pivot line also check the crossover above the price action on a double moving average to take an entry.

The image below represents the downtrend in an NZDCAD forex pair.

As you can see in the below image of the NZDCAD forex pair, it indicates the selling entry in this pair. In a downtrend, when the price action holds below the pivot line, it shows that the prices respect the resistance area; also, the crossover on the MA indicates the market is ready to print a brand new lower low.

The below image represents our entry, exit, and take profit in this pair. As you can see, the entry was when prices hold below the pivot line, and the stops were just above the pivot line because the holds below show that the buyers hold no power to break above the pivot line. After our entry, price action strongly blasts to the north, which shows that we can expect our trade to travel even longer. Price action holds for some time at the S1, and then it immediately blasts to the S2 and prints the brand new lower low.

Conclusion

Pivot points are the leading indicator in the industry, which provides a glance at potential support and resistance level in the market. These levels are useful for taking an entry, or it can be useful for putting stop loss or for booking profit also. AS the leading indicator, you can use them all alone to trade the market, or you can pair them with some other indicator to trade the market. The critical benefit of pivot points is they work on all the financial markets also on all the trading timeframes. Try not to use this indicator in the ranging conditions and also avoid the use in the highly volatile markets.

Categories
Forex Basic Strategies

Pairing Significant S&R Levels With RSI Indicator To Generate Accurate Trading Signals

Introduction

In the previous set of articles, we discussed strategies based on trend continuation or trend reversal. Let us change the subject a little bit and discuss a strategy based on ‘Support and Resistance.’ Although we all know how to trade support and resistance, there is always a problem of consistency when it comes to trading using the conventional support and resistance strategy. We have a look into some of these issues by designing a strategy that provides not only decent risk-to-reward (RR) but also a high probability of success.

Markets are continually changing due to changes in market participants, global politics, and economic events. This means if we continue to trade the usual way, we could be in trouble. It is necessary that, along with markets, we, too, change our trading strategy in order to adapt to the changing market environment.
Time Frame

The strategy works well on the 1-hour, 4-hour, and ‘Daily’ time frame. Therefore, the strategy is suitable for the swing to long-term traders.
Indicators

We make use of only one technical indicator in the strategy, and that is the Relative Strength Index (RSI) with its default settings.
Currency Pairs

The strategy is suitable for trading almost all currency pairs listed on the broker’s platform. One thing we need to ensure before choosing a currency pair is that it should be volatile.

Strategy Concept

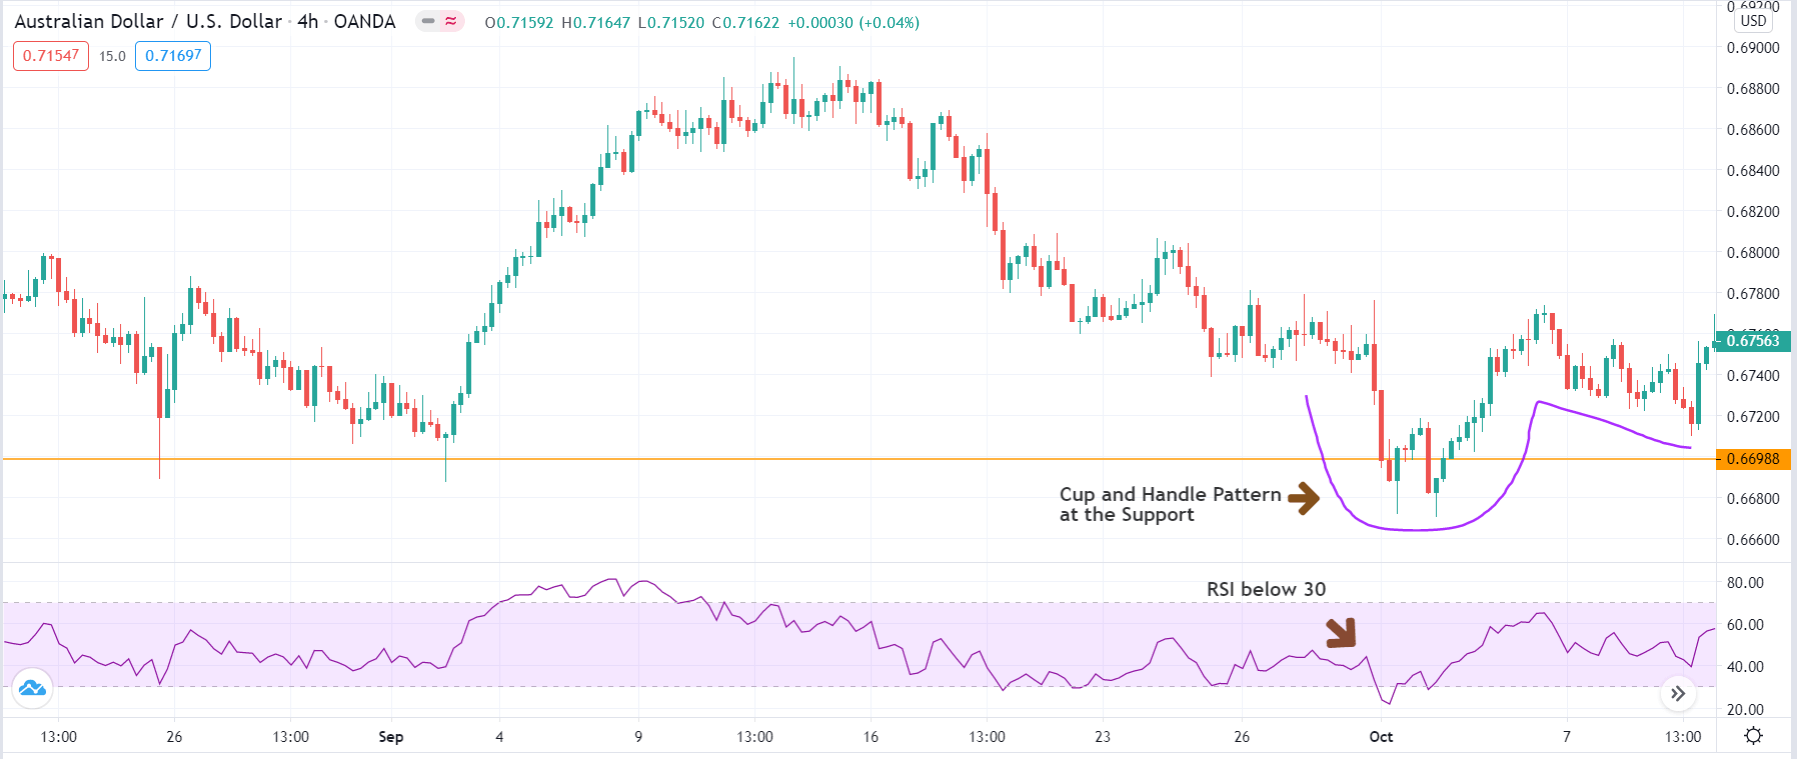
‘Cup and Handle’ is a powerful candlestick pattern that shows the prevalence of bullish strength in the market. It is a very reliable pattern that offers excellent trading opportunities. ‘Cup’ formation indicates that the price was unable to make a proper ‘lower low’ on the higher time frame due to a strong buyer who took the price up. The ‘handle’ indicates that the market was unable to reach the previous ‘low’ due to weak sellers where eventually buyers bought at a higher price and are in the process of making a new ‘higher high.’

The logic behind the formation of the ‘Cup and Handle’ pattern makes it one of the most powerful patterns. But the pattern alone is not the basis for the strategy; we also use the RSI to take the highest probability trades. We apply the concept of ‘Cup and Handle’ pattern and RSI indicator at a long-term ‘Support’ level to execute low-risk ‘long’ trades.

The same concept applies when taking ‘short’ trades at long-term ‘Resistance’ level. Here we should look for the formation of the ‘Inverse Cup and Handle’ pattern at ‘Resistance.’ ‘Cup’ here indicates that the price was unable to make a proper ‘higher high’ on the higher time frame due to strong seller who crashed the price. The ‘handle’ indicates that the market was unable to reach the previous ‘high’ due to weak buyers where eventually sellers sold at a lower price and are in the process of making a new ‘lower low.’ We use the RSI indicator to take the highest probability trades by looking for ‘overbought’ and ‘oversold’ situations in the market.

Trade Setup

In order to use the strategy, we have considered the 4-hour chart of AUD/USD, where we will be illustrating a ‘long’ trade using the rules of the strategy.

Step 1:
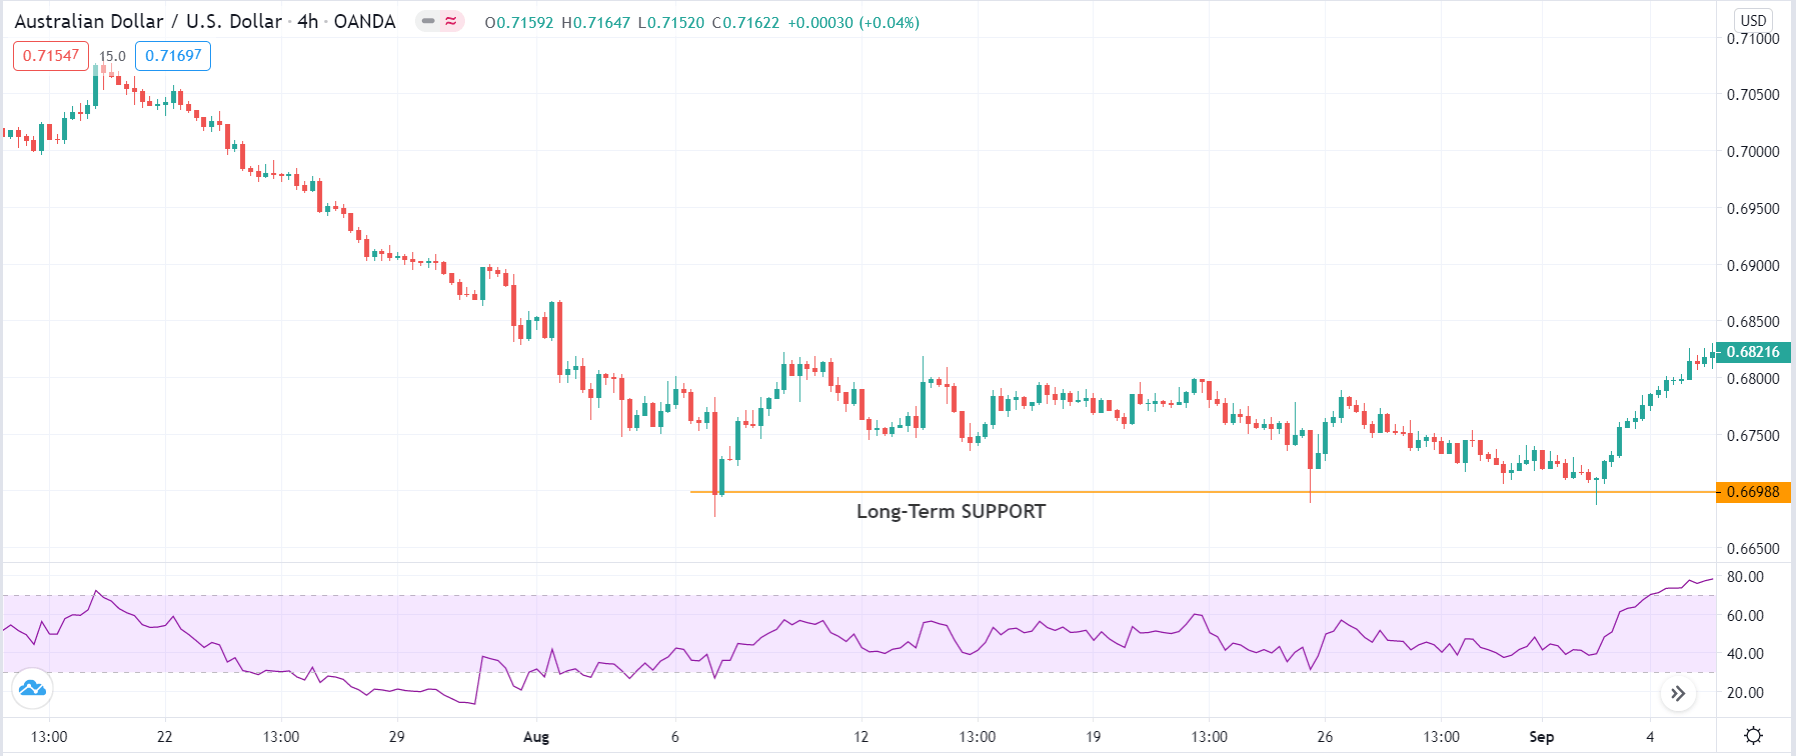
The first step is to identify long-term support and resistance levels. By long-term we mean, support and resistance levels on the 1-hour time frame and above. Note that the greater number of touches, the stronger is the support or resistance. We would recommend at least three touches at the support or resistance to calling it a strong one. To raise the odds in our favour, we can look for trading at support level in an uptrend and resistance in a downtrend.
The below image shows long-term support being formed in the AUD/USD pair on the 4-hour chart.

Step 2:
Once we have identified the critical technical level, we will wait for the price to present the ‘cup and Handle’ pattern at support and ‘Inverse Cup and Handle’ pattern at resistance. Here we should make sure that when the price at support, the RSI indicates an oversold (below 30) situation in the market at least once and then shows up the pattern. On the other hand, when the price is at resistance, the RSI should cross above the level of 70, indicating an overbought situation and then show up the ‘Inverse cup and handle’ pattern.

Step 3:
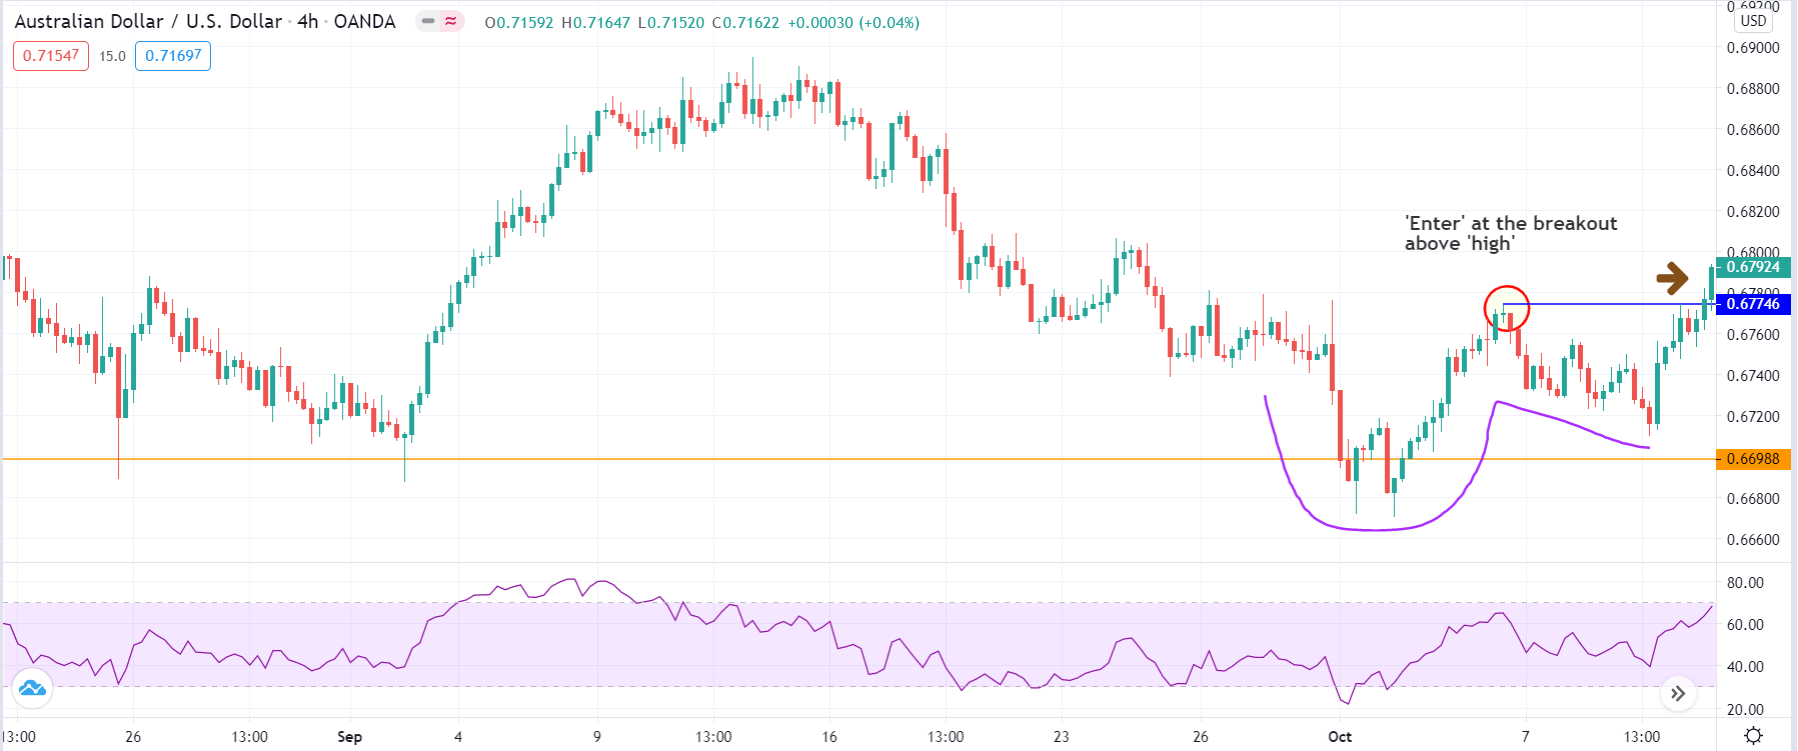
After ensuring that the pattern is formed at the right place along with suitable indications from the RSI, we now discuss how to enter the trade. In a ‘cup and handle’ pattern, we enter ‘long’ right at the price break out above the ‘high’ of ‘cup’ pattern. In an ‘inverse cup and handle’ pattern, we enter ‘short’ when ‘price’ breaks below the ‘low’ of the ‘cup’ pattern.
The below image shows an example of we enter for a ‘buy’ at ‘support.’

Step 4:
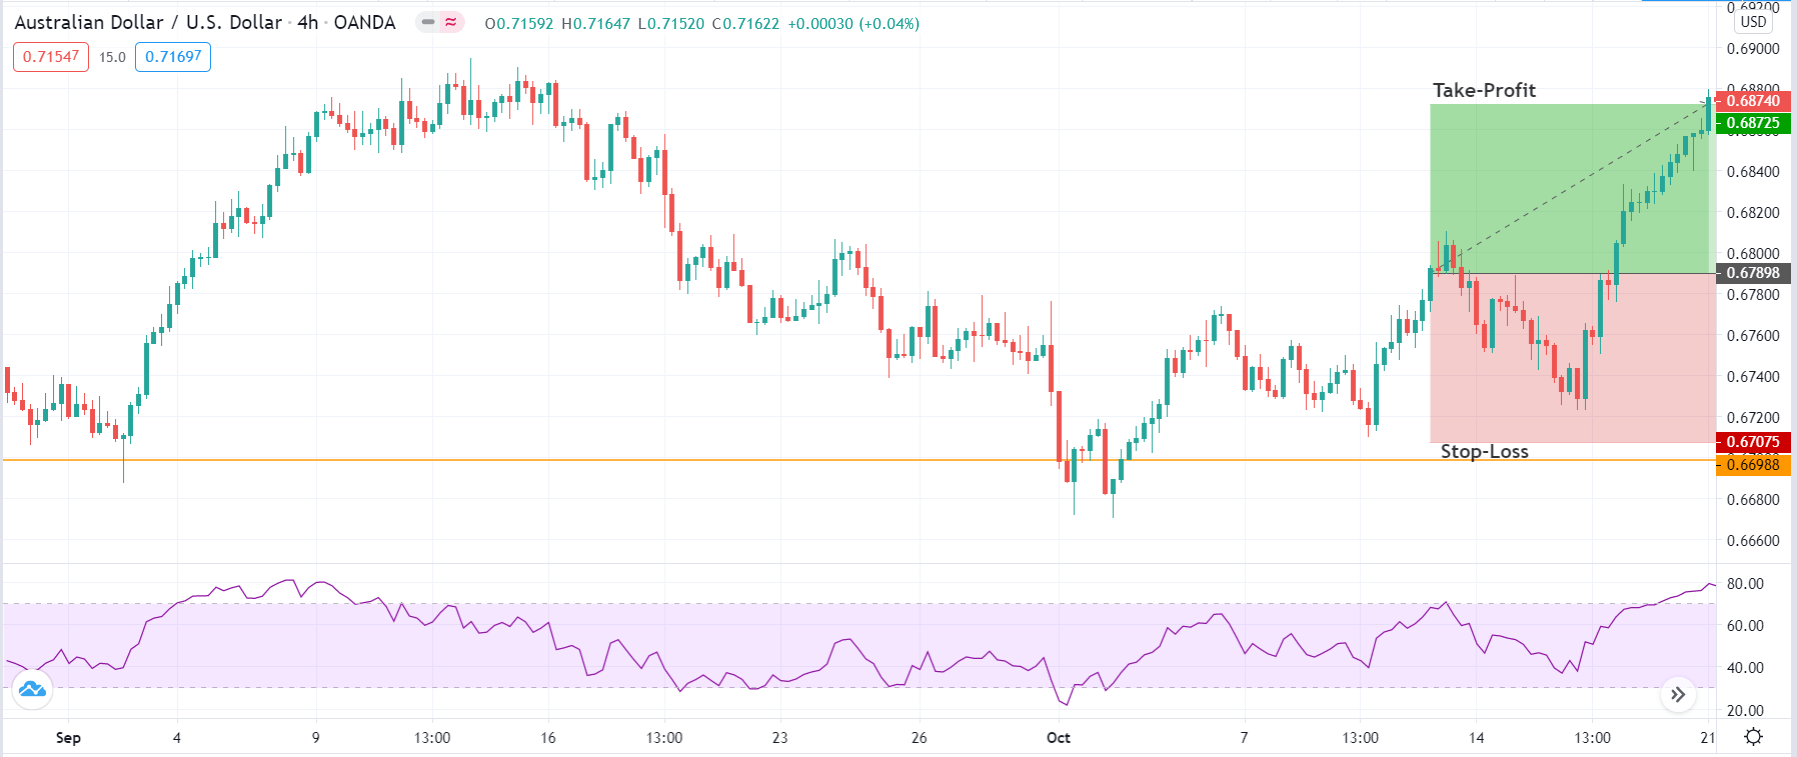
After entering, it is essential to determine the stop-loss and take-profit levels for the trade. One of the primary reasons behind low risk-to-reward (RR) ratio is late ‘entry.’ Stop-loss is placed below the ‘low’ of the ‘handle’ pattern in a ‘long’ position and above the ‘high’ of the ‘handle’ pattern in a ‘short’ position. The strategy essentially says to enter when prices have travelled a decent amount of distance from support or resistance, which considerably reduces the risk-to-reward (RR) ratio.
The below image shows the result of the trade executed using the above strategy where the resultant risk-to-reward (RR) of the trade is 1:1.

Strategy Roundup

Although the ‘Cup and Handle’ pattern is a bullish continuation pattern, if we understand the logic of the pattern and apply at key technical levels, it can provide excellent opportunities for short as well as long-term traders. Using the RSI indicator along with the pattern gives an extra edge to the strategy, which makes it highly suitable in changing market environment.

Categories
Forex Course

100. Leading and Lagging Indicators: How are they different from one another?

Introduction

When getting started with trading, the first things people look out for are indicators. Indicators exist in both technical analysis and fundamental analysis. The difference between the two beings, fundamental indicators indicate or predict a long-term trend while technical indicators predict or confirm a short-term trend.

One of the best forms of analyzing the markets is by using indicators, as it helps interpret the trend in the market and also the opportunities available in them. Indicators are of two types, namely, leading indicators and lagging indicators. The former one is used to predict the future trend while the latter is used to confirm a trend.

What is a Leading Indicator?

It is a type of technical indicator that forecasts future prices in the market using past prices. That is, when the indicator makes its move, the prices follow a similar move. These indicators lead the price; hence they are called leading indicators.

However, never there is a 100 percent surety that the price will move in the direction as predicted by the indicator. Yet, traders can get their ideas from the indicators, see how the market unfolds, and then act accordingly.

What is a lagging indicator?

A Lagging indicator is also a technical indicator that uses past prices and confirms the trend of the market. It does not predict future price movements. Basically, it follows the change in the prices.

Classifying Indicators

There are five types of indicators in technical analysis. Let’s put these indicators in the right bag.

Trend indicators – It is a lagging indicator to analyze if the market is moving up or down.

Mean reversion indicators – A lagging indicator that measures the length of the price swing before it retraces back.

Relative strength indicators – It is an oscillator which is a leading indicator that measures the buying and selling pressure in the market.

Momentum indicators – This leading indicator evaluates the speed with which the price changes over time.

Volume indicators – could act as a leading or a lagging indicator that tallies up trades and quantify the buyers and sellers in the market.

Examples of leading indicators

The widely accepted and used leading indicators include:

  • Fibonacci Retracement
  • Donchian channel
  • Support and Resistance levels

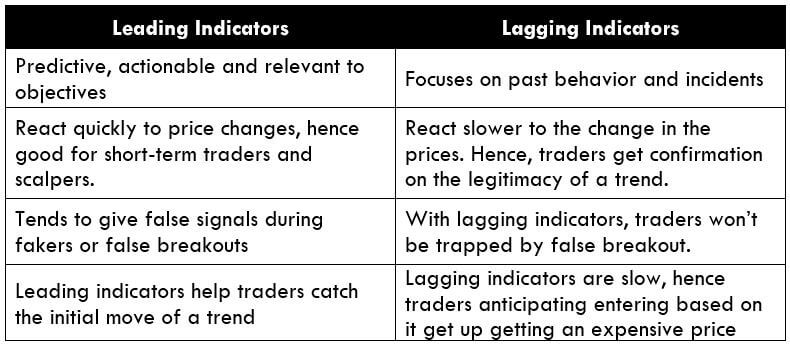
Difference between Leading and Lagging Indicators 

Conclusion

All novice traders are in the hunt for the so-called “best indicator” in trading. But there is no such thing as ‘best’ indicator. Every indicator is a useful indicator if applied in the right way. For instance, we cannot use a trend indicator to predict the future of the market and then undermine that it does not work. Instead, one must understand the category under which an indicator falls and then use it accordingly.

I hope you were able to comprehend the types of indicators and the difference between them. In the next lesson, we shall apply some of the indicators into the real market and test them.

[wp_quiz id=”70435″]
Categories
Forex Course

64. Trading Support & Resistance Levels Using Fibonacci Levels

Introduction

In the previous lessons, we understood how to use the Fibonacci tool to trade the pullback of a trend. We have also learnt how these Fib levels are not foolproof. Now, in this lesson, let’s extend this discussion to see how the Fibonacci tool can be used in conjunction with Support and Resistance – arguably the most critical levels on a price chart.

Support is the area where the price rejects to go down and bounce back further. This area acts as a floor where the price gets stopped. Resistance is the opposite of Support. At this level, the price finds it very hard to go up as it acts as a ceiling. The general idea is to buy at the Support and sell at Resistance. But blindly buying and selling at these levels carry huge risk as there is no guarantee that these levels will work each time.

So let’s use Fibonacci levels to determine the working of these S&R levels. Basically, we are combining both Support Resistance and Fib levels to increase the accuracy of trading signals generated. Let’s get started.

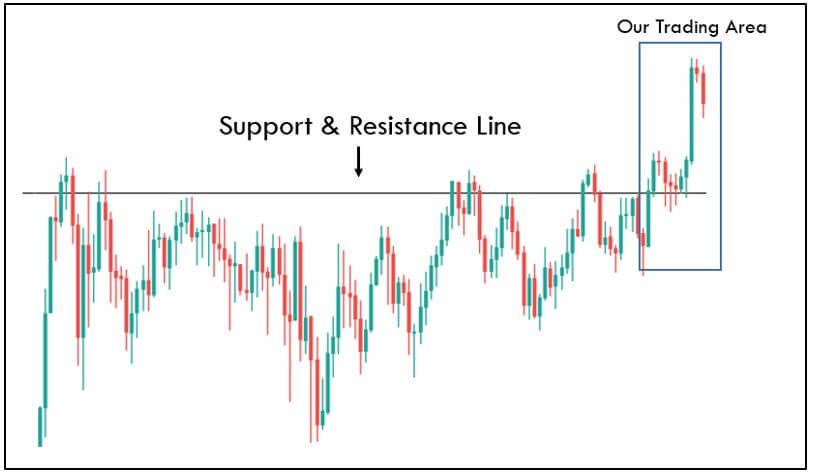
In the below chart, we have identified a strong resistance area, and now we must wait to see if it creates an area of Support after breaching the Resistance. It is always advisable to buy at ‘resistance turned support.’ Also, if the price has broken a strong resistance with multiple touches, there is a higher chance of it turning into Support. At the marked region below, we can see the price breaking the strong resistance area.

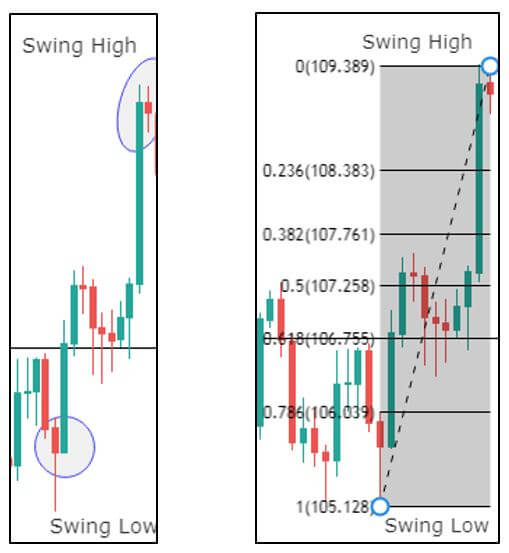
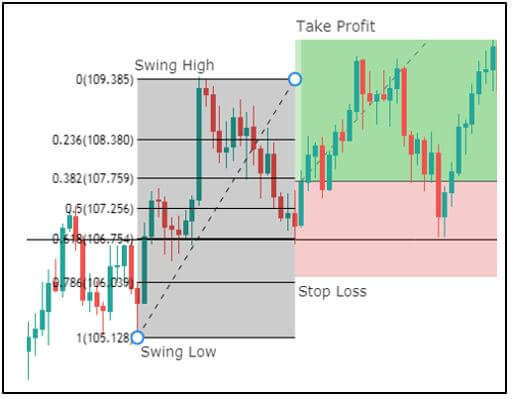
In the marked regions below, we can see the price retracing after breaking the Resistance. So in order to combine this support resistance level with Fib levels, we must identify the swing low and a swing high. As we can see below, we have also plotted the Fibonacci levels on the chart using a Fib indicator.

Ideally, if we get a retracement at the 61.8% Fib level and a confirmation candle, we can confidently enter for a buy. If the market does not react at any of the Fib levels, this could be a sign that the Support is no longer strong, and it can be broken.

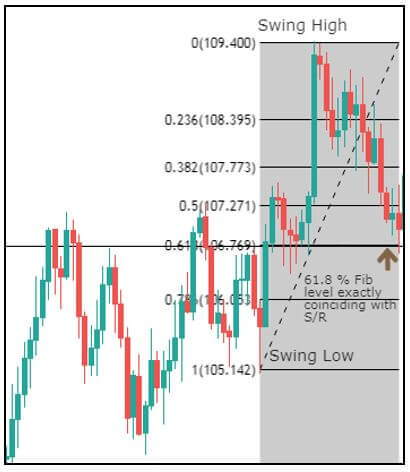
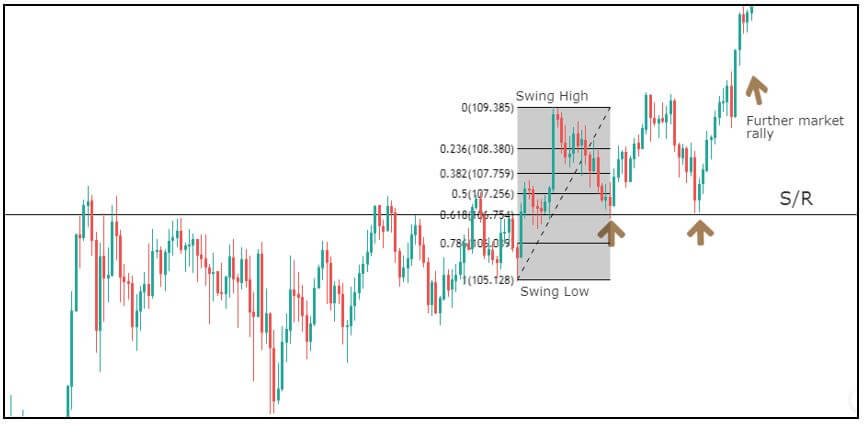
As per the theory of Support and Resistance, the market must react at the previous Resistance and bounce off. From the below chart, it is clear that the retracement has reached our S/R line, which is exactly coinciding with the 61.8 Fib level. Now it is a clear indication for us to go long once we see a confirmation candle.

In the below chart, we can see that the price has exactly bounced off from the 61.8% Fib level and printed a bullish candle giving us a confirmation sign. Right after the confirmation candle, we can place our buy trade with a stop-loss at 78.6% Fib level and take-profit anywhere near the high.

Further, in the below chart, we can see the market making higher highs breaking the previous resistance levels. From this trade, we learn that, when Fibonacci is used near S/R as a confirmation tool, it increases the odds of that level performing. The price will surely take Support at the Fib levels and continue its trend.

One can notice that the ‘buy’ happens precisely at the 61.8% Fib level near Resistance turned support line. The market continues to take Support at this level until, eventually, it breakouts on the upside. This shows the power of the Fibonacci indicator when combined with S&R levels.

There are many other credible indicators that are reliable and can be combined with S&R levels. But Fibonacci is one of the most used ones by the traders across the world.

[wp_quiz id=”64461″]
Categories
Forex Course

59. Trading The Candlestick Charts Using Support and Resistance Levels

Introduction

In the previous few lessons, we have discussed many candlestick patterns and how to trade them. Those basics are very important for us to master Technical Analysis. Before leaving the Candlestick topics, let’s discuss THE most important concept in technical trading i.e., Support & Resistance. We shall first understand what Support and Resistance are, and will learn how to trade them on the Candlestick charts.

What Is Support?

Support is the level at which the price finds it difficult to fall below. Eventually, the price will bounce back up at this particular level. The support level acts as a floor that restricts price action to go down further. Some technical traders describe ‘Support’ as an area where demand overcomes supply. Because at this level, the demand for any currency will be more, hence the selling stops, and buying continues. The price reaction of any given asset would look something like the image below at the Support level. We can clearly see the price bouncing back up once it reaches the support level. (Blue Line = Support Level)

What Is Resistance?

Resistance is just the opposite of the support level. It is the level where price finds it difficult to break through to rise above until it is pushed back down. It acts as a ceiling restricting the price action to go up further. Basically, it is an area where supply overcomes demand. The price reaction of any underlying currency at a resistance looks something like the image below. We can see the price reaching the resistance line many times but unable to break through it. We must remember that at any point, Support can turn into Resistance and Resistance can turn into support. Hene, it is called S&R.

Pairing candlesticks with S&R

The fundamental method of technical trading is to buy at Support and Sell at Resistance. But this does not always work as there is no sure shot assurance that the Support and Resistance levels will hold for long. Hence traders need to look at other important factors while trading at Support and Resistance.

When buying near Support, we must wait for the consolidation at that area and only buy when the price breaks above that small consolidation. In that way, we can be sure that the price is respecting that level and is starting to move higher. The same concept applies when selling at resistance. Wait for consolidation and then enter a short trade when the price drops below the low of the small consolidation.

Below is an example of a short trade.

After entering the trade, make sure to place the stop-loss just below the low and above the high of Support & Resistance, respectively.

According to technical analysis principles, if a Support level or Resistance level is broken, their role is reversed, i.e., Support becomes Resistance and Resistance becomes Support. The psychology behind this phenomenon is that, when price breaches a key area, some will get out, and some hold on to their trades to see what happens. When price retraces back to the key area, people who have held it, go out and making the price bounce at the previous Support and Resistance.

Conclusion 

Traders always suspect a reversal at the key Support and Resistance as there is a high probability that price will reverse at these key levels. Some traders who had open positions exit at these price levels and others initiate new positions at these levels, depending on which side the price are they. Support and resistance levels are psychological levels at which many traders place orders to buy (support) or sell (resistance) making them supply or demand levels. That is why it is crucial to learn about Support and Resistance.  Also, support and resistance levels can be identified more easily using candlesticks, as a candle is very graphical, displaying wicks when the price bounces back from bottoms or tops. Identifying these significant levels forms the basis for Technical Analysis. Cheers!

[wp_quiz id=”61918″]
Categories
Forex Basic Strategies

Trading Price Channels Like A Professional Forex Trader

Introduction

One of the most important characteristics of price in the Forex market is that it moves in the form of channels 20-25% of the time. So it is crucial to learn how to trade the market when it is in this state. The price channel strategy that we are going to discuss is intuitive and most straightforward. In this article, we will see how to implement this strategy and take profitable trades while reducing risk at the same time. Let’s get right into it.

What is the price channel pattern?

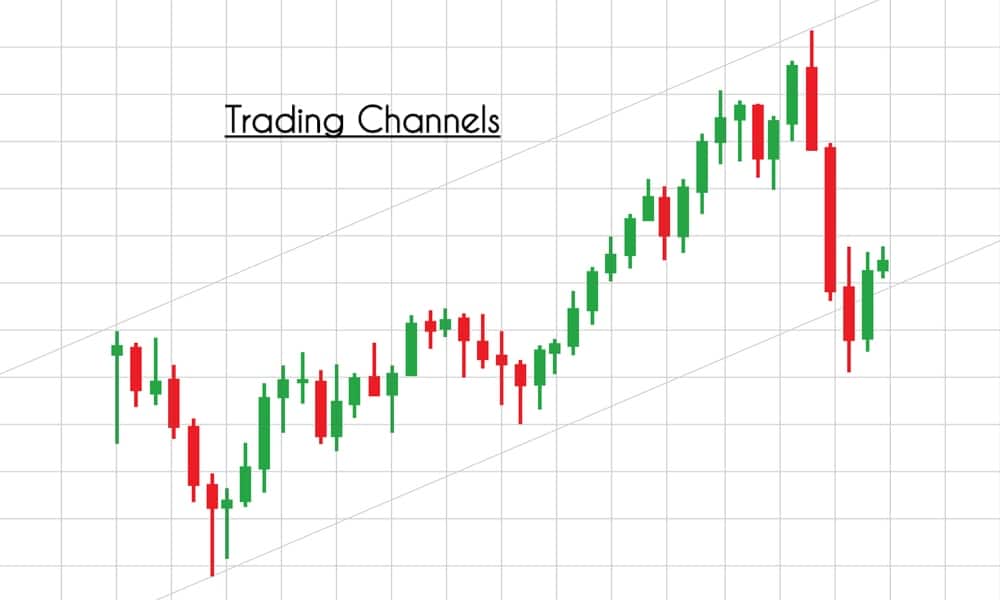
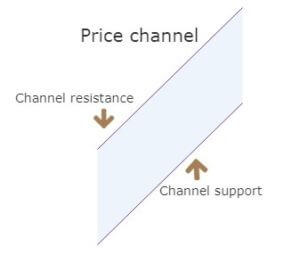
Before exploring the strategy, we need to know what a price channel means and the different types of channels. The price channel represents two trend lines drawn above (channel resistance) and below (channel support) the price. The price moves within these two trend lines.

The width of the channel should be big enough if you want to trade inside it. In this case, a simple trade would be to buy at channel support and sell at the channel resistance level.

However, the most significant opportunity is to trade the channel breakout.

We can distinguish the channel into two types:

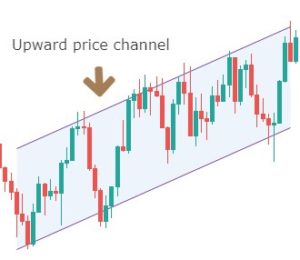
  • Upward price channel
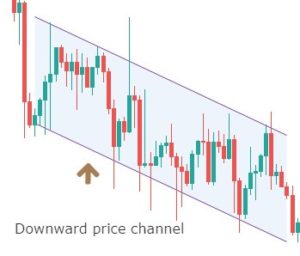
  • Downward price channel

An upward price channel occurs when price makes higher highs and higher lows. More the number of touches the price makes to channel’s support and resistance, stronger is the channel.

A downward price channel occurs when the price makes a series of lower lows and lower highs. The trend line should be able to connect to these points; only then we can call it a channel.

This represents the consolidation or ranging zone. Here the market bounces on and off between the two support and resistance lines.

If you understand the psychology and reason behind the formation of a price channel, it can save you a lot of losing trades. The reason why channel breakout is so significant is that many traders trade inside the channel. They place their stop loss above or below the price channel pattern.

As more and more traders start placing their stops, they will eventually be targeted by smart money. One needs to remember that a price channel won’t last forever. Breakout in any form is inevitable.

So, now, let’s see what the price channel strategy is and how to trade it effectively. This strategy is independent of technical indicators and does not make use of it (except for taking profits). Hence, there is no prior knowledge of technical indicators is required.

Price channel strategy

Recognize the early signs of a price channel breakout, as this will help you make better decisions. This strategy is based on such breakout signs, so knowing about them in advance is an advantage.

Here are the various steps involved in the strategy. We will be taking the example of a sell trade.

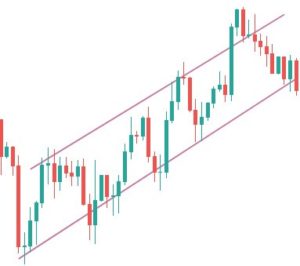
Step 1: Draw an upward channel

The upward channel should be constructed in such a way that it should connect at least two higher highs and higher lows. You can also make use of the price channel tool, which is provided by most trading platforms to connect the highs and lows.

Before the breakout, we need to make sure of an important rule, which brings us to the next step.

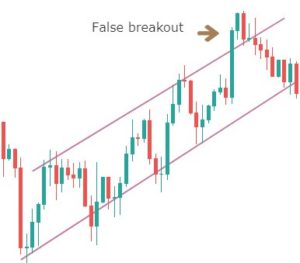
Step 2: For an upward channel, look for a false breakout above the channel resistance.  

In the case of an upward channel, the first warning would be the price failing at the resistance and giving a false indication that the price has broken above resistance.

Only this strategy makes use of this powerful price reading technique. It is in this unique style that we have developed this strategy. The failed attempt at the top is a sign of ‘stop-loss hunt’ by large players, which is confirmed when the price comes back to the channel support.

Note – The more times a ‘swing high‘ tries to get violated and fails, the stronger will be the breakdown.

Step 3: Wait for the breakdown and confirmation

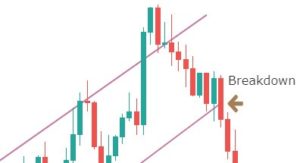
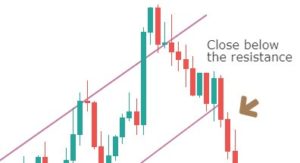
A mistake that most traders do is that they don’t wait for a confirmation signal after the breakdown happens. For this strategy, the confirmation is to wait for the breakdown candle to close below the channel support. Before this, wait for the breakdown and then look for confirmation.

The closing of the candle should be like one in the below figure.

So, don’t just sell after the support is broken. Instead, see that the breakdown candle closes below the price channel. This is an effortless way to avoid false breakdown signals.

Note – If the breakdown candle is decisive, it’s good, but not mandatory.

Then what is the exact point of entry? This brings us to the fourth step of the strategy.

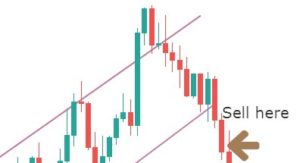
Step 4: Sell right at the closing candle

The entry technique of the strategy is quite simple. A sell order can be executed at the breakdown candle closing price.

Now you can be confident in taking the trade, as you have done everything right until now. The next logical thing to do is to determine where to take profits and place the protective stops.

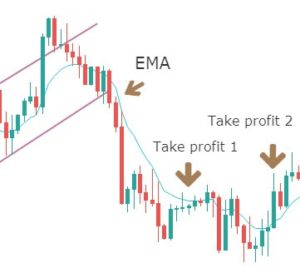
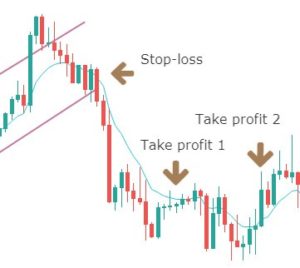
Step 5: Take 50% profit at consolidation near EMA and rest 50% after price crosses above the EMA. The stop loss has to be placed above the channel support.           

We will be taking profits based on EMA plotted on our chart. Our first potential take profit zone is when the price starts to consolidate near the EMA and touches the line multiple times, as this means that the trend might be coming to an end.

The second potential take profit zone is when the price crosses above the EMA, signaling a reversal of the current trend.

Next, we need to establish our stop-loss.

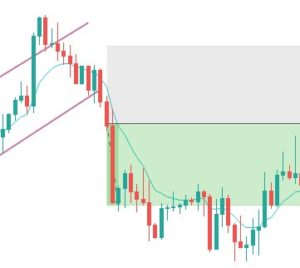
The stop-loss is placed right above the price channel support, which was broken. Stop-loss can also be extended up to price channel resistance to give more room for the price.

Finally, the trade would look something like in the below figure. This trade will result in a risk to reward ratio of 1:1 minimum. However, if you are patient enough to wait for the trend to continue, the RRR can be increased.

Note – The above trade is an example of a sell trade. The same rules apply for a ‘buy trade,’ but in reverse, as this time, you will be using a downward price channel.

Bottom Line

The price channel strategy can be used in any kind of market. It can also be incorporated into your current strategy to bring a new dimension to price action trading. If you are good at spotting price patterns and money management, this strategy can make huge profits. Happy Trading!