Introduction
In the previous set of articles, we discussed strategies based on trend continuation or trend reversal. Let us change the subject a little bit and discuss a strategy based on ‘Support and Resistance.’ Although we all know how to trade support and resistance, there is always a problem of consistency when it comes to trading using the conventional support and resistance strategy. We have a look into some of these issues by designing a strategy that provides not only decent risk-to-reward (RR) but also a high probability of success.
Markets are continually changing due to changes in market participants, global politics, and economic events. This means if we continue to trade the usual way, we could be in trouble. It is necessary that, along with markets, we, too, change our trading strategy in order to adapt to the changing market environment.
Time Frame
The strategy works well on the 1-hour, 4-hour, and ‘Daily’ time frame. Therefore, the strategy is suitable for the swing to long-term traders.
Indicators
We make use of only one technical indicator in the strategy, and that is the Relative Strength Index (RSI) with its default settings.
Currency Pairs
The strategy is suitable for trading almost all currency pairs listed on the broker’s platform. One thing we need to ensure before choosing a currency pair is that it should be volatile.
Strategy Concept
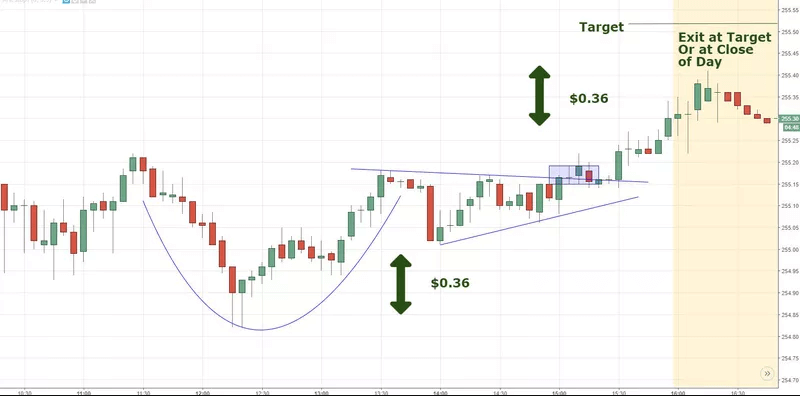
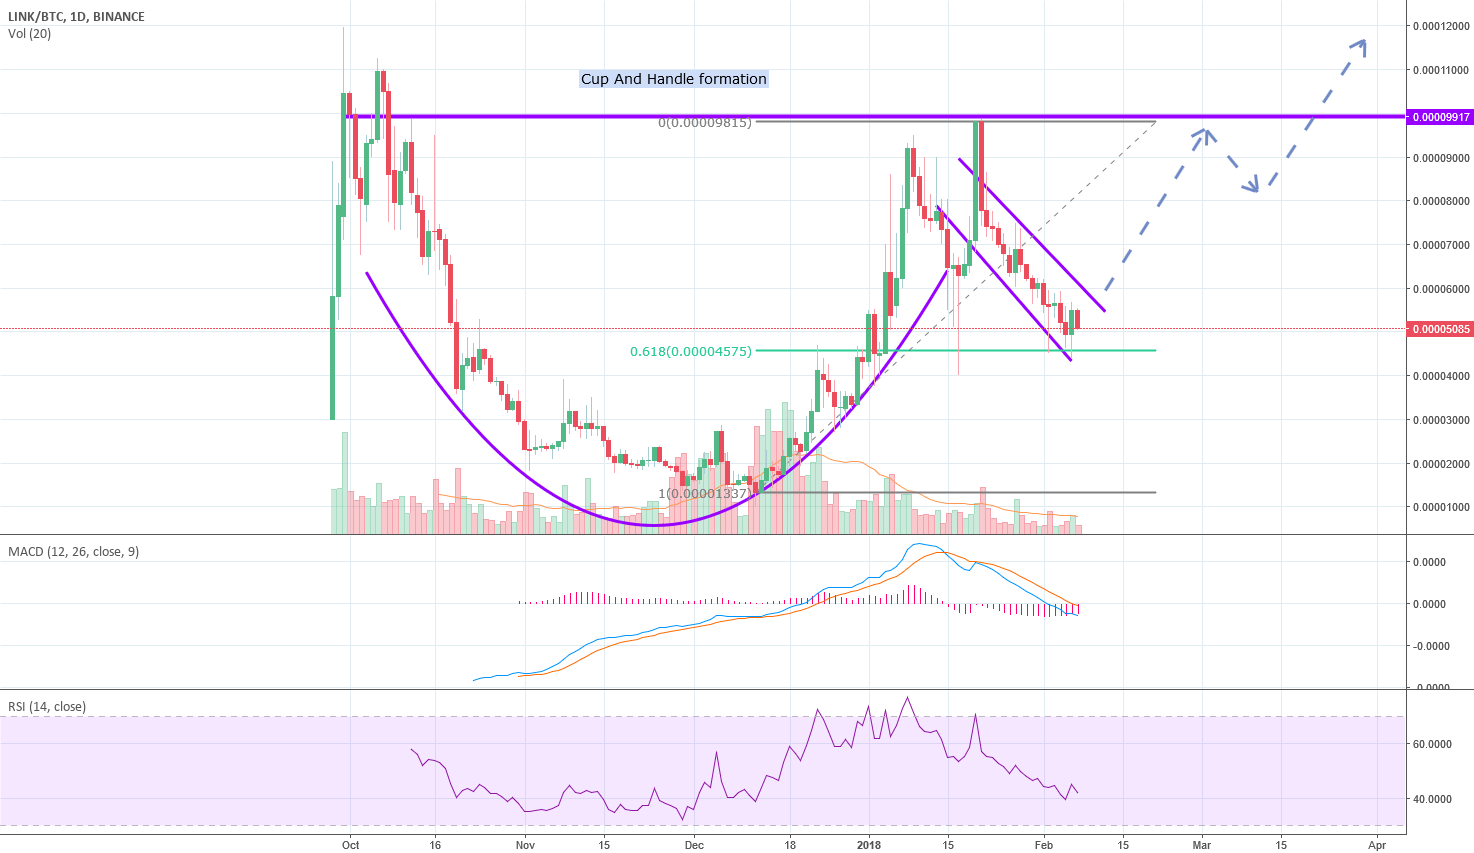
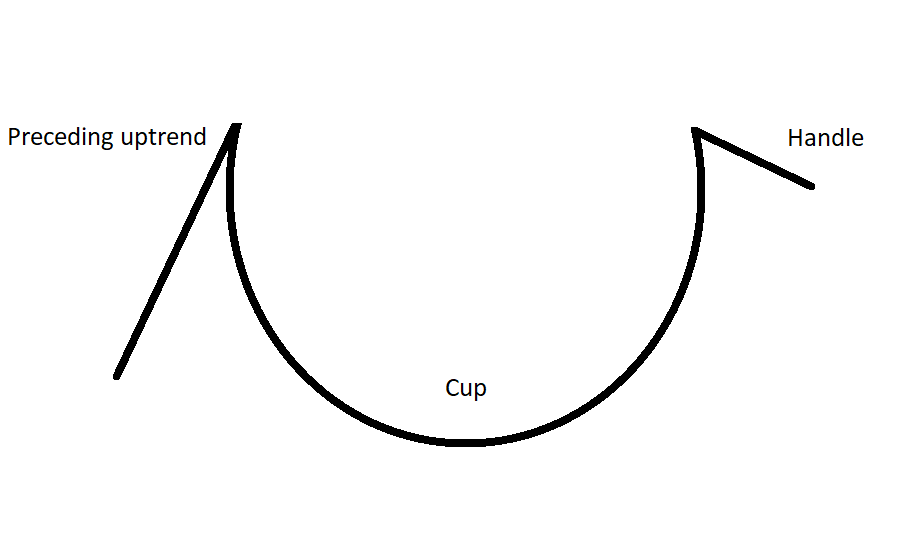
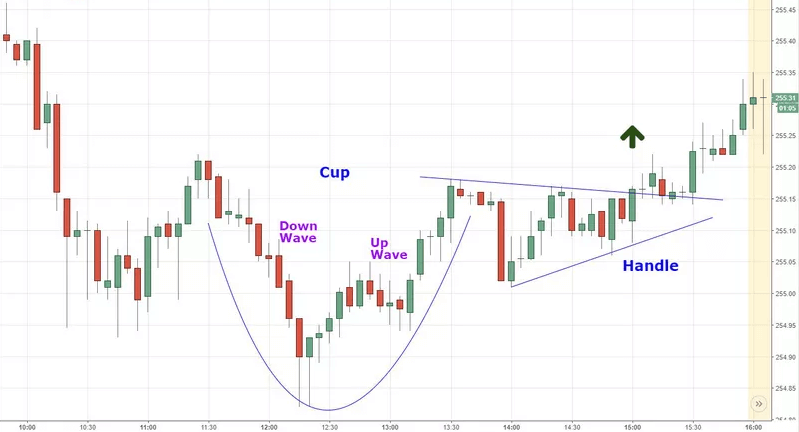
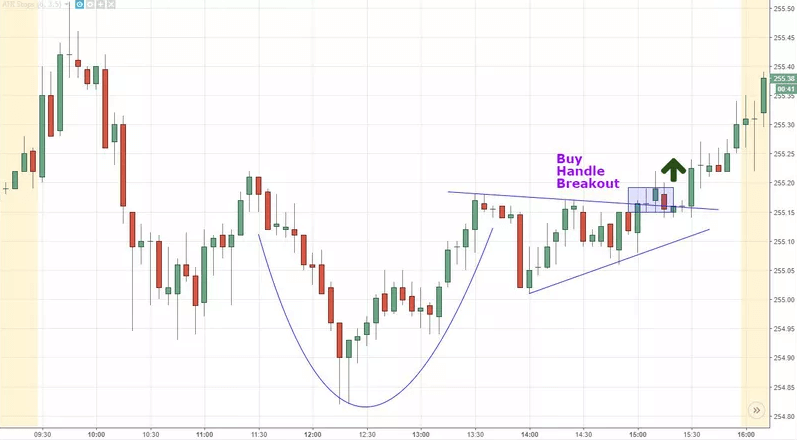
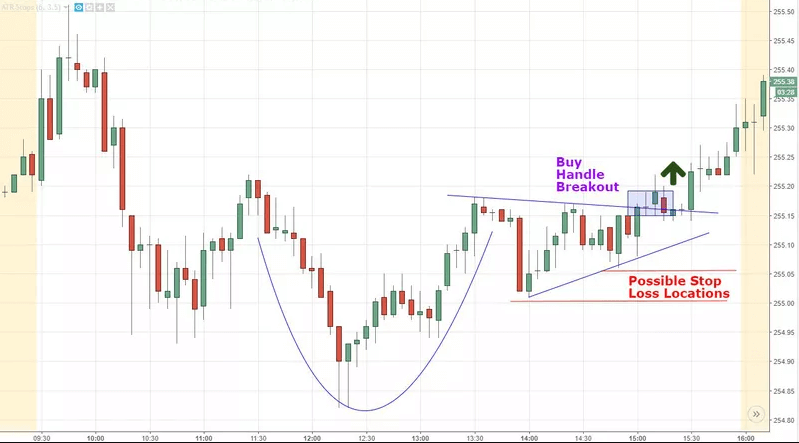
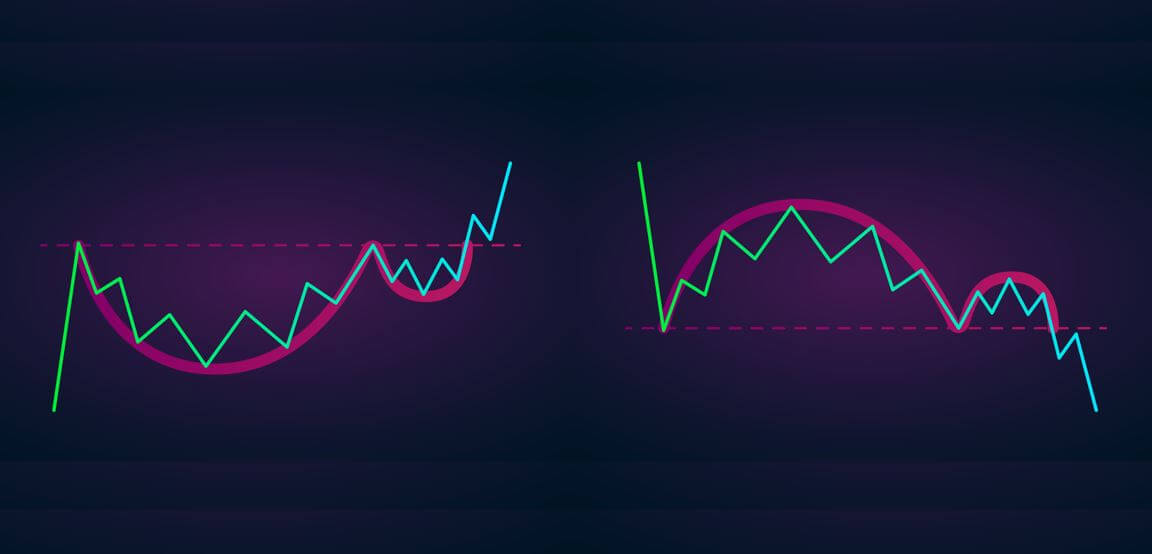
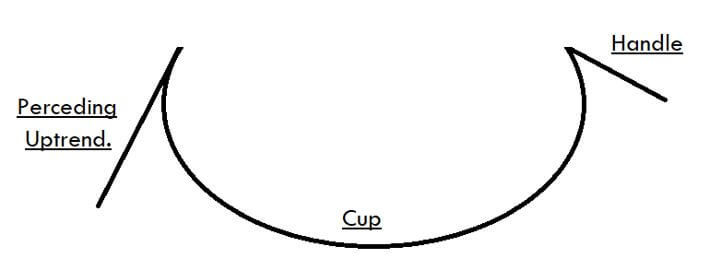
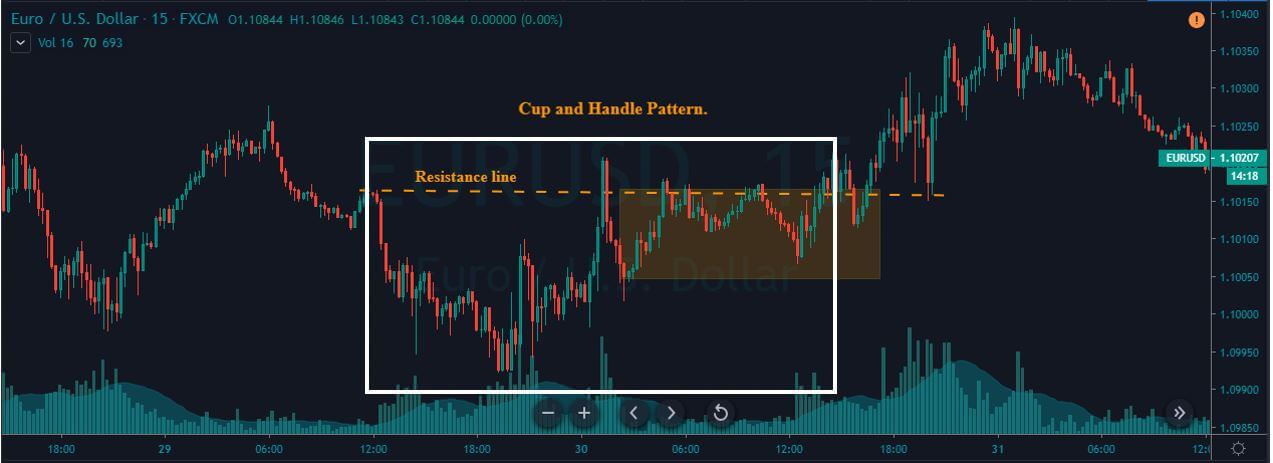
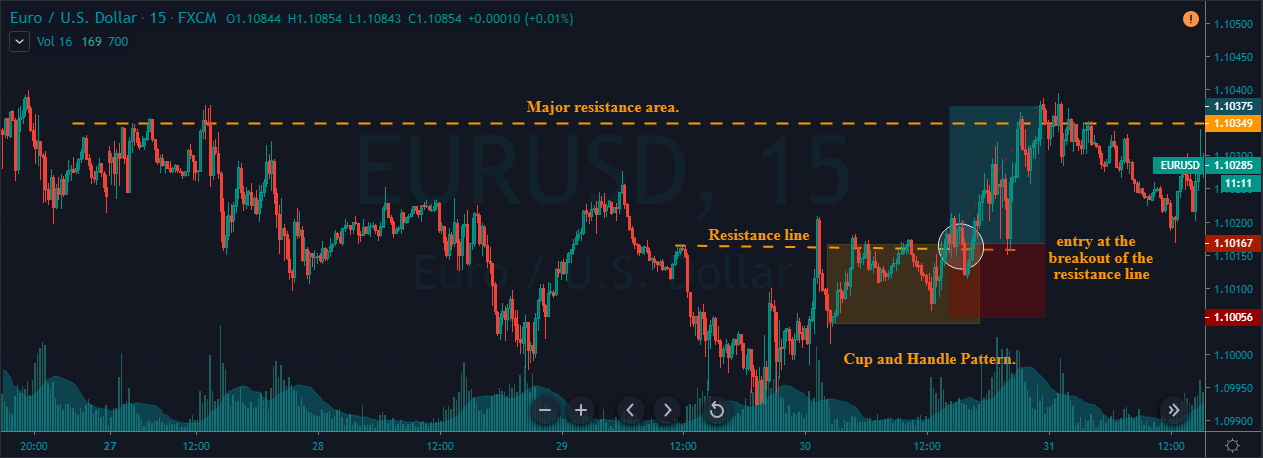
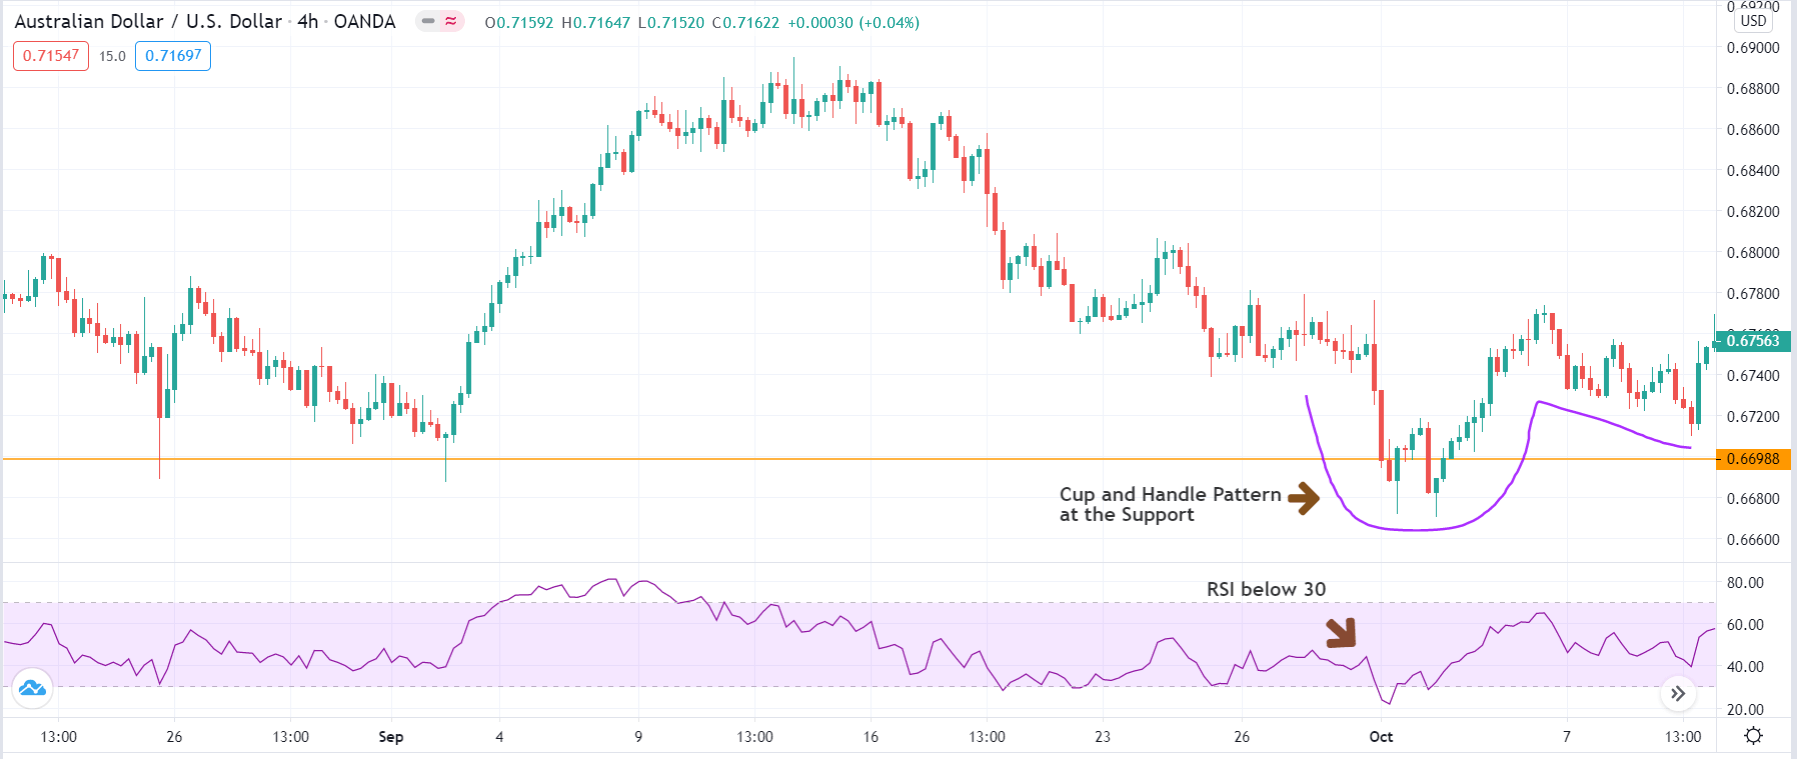
‘Cup and Handle’ is a powerful candlestick pattern that shows the prevalence of bullish strength in the market. It is a very reliable pattern that offers excellent trading opportunities. ‘Cup’ formation indicates that the price was unable to make a proper ‘lower low’ on the higher time frame due to a strong buyer who took the price up. The ‘handle’ indicates that the market was unable to reach the previous ‘low’ due to weak sellers where eventually buyers bought at a higher price and are in the process of making a new ‘higher high.’
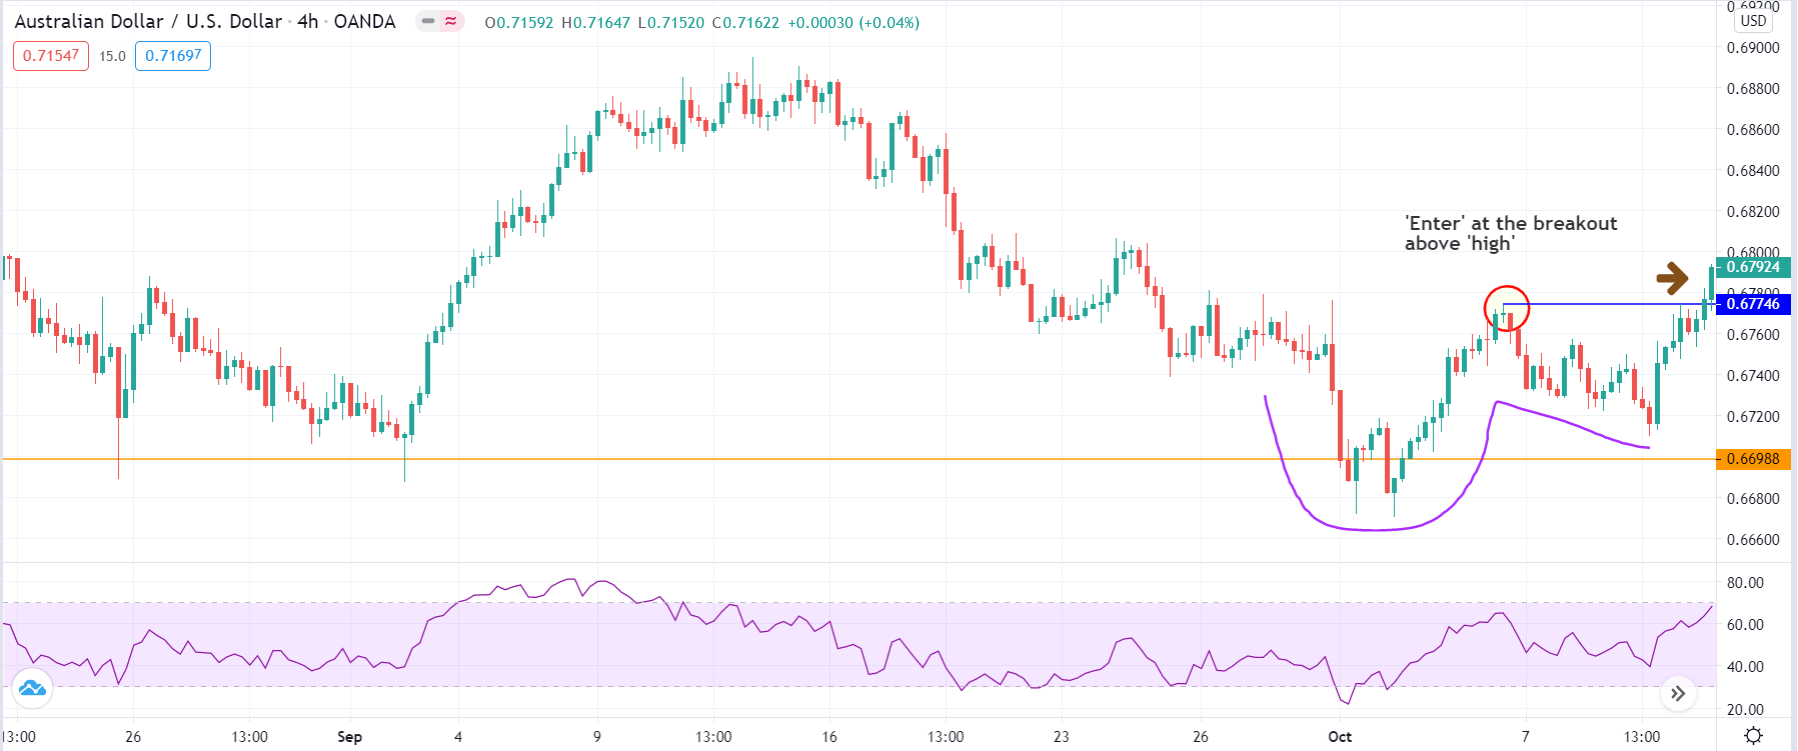
The logic behind the formation of the ‘Cup and Handle’ pattern makes it one of the most powerful patterns. But the pattern alone is not the basis for the strategy; we also use the RSI to take the highest probability trades. We apply the concept of ‘Cup and Handle’ pattern and RSI indicator at a long-term ‘Support’ level to execute low-risk ‘long’ trades.
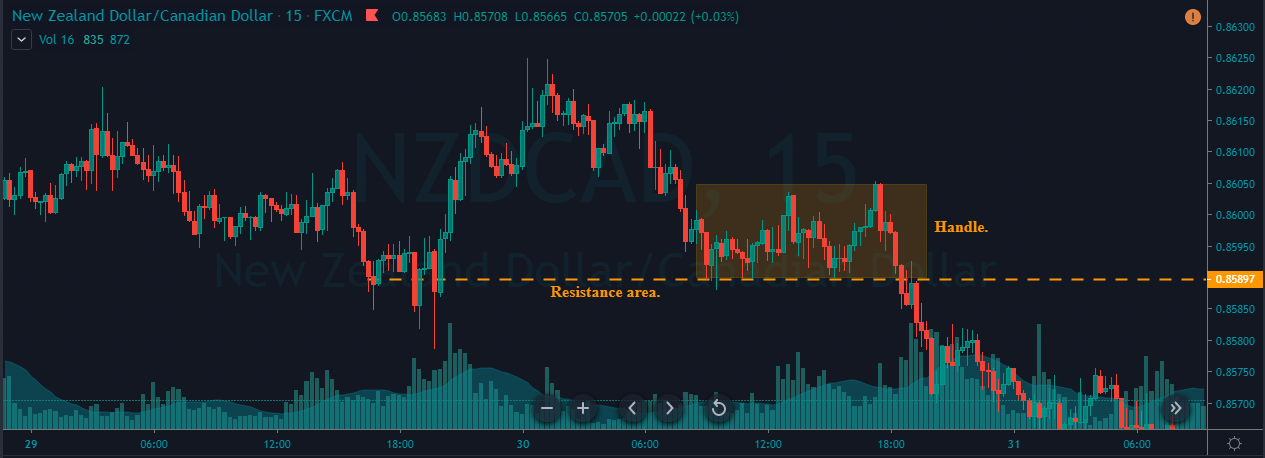
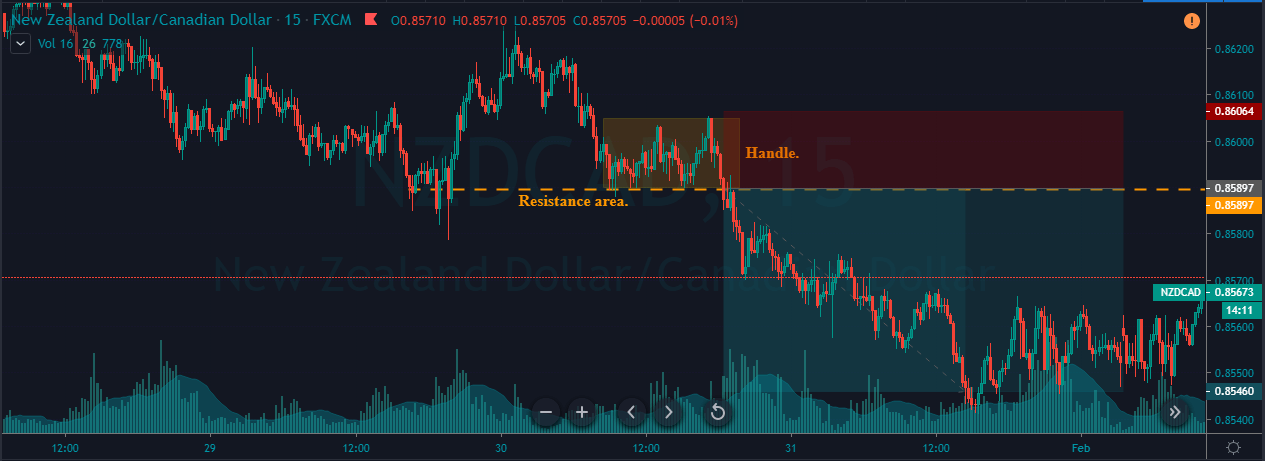
The same concept applies when taking ‘short’ trades at long-term ‘Resistance’ level. Here we should look for the formation of the ‘Inverse Cup and Handle’ pattern at ‘Resistance.’ ‘Cup’ here indicates that the price was unable to make a proper ‘higher high’ on the higher time frame due to strong seller who crashed the price. The ‘handle’ indicates that the market was unable to reach the previous ‘high’ due to weak buyers where eventually sellers sold at a lower price and are in the process of making a new ‘lower low.’ We use the RSI indicator to take the highest probability trades by looking for ‘overbought’ and ‘oversold’ situations in the market.
Trade Setup
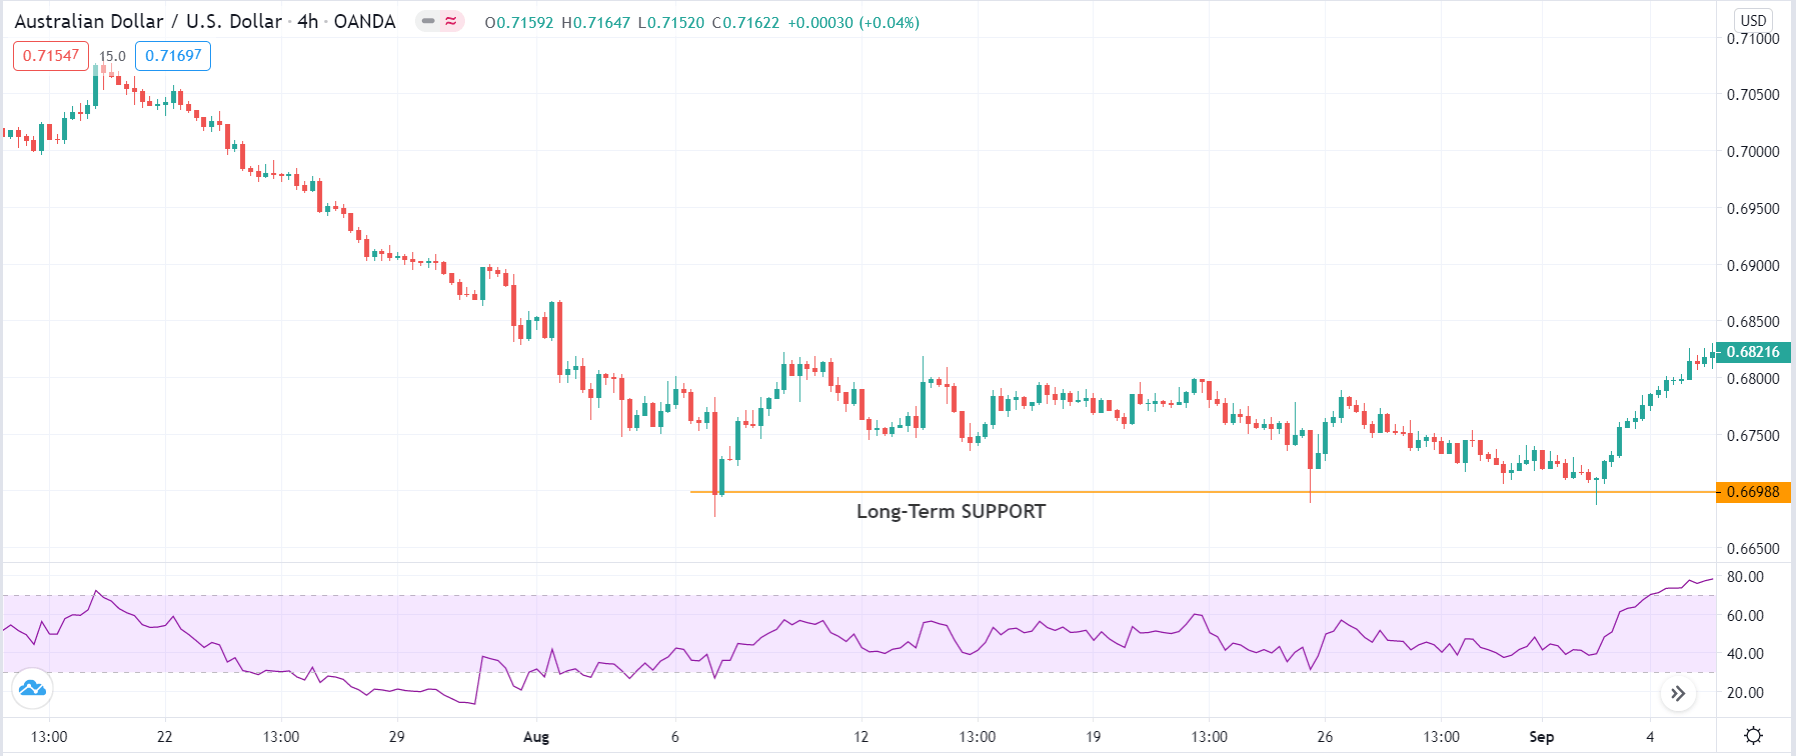
In order to use the strategy, we have considered the 4-hour chart of AUD/USD, where we will be illustrating a ‘long’ trade using the rules of the strategy.
Strategy Roundup
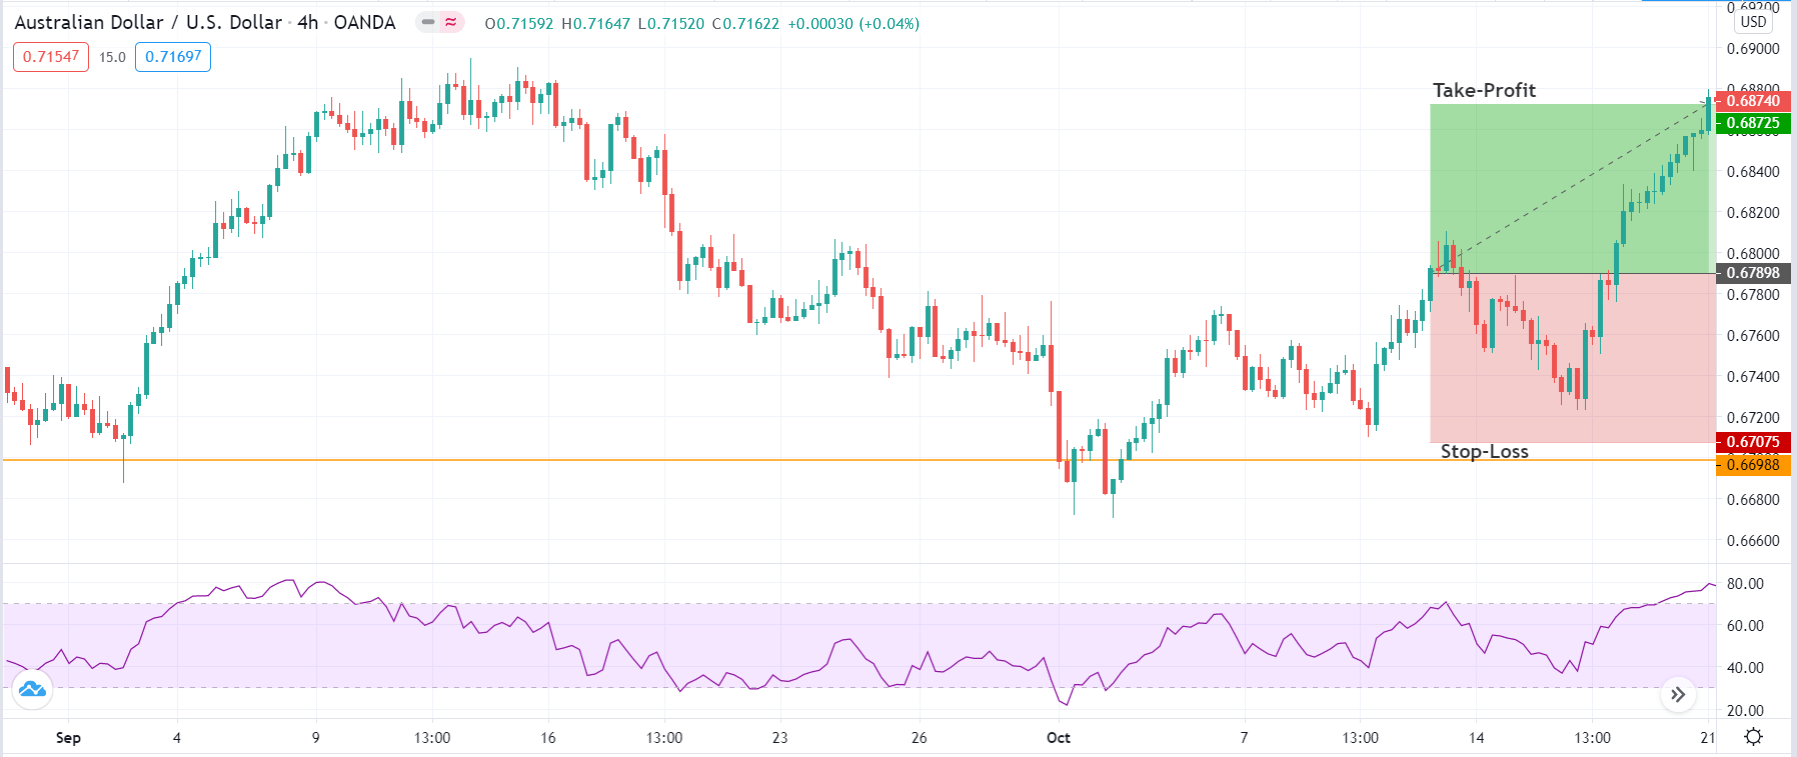
Although the ‘Cup and Handle’ pattern is a bullish continuation pattern, if we understand the logic of the pattern and apply at key technical levels, it can provide excellent opportunities for short as well as long-term traders. Using the RSI indicator along with the pattern gives an extra edge to the strategy, which makes it highly suitable in changing market environment.