Introduction
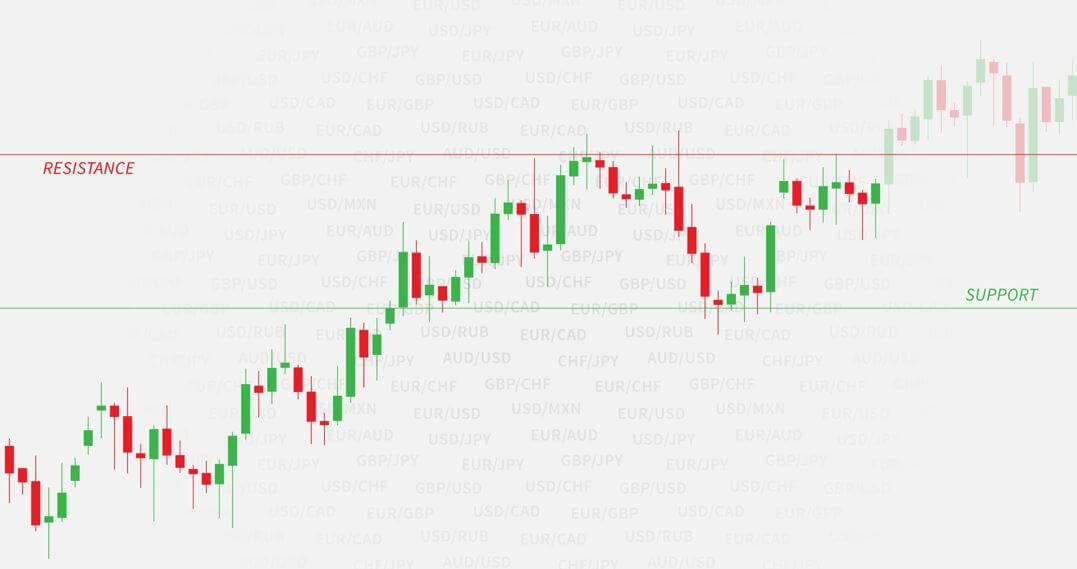
In the previous few lessons, we have discussed many candlestick patterns and how to trade them. Those basics are very important for us to master Technical Analysis. Before leaving the Candlestick topics, let’s discuss THE most important concept in technical trading i.e., Support & Resistance. We shall first understand what Support and Resistance are, and will learn how to trade them on the Candlestick charts.
What Is Support?
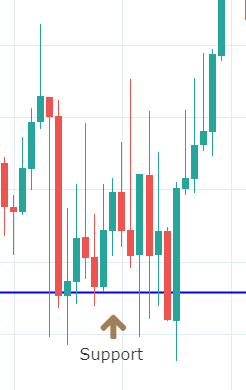
Support is the level at which the price finds it difficult to fall below. Eventually, the price will bounce back up at this particular level. The support level acts as a floor that restricts price action to go down further. Some technical traders describe ‘Support’ as an area where demand overcomes supply. Because at this level, the demand for any currency will be more, hence the selling stops, and buying continues. The price reaction of any given asset would look something like the image below at the Support level. We can clearly see the price bouncing back up once it reaches the support level. (Blue Line = Support Level)
What Is Resistance?
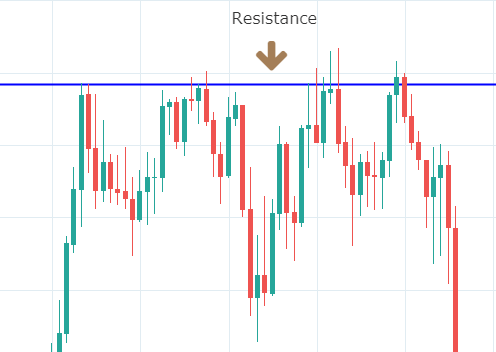
Resistance is just the opposite of the support level. It is the level where price finds it difficult to break through to rise above until it is pushed back down. It acts as a ceiling restricting the price action to go up further. Basically, it is an area where supply overcomes demand. The price reaction of any underlying currency at a resistance looks something like the image below. We can see the price reaching the resistance line many times but unable to break through it. We must remember that at any point, Support can turn into Resistance and Resistance can turn into support. Hene, it is called S&R.
Pairing candlesticks with S&R
The fundamental method of technical trading is to buy at Support and Sell at Resistance. But this does not always work as there is no sure shot assurance that the Support and Resistance levels will hold for long. Hence traders need to look at other important factors while trading at Support and Resistance.
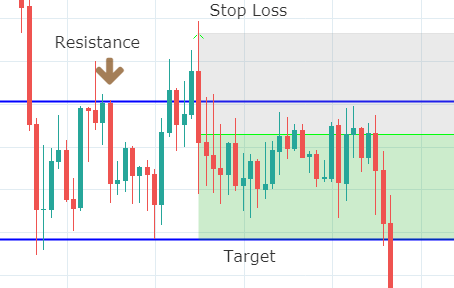
When buying near Support, we must wait for the consolidation at that area and only buy when the price breaks above that small consolidation. In that way, we can be sure that the price is respecting that level and is starting to move higher. The same concept applies when selling at resistance. Wait for consolidation and then enter a short trade when the price drops below the low of the small consolidation.
Below is an example of a short trade.
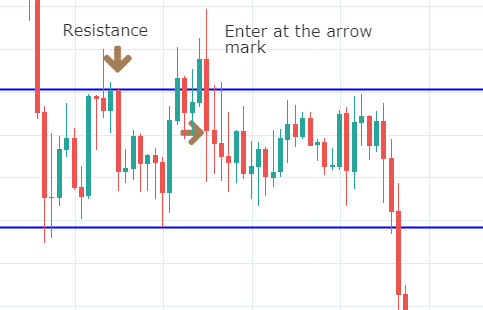
After entering the trade, make sure to place the stop-loss just below the low and above the high of Support & Resistance, respectively.
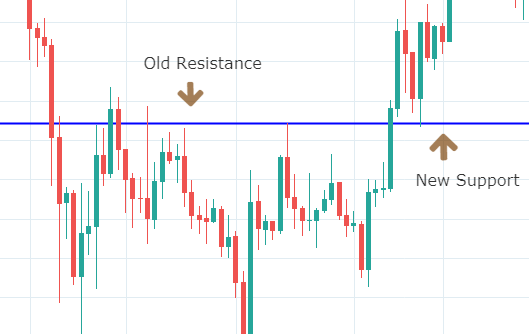
According to technical analysis principles, if a Support level or Resistance level is broken, their role is reversed, i.e., Support becomes Resistance and Resistance becomes Support. The psychology behind this phenomenon is that, when price breaches a key area, some will get out, and some hold on to their trades to see what happens. When price retraces back to the key area, people who have held it, go out and making the price bounce at the previous Support and Resistance.
Conclusion
Traders always suspect a reversal at the key Support and Resistance as there is a high probability that price will reverse at these key levels. Some traders who had open positions exit at these price levels and others initiate new positions at these levels, depending on which side the price are they. Support and resistance levels are psychological levels at which many traders place orders to buy (support) or sell (resistance) making them supply or demand levels. That is why it is crucial to learn about Support and Resistance. Also, support and resistance levels can be identified more easily using candlesticks, as a candle is very graphical, displaying wicks when the price bounces back from bottoms or tops. Identifying these significant levels forms the basis for Technical Analysis. Cheers!
[wp_quiz id=”61918″]