Introduction
In the previous lessons, we understood how to use the Fibonacci tool to trade the pullback of a trend. We have also learnt how these Fib levels are not foolproof. Now, in this lesson, let’s extend this discussion to see how the Fibonacci tool can be used in conjunction with Support and Resistance – arguably the most critical levels on a price chart.
Support is the area where the price rejects to go down and bounce back further. This area acts as a floor where the price gets stopped. Resistance is the opposite of Support. At this level, the price finds it very hard to go up as it acts as a ceiling. The general idea is to buy at the Support and sell at Resistance. But blindly buying and selling at these levels carry huge risk as there is no guarantee that these levels will work each time.
So let’s use Fibonacci levels to determine the working of these S&R levels. Basically, we are combining both Support Resistance and Fib levels to increase the accuracy of trading signals generated. Let’s get started.
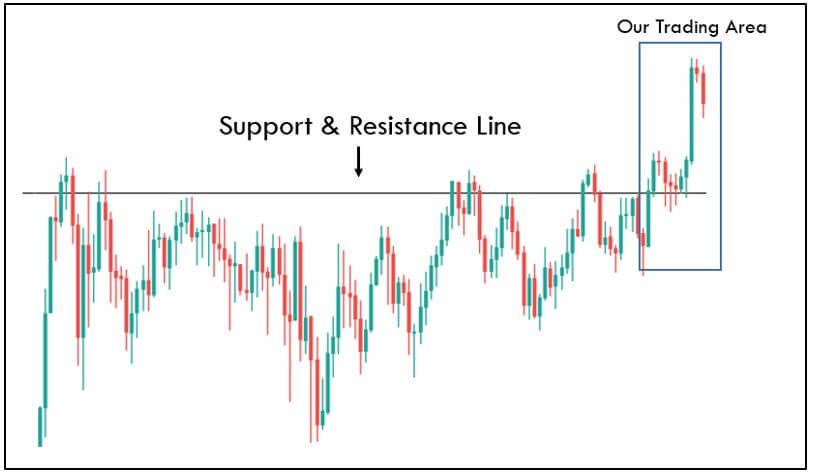
In the below chart, we have identified a strong resistance area, and now we must wait to see if it creates an area of Support after breaching the Resistance. It is always advisable to buy at ‘resistance turned support.’ Also, if the price has broken a strong resistance with multiple touches, there is a higher chance of it turning into Support. At the marked region below, we can see the price breaking the strong resistance area.
In the marked regions below, we can see the price retracing after breaking the Resistance. So in order to combine this support resistance level with Fib levels, we must identify the swing low and a swing high. As we can see below, we have also plotted the Fibonacci levels on the chart using a Fib indicator.
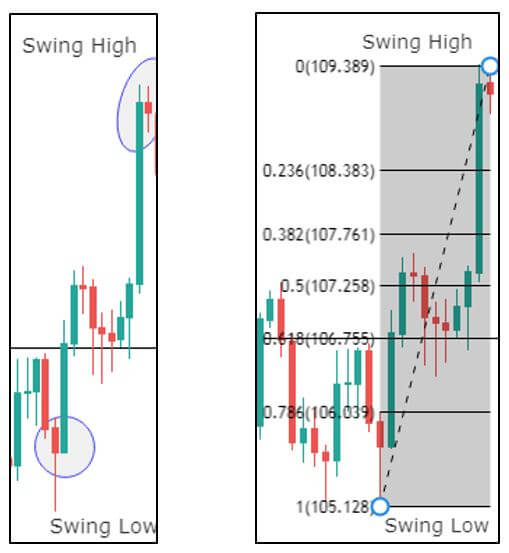
Ideally, if we get a retracement at the 61.8% Fib level and a confirmation candle, we can confidently enter for a buy. If the market does not react at any of the Fib levels, this could be a sign that the Support is no longer strong, and it can be broken.
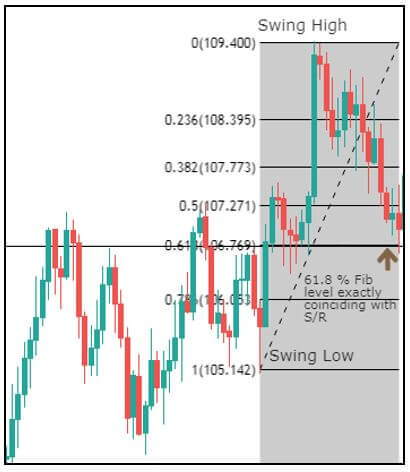
As per the theory of Support and Resistance, the market must react at the previous Resistance and bounce off. From the below chart, it is clear that the retracement has reached our S/R line, which is exactly coinciding with the 61.8 Fib level. Now it is a clear indication for us to go long once we see a confirmation candle.
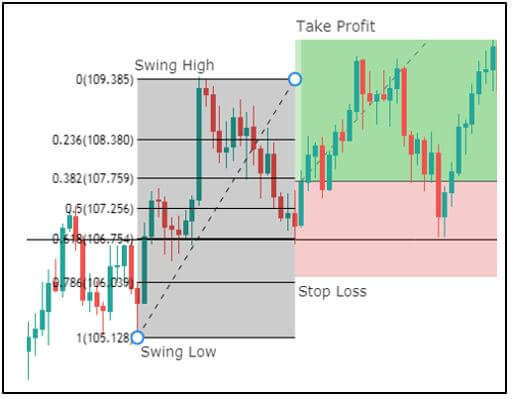
In the below chart, we can see that the price has exactly bounced off from the 61.8% Fib level and printed a bullish candle giving us a confirmation sign. Right after the confirmation candle, we can place our buy trade with a stop-loss at 78.6% Fib level and take-profit anywhere near the high.
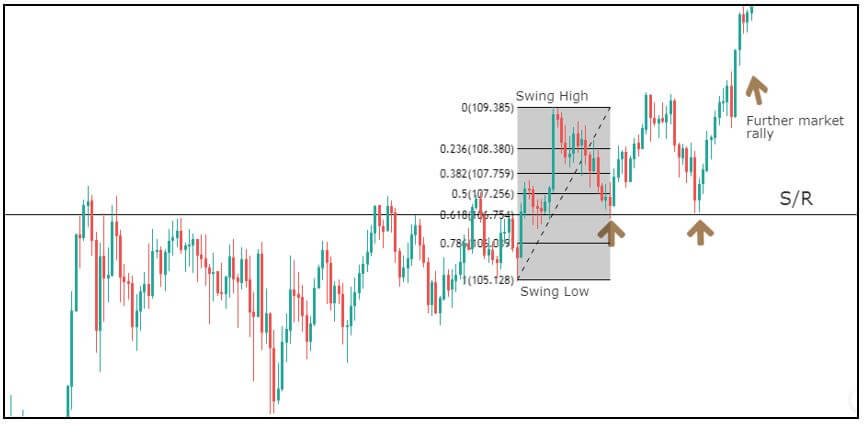
Further, in the below chart, we can see the market making higher highs breaking the previous resistance levels. From this trade, we learn that, when Fibonacci is used near S/R as a confirmation tool, it increases the odds of that level performing. The price will surely take Support at the Fib levels and continue its trend.
One can notice that the ‘buy’ happens precisely at the 61.8% Fib level near Resistance turned support line. The market continues to take Support at this level until, eventually, it breakouts on the upside. This shows the power of the Fibonacci indicator when combined with S&R levels.
There are many other credible indicators that are reliable and can be combined with S&R levels. But Fibonacci is one of the most used ones by the traders across the world. [wp_quiz id=”64461″]