Categories
Forex Basic Strategies

15 Minute Forex Scalping Strategy Using The Donchian Channel Indicator

Introduction

Scalping is a trading strategy designed to profit from small market changes. The Scalpers took a couple of trades in any trading session, and the goal of every scalper is to seize gains when they appear on a price chart because the aim is to have a few small wins rather than one large one. Scalping is one of the most challenging style of trading to master because it requires unbelievable discipline and focus.

A scalper must follow the rules of their trading strategy like a religion because one large loss can easily wipe out dozens of successful trades. One of the most critical aspects of scalping is liquidity because we would not scalp any instrument that is not liquid enough and ensuring liquidity also ensures that we are getting the best price while entering and exiting in a trade. In this article, we will show you how to scalp the 15-minute trading timeframe by using the Donchian Channels Indicator.

Working Of A Donchian Channel

Donchian channel consists of three lines, which are generated by the moving average calculations that comprise an indicator formed by the upper and the lower band, also the median band. The celebrity trader Richard Donchian developed the indicator in the mid-twentieth century so that he can identify the trend of the market. The area between the upper and lower band represents the Donchian channel. The indicator identifies the bullish and bearish extremes areas, which are followed by the reversals or breakouts in price action.

15-Min Trading Strategy

The scalping strategies are only created to trade the lower timeframes, such as 1, 3, 5, 15-minute timeframes; do not apply any of these strategies on any higher timeframes; otherwise, you will face some trouble in your trading.

As you can see in the below image of the USDJPY forex pair, overall, the instrument is in a strong uptrend, and when the price action hits the lower band of Donchian channel it indicates the buy trade, and when it hits the upper Donchian channel, it means to go for a short trade.

In the below image the price action gives us three buying and three selling trade, most of the time the buying trades perform bit longer than the selling trades, it is because the flow of the market was up, but for the scalpers, the flow doesn’t matter, all the scalpers want is to in and out from the market. Close your position when the price action hits the opposite channel, and when you take the entry, if the price action goes a bit against you { for, e.g., 4 to 5 }, then close your position immediately and wait for the new signal.

The below image represents a couple of buying and selling trades in a downtrend. The goal of every scalper is to, first of all, check the trend of the market, and expect more trades by following the trend and simply expect less counter-trend trades. You can see that the below image of the GBPNZD forex pair shows us the nine selling and six buying trades. Most of the selling and buying trades worked very well, and each trade generates a significant amount of money for us. The whole goal is to activate the position when the price action hits the Donchian channel and close your position when the price action goes a bit against us.

Range Trading

If you trade the trending market, then expect the more trend-following trades, and if you scalp the ranges and channels, then you can expect both the buying and selling trades because in ranges and channels both of the parties hold the equal powers this is the reason ranges and channels are favorite for the scalpers. The image below shows the 15-minute chart of the NZDJPY, forex pair, which shows the ranging market, and in range price action gives the five selling and four buying trades. In the ranging market, we suggest you go for the 1:1 RR trades because the price action more often spikes in ranges.

Scalping Trading By Following The Market Trend

Buy Trade

The scalping is all about having a strong and aggressive mind to face the rollercoaster ride in the market, and some of the conservative and confirmation traders want to scalp the market, but they little hesitate to react on every signal, so if you are a conservative or confirmation scalper then here is good news. We specially created a strategy that suits your trading personality. In this strategy, you will find fewer trades, but the trades will be accurate. Apply this strategy only on the fifteen-minute timeframe and avoid trading the ranges and channel markets because both situations have higher chances of fake outs. First of all, on a lower timeframe, find out the clear uptrend in any instrument, and when the price action hits the lower Donchian channel go long and hold your position till the price action hits the opposite channel. Do not go for selling trades in the buying market simply wait for the next buying trade. In the below image, by following the trend of the market, we only got the five buying trades in the EURAUD forex pair. Each of our trade travels a significant amount of time; then the price action generates the next trade. By following this strategy, you will face less mess and good trades in the market.

Sell Trade

The image below represents the six selling trades in the GBPUSD forex pair, you can see that the downtrend was quite smooth, and after activating our every trade, the price action immediately goes into our favor. In the strong trending market, you can go for the smaller stop loss and book profit when the price action gives the buying signal.

Conclusion

Scalping is not easy, but it is a quick way to make some money from the market. As a scalper does not expect a continuous win, most of the scalpers face the ups and downs in their trading journey. Every trading day awaits a couple of buy and sell trades, do not judge yourself or your strategy according to every single trade, instead of at the end of the day find out how many wins and losses you have. If the end of you have more wins than the losses, then it means you have a successful trading day. Scalping works very well on the lower timeframe and the strategies we show in this article created, especially for the 15-minute trading timeframe.

Categories
Forex Basic Strategies

Trading the Forex Market Without Using the Stop-Loss Order

A stop loss is an order placed by a trader on any underlying asset, the order remains until the price action reaches that specific point, then it automatically executes a buy or sell order in the market. Trading the markets without a stop loss is dangerous. However, by placing the stop loss, traders can easily eliminate the emotions from their trading decisions. In your trading carrier, you will often hear about the traders who never use the stop-loss orders, and they continually make money in the market. They rely on the no-stop loss forex trading strategy, and some of the traders succeed, and some don’t. The traders who win consistently in the markets are emotionally intelligent; also, they spent an endless amount of hours on demo trading to master the strategy well. Another most critical skill they learn is Accurate Thinking, and they don’t see things the way they are, they see things the way things are.

Not Using The Stop Loss Have Some Advantages In The Market

In dead markets hours when none of the trading sessions is active, at that time, most of the forex brokers wider their spreads so that they can avoid the scalpers to move the market. In that time, if your strategy gives you the trading opportunity, a widening spread can easily trigger your stop loss. During the opening hours or the high political news events, markets are quite volatile, which sometimes prints unexpected spikes in the market that ends up closing your positions and markets happily moving in the directions you predicted.

No Stop-Loss Trading Strategy

Keep in mind that trading without the stop loss is only applicable for intraday trading only, and it is advisable that use this strategy only on the lower timeframes because markets are random and it’s risky to let your positions to run overnight in the market. Like a gambler, you need to keep watching your trades until your trades hit the take profit. If you are beginner traders, then we don’t recommend you to use this strategy to trade in the live market, first of all, spend two to three months on the demo account to master this strategy and then give it a try on live markets.

Trading The Markets With The Moving Average

From beginners to advanced to chartists to market movers, everyone uses the moving average once in their lifetime. Even chartists and professional traders use this indicator in their everyday market analysis. Moving average defines the current market trend, spot trend reversals; also, it indicates the buy and sell signals. When the indicator is above the price action, it means that the trend is down, and then the indicator goes below the price action, which shows that the trend is up. Many traders and chartists use some other form of technical analysis in conjunction with the moving average to identify the trading signals. You can pair it with other indicators; also, you can use the higher period average with the lower period average to find the best entries. This strategy only works in the trending market, and we suggest you avoid using it in the dead, volatile, and consolidation phases.

Buying Rules

  1. In an uptrend, go long when the 7 MA crosses the 14 MA to the upside.
  2. Exit your position when the red candle closes below the 14period MA.
  3. No need to place the stop loss.

As you can see in the below image of the USDCAD 15 minute forex chart, the markets were overall in an uptrend. Our strategy gives the first trading opportunity around the 27th of February, and exits were also the same day. Our early trade gives us 30+ pips profit. After our position exiting the market provides us with a trading opportunity in the US session, we took this example from the recent market conditions, so our second trade in still running. By now, our second trade is up by 100+ pips. By following the flow of the market, you can easily make money, without placing the stop loss. You can see in the below image that the market is not even dead and volatile; the markets were moving in a relaxed and calm manner, find these kinds of markets to spotlighting the outstanding trading opportunities.

Selling Rules

  1. In a downtrend, go short when the 7 MA crosses the 14 MA to the downside.
  2. Exit your position when the green candle closes above the 14period MA.
  3. No need to place the stop loss.

The below NZDCHF forex pair indicates the selling opportunities by using the Doube moving average. The markets were in a strong downtrend, and it gives us the first trading opportunity on the 25th of February around the London session. After our entry price action dropped immediately and printed the brand new lower low. The very next day market gives the second selling opportunity in the London session. On the same day, the opening of the New York session indicates us to close both buying positions when a green candle closes above the 24 periods MA. Both trades help us to milk 80+ pips in just two working trading days.

The below image represents the 3rd and 4th trading opportunities in the NZDCHF forex pair. We activate the 3rd trade in the New York session on the 27th of February, and the last trade was taken in the Asian session on the 28th of February. Both of these trades are running successfully, and we are in profits of nearly 200 pips. Now, all we need is to wait for the green candle to close above the 14 periods MA so that we can book profits. You can use this way to exit your position, or you can use the significant support resistance areas to book the profits. The MA lines also act as a dynamic support resistance to the price action, and the more, the higher the period we choose, the stronger the S/R will be. So when the price action crosses the 14 periods MA, it indicates our trading party loses its power, { buyers in buying side, sellers in selling side } so it’s the best time to close our position.

Conclusion

We believe that by now, you can understand that it is possible to trade the market without using the stop loss. All you need to do is to put in the extra work required to find one of the best trading opportunities to make some consistent money. In short, Activate your trades only in active trading hours, no trade in dead or volatile market conditions also avoid choppy or ranging market conditions. Find out the super smooth trend in any instrument and wait for the price action to meet the rules of strategy to take trades.

Keep Milking The Markets, Peace.

Categories
Forex Basic Strategies

Trading Trend Line Breakouts Using the TEMA Indicator

Trend line breakouts are a price action way to trade the markets. Trend line comes in a different variety of forms, and they can vary in length and significance.  Trend lines are used to get a quick idea of the underlying security direction; also, the traders use them to find out the ascending/descending support and resistance areas on the chart. From lower to higher timeframe trend lines are being used for trading with the trend, countering trend moves and even scalpers used it to scalp the markets.

TEMA INDICATOR

TEMA stands for Triple Exponential Moving Average, and it was developed by Patrick Mulloy, first published in 1994. Mulloy developed a unique composite of the single, double and triple exponential moving average to reduce the lag between the indicator and price action. The indicator is used to identify the trend direction, pullbacks, and short-term price direction. If the price action breaks the triple moving average, it means the trend is down now, and going short is a good idea and close all the long trades. Conversely, if the price action goes above the indicator, it means the trend is up, and going long is a better idea and closed all the short trades.

TRADING STRATEGIES

WITH TREND BREAKOUTS

The image below represents the Uptrend in the GBPJPY forex pair.

The image below represents the two buying trades in the GBPJPY forex pair. The GPYJPY was in an overall trend, and during the pullback phase, the price action breaks the trend line, and we witnessed the brand new higher high. In the first trade, the trend was strong, and when we witnessed enough pull back, the TEMA goes below the price action and the breakout of the trend line was a sign of the first trade. The second trade happened very next week of the first one, in that trade, the process was the same again where the pullback of the prices was a sign of sellers stepping in, and the breakout of the pullback and TEMA goes below the prices was a sign to go long. In both of the trades, we put the stops just below the closing of the most recent candle to ride the ongoing Uptrend. This one is one of the simplistic yet most effective trading approaches to trade the markets.

SELLING ENTRY

The image below represents the selling trend in the NZDUSD forex pair.

The image below represents the two selling trades in the NZDUSD forex pair. The currency was in an overall downtrend, and it was giving strong pullbacks. When the TEMA goes above the prices and the trend line breakout was a sign to go short. In the second trade, the pullback was also very strong, and the breakout candle gave the signal to take the sell trade. In the market you will witness all the types of pullbacks, some are long, some are short, some pullbacks take a lot of time, and some are intraday. The time of the pullback is depended on the trading timeframes, the lower timeframe moves faster, and the higher timeframes move slower.  So patience is the key, and let the prices break the trend line then only activate your trade.

TRADING COUNTER-TRENDS

The image below represents the trend line breakout in the NZDUSD forex pair.

The image below represents the downtrend first, and then the breakout of the downtrend is an indication of a trend reversal. At first, the TEMA goes below the prices, and the buyers struggle a little bit below the trend line support, but the breakout was a signal for us to go long. We took the entry on this daily chart, and after a couple of days the prices tried to go down, but the very next day, strong buyers came back and printed the brand new higher high. When the markets go against your trades, try not to exit your trade, instead have faith in your analysis and let the market to tell you what to do next. This trade is currently running, and it is the biggest winner for us. The buyers are losing the momentum a bit, but overall the currency is still healthy, and we are expecting the higher prices to book the profits.

SELLING TRADES

The image below represents the counter-trend breakout in the USDJPY daily chart.

The image below represents the entry, exit, and stop-loss in the USDJPY forex pair. As you can see the currency was in an uptrend on the daily chart and when the TEMA indicator goes above the price action, it was the sign of buyers losing the momentum and the breakout of the trend line was a sign of the buyers are no more in the game. The breakout confirms the selling entry, and on 3rd January the quick move based on the news affects the markets strongly. The profit booking at the most recent lower low wasn’t possible, so we choose to give it another try by holding our trade. Within a few months, we witnessed the TEMA again go above the prices, which means sooner we can expect the trend line breakout and the very next month breakout happened, and we took another selling trade. Within a few months, price action approached the most recent lower low, where we close both of our trades.

CONCLUSION

TEMA is a triple exponential moving average, and everyone knew the trend lines are the leading trading tools, both of these tools work effectively, and using the trend line with the TEMA indicator is a simple approach to trade the markets. Some traders even believe, to make money they need to apply some complex trading techniques, but this is no true. In reality, most of the professionals use simple trading approaches to win consistently. Simple strategies are even easier to master and use, so don’t assume the simple strategies didn’t work. Give it a try; you will be amazed at the results.

Categories
Forex Trading Strategies

Ways to Completely Sabotage Your Trading Strategy: Part 4

We’ve covered money management, trade management, and trading psychology’s biggest strategy sabotaging tactics in the first three articles of this series, and now, we are down for our last eye-opening conversation on this topic.

There are some questions we don’t ask because no one told us that other options exist. While this is definitely not the only way of looking at things, we certainly believe that this dialogue is very much needed in the trading community.

You know the saying…When the student is ready the teacher will appear (Tao Te Ching). Maybe this rhetoric gives you the insight you’ve been looking for.

  • Part 4: Don’t Look Beyond

When traders first start learning about their market of choice, they are a tabula rasa, a new notebook waiting to be filled with knowledge and wisdom. At this critical stage, like children who gradually learn to be less honest because it is socially unacceptable to utter certain truths, traders are also conditioned to look at things in a certain way. Still, as human beings, we are blessed with analytical skills we need to rely on to create our own path, our own success story.

That’s why, when we first get to read about different trading markets, we need to understand the essential differences between them, such as the intricate nuances that separate the forex market from the stocks market.

A lot of resources suggest that money is made when you buy low and sell high, but we’d like to throw in a little twist here to possibly give you a perspective of where this narrative is coming from.

If we are speaking about the forex market, many experts ask how we can discuss if something is overbought and oversold when currencies essentially have no value of their own. The days of the gold standard are long gone, so what we have nowadays is fiat currencies that, unlike equities, have no intrinsic value.

When we look at a specific stock, there are many things we can rely on to determine its price. With currencies, however, we don’t think of balance sheets or products; we only depend on major banks to drop the news concerning prices.

This is one among many subtle (or not so subtle) distinctions that might seem very insignificant. Nevertheless, it’s like with changing companies – you need to understand the company culture to see if you’d fit in even though the position is the same. Here too, we are traders in either case, but some rules of the game differ.

So, what do you think happens when the money floods into the market? With stocks, it is clear – the money comes in, the price follows accordingly. Forex, like some experts, like to explain, does the opposite. When the money comes in, the prices run in the opposite direction.

Why do you think so many traders fail at trading currencies? They swarm in like bees, making massive concentration in one area of the chart, and guess what happens next…the big banks step in and pull the rug from under their feet.

The big banks use all the technology they can to see where the money is going to go next. If something is headed long, they will change it to short. This is how the big banks take the cream off in this market, which does not happen with stocks. So, how the price goes up and down is entirely different in these markets.

Now here is another topic to contemplate – reversal trading. This is one of the favorite topics on trading blogs as well as one we should definitely ponder on more deeply. Reversal traders seem to be the key players in this game of price change. Why? Big banks don’t need trend traders, professionals claim. They need reversal traders for the show to go on. 

While some traders are trying to call a reversal, big banks are “secretly” waiting for the right moment to wreak havoc. That’s why this scenario has been repeating on and on all this time. Most traders get into this collective loop of waiting for a currency to reverse itself for a long time. Do you know when a reversal really happens? ….only when the majority of reversal traders give up on waiting. 

You can always find proof of this if you look up client sentiment online or even observe the charts. You will see how the big banks keep traders immersed in this fixation by calling a reversal with sporadic crumbs of small wins. But, in the end, the majority losses because the majority does not possess this information. They did not read or learn what we talked about in the previous articles of this series and they do not understand what makes them obsess about something that keeps making them lose.  

The most important thing is to try and look and not just disregard and toss everything that doesn’t resemble mainstream thinking. Whatever is prevalent temporarily may not carry the information you need in the long term. Also, whatever is present online is not necessarily true or good for us, which is something we can see in other areas of our lives as well. Why would you let your ignorance be the reason why others become rich? 

Another important topic that is closely related to what we discussed above is your toolbox. What do you have on you to tackle current challenges? Many traders use indicators that are not only designed for other markets but that is also so old and thus useless at present. Forex traders in particular are known for using tools that were specifically made for trading stocks even to this day after so many indicators have been made only for trading currencies. Why this happens lies in the fact that many people are unwilling to search and test, but this is the only viable way for anyone to become professionally and financially satisfied doing what they do.

What we really want to stress here is that you need to think for yourself and think outside the box. We cannot let popular or widespread ideas dictate what we should do. The number of traders who fail is absolutely unbelievable. Don’t make yourself be just another statistic. You can do much more with just a little more effort on your behalf. 

And…this is the end of this journey. Remember to look beyond and test everything because you deserve better – better trading, better results, and a better life. Good luck!

Categories
Forex Trading Strategies

Ways to Completely Sabotage Your Trading Strategy: Part 3

We are on a mission here! We’ve dismantled some major fallacies and we are finally ready to come undone, free of misconceptions and wishful thinking. We’ve understood how exactly to approach our trading plans in article one and how our emotions can serve us in article two of this series. If you are too ready for some real truth once again, keep on reading. We are bringing in some more clarity today.

  • Part 3: Don’t Listen to Experts

This is another one of our favorites here. Don’t listen to experts. Why would you listen when you know better? This is a special treat for anyone in love with sabotage. You may be surprised how deep this belief goes and how far it reaches. No, it’s not only about everything you read before. Just, read the whole article and then form a judgment.  

So, let’s get right to it.

This is a story about Bob, which we heard from one of the most prominent traders we know. Bob started trading when he read a blog post on how he can make a lot of money trading. His eyes popped when he saw the monthly return. He finished reading in the blink of an eye and discovered his new calling. He will be a successful trader!

Bob started his demo account with 20 thousand USD. With a risk ratio of 1:50, he managed to raise his account to almost 100 thousand USD in just a few months. Interestingly enough, Bob only used stop losses upon entry when trades would unfold to his benefit. He thought that he had enough in his account to bear the consequences of a trade going against him, so he would just wait for the scenario to change back to positive. 

What do you think Bob’s approach lacked the most?

If you don’t know, we’ll help you with some additional questions:

No. 1: Could Bob differentiate between the money in his account and money management?

No. 2: Do you believe that Bob ever enquired about proper money management skills?

No. 3: Was Bob ready to settle for less?

You’ve got three big NOs here. Bob served us well to learn an important lesson.

Warren Buffett is no lunatic. Why would he not secure a greater yearly return? Do you think a man who achieved that much would ever not use ways to protect his trades? Imagine how unusual it may sound for someone who has just started to trade that 10—15% return is amazing when they managed much more on a monthly level. Why would anyone on earth be using stop losses when there is another way, these novice traders may think. 

We wish to discover a trader who has managed to maintain a steady-growing account year after year this way, but most professionals would agree that this approach is simply unsustainable. If you wait for a trade to go your way, you can – and probably will – deplete your account of every last dime you’ve got. The only way to make this big of a change in your account is to use reckless money management.

When you are so eager to increase your income no matter the consequences, what you get is the opportunity to kill two birds with one stone – see your account skyrocket and then be completely shattered. These results are just like Newton’s laws of physics – inevitable. 

Now, let’s quickly go back to our previous article on sabotaging strategies. What emotions do you think Bob felt throughout his experience? Was he calm and composed or half-crazed with euphoria and excitement? We believe it was the latter. We think that the best advice for Bob, the main protagonist of our story today, would be to go and cash out everything before he manages to waste it all. Would you agree?

Now if you are wondering if you could go above the standard 2% risk and maybe use stop losses in a different, more lenient way, the answer is yes. The only questions left are what kind of results you are getting with this approach and whether you are doing your account a disservice.

Now, make sure to write this down in your notes and underline it as many times as it takes for the message to get engraved in your memory:

Reckless money management is a sure way to sabotage my strategy.

If you are still wondering why, the answer is simple – it won’t render lasting results. So again we go back to the previous article and ask you – what is your aim? Are you in for the long haul or you want quick results? What is your standpoint in trading?

Don’t forget that the internet is a safe haven for tricksters and some more serious frauds who will promise anything for you to believe that your dreams can come true. Now more than ever, there is enough room for every form of deviant behavior to be wrapped up nicely for all manipulative intents and purposes. We see this with trading robots (EAs) where the results you think you see on their web pages are not the actual results you need to see and have after you make a purchase. As we explained before in this series of articles on sabotage, do not believe everything you read. Ask for clarifications and use the power of your analytical mind.

Speaking about analysis…Bob explained that he had enough margin to wait out for as long as it was needed until the trade started to move in his favor again. The problem is that, in reality, dropping from a 50 thousand USD account down to 40 thousand USD is already very, very hard to recover from. Realistically speaking, you would need to make a 25% return, a return better than Warren Buffet’s yearly average, just to make up for what you lost. On the other hand, with a standard 2% risk profile, you would need to take 11 consecutive losses to manage to get this low, and that would be without any exit plan except by a stop loss at 2% risk per trade. 

The point of everything you do in terms of money management and trade management is to make everything happen to your benefit. As we explained in the previous articles, you are a good trader if you manage to not just win but protect your account from losses as well.

Even professionals traders will admit that, at times, they deviated from the system they advise others to follow. Still, this happened under exceptionally favorable market conditions and after many, many years of trading experience. We need to create a steady foundation if we want to build a palace. 

What do you think happened to Bob?

In the end, Bob realized that he was losing more and more, so he visited this one website where he was told to watch and read further. 

  • More reading, more learning, he shouted.
  • Bob said his goodbyes and closed off his account. 
  • Like the famous meme says… Don’t be like Bob. 
  • Don’t sabotage your trading. Be a smart trader.
  • Choose quality, not quantity.
  • Choose sustainability, not instant cash.
  • Choose everlasting content, not passing news.
  • Choose to grow, not to be praised.

It is, especially at the very beginning, important not to think that you are above it all. With some humility and eagerness to learn, you will not fall for the trap that Bob did. Pick wisely the content you will let get to you and learn from other people’s experiences. You don’t have to suffer as much.

See you next time with the very last article on how to sabotage your strategy. Until then, think of the ways in which you possibly ignored expert opinion to your detriment and then try to add on the results of the trading psychology test we talked about in the previous article to get to the why’s.

Categories
Forex Trading Strategies

Ways to Completely Sabotage Your Trading Strategy: Part 2

If you don’t know what the problems with your strategies are, you probably didn’t read the first article of this series. The short answers to your questions will be included in this article too, but, before you proceed, you should definitely read the first part where we talked about how trading plan issues can be the worst sabotage to your strategy and success

If you think that making a trading plan will suffice, you are badly mistaken. That’s why today, as promised, we are moving on to another key area that will help you avoid the biggest traps in the world of trading.

  • Part 2: Don’t Give a Darn about Trading Psychology

They say money is energy. Therefore, since energy goes where attention does, what you pay most attention to in trading will inevitably dictate the amount of money you earn.  Interestingly enough, most traders who have the least success trading take very little notice of how their personality and habits impact their trading. And, many of you who assume you have everything going for you are also far from impervious to this hurdle.

What we want to achieve is the ability to control:

  • Our emotions while trading
  • Our reactions to losses
  • Our compulsive need to correct things

You may notice that we did not say eliminate, and there is a crucial difference here. If you think about people who suffer from any addiction, you may remember that the first step towards recovery is acknowledgment and acceptance of the problem.

We cannot fix the problem if we don’t know that we have one or if we keep turning a blind eye to it constantly.

We always write our New Year resolutions, but we don’t stick to them. Do you know why? We rarely try to understand what lies behind our lack of motivation to lose weight or exercise for example.

That is why if you don’t recognize that, as a human being, you are prone to feeling different emotions before, during, and after trading, you are by default sabotaging your strategy. We will call this our step 1.

Emotions are in our DNA and there is no reason for you or anyone else to feel ashamed. While many people try to ignore this side of their personality, any attempt to disregard our affective responses leads to making wrong trading choices.

For trading to go well, you essentially need to meet two basic requirements:

  • Trade your system
  • Do not interfere

And, this always goes fine until emotions come into play.

Anxiety, fear, desire, need, tiredness, failure, continuous losses all leave a mark – a sensation followed by physiological changes in the body. 

Even winning affects our brain. The moment traders’ percentage return goes way up from where it used to be, people start thinking of leaving their jobs. This is one of the major misconceptions about trading and a sure way to sabotage your trading. Trading alone, for the greatest number of everyday people, cannot suffice right away. The way trading is conceptualized will not allow this immediately as you may have initially expected, so don’t give in to these thoughts and feelings.

We cannot eradicate our emotions, but after we grasp their existence, we can choose what to do with them. This is step 2.

Losing will always be a part of this game and every trader, professional or not, goes through this experience sooner or later. The moment things start going really well for you, losses may become even more painful. You cannot lose your motivation and focus here. Like consolidation periods are a natural part of the market, so are the losses. 

Therefore, it is not losses that should worry you, but your reactions to them.

Some traders find the 2% risk rule to be ridiculous because they want more and they want it now. Greediness can bring some amazing results but only in the short term. This has happened so many times to so many traders.

Some of the most successful forex traders earn a 20% yearly return. When you manage to ensure a consistent return year after year, you learn to appreciate the effort behind and stop believing everything you read.

Another massive sabotage traders are prone to struggling with is guilt. Guilt is such a dangerous trigger for a variety of harmful actions that you really need to change your perspective immediately. Any loss you took was meant to happen because you needed it to grow. Don’t cry over spilled milk and quickly return your focus to where it can actually serve you. This is step 3.

Instead of drowning yourself in regret and self-pity, do something useful – analyze what went wrong without any should-haves. Did you follow the guidelines for risk? Did you overleverage? Were you overtrading or did you cross any other boundary?

Especially as a beginner, you may regret not following your plan through and thus losing some pips. However, we need to learn to celebrate our small wins as well. You may not have earned as much as you intended at first, but you still managed to go through with the trade and ensure a positive return. Celebrate your success regardless of how big or small it is. Note this down as your step 4.

Now take your pen and write these words in this order:

I will never trade by feel or chase losses.

Do not allow your trading to be conditioned by something as transient as emotions. You are there for the long run. You want consistent results and sustainable trading.

So, we will always support recognizing emotions but you need to learn what to with them.

What will it take for you to stop letting your feelings drag you down? Is it more demo trading? Is it more testing? 

The thing is…trading will never be perfect, like anything else in life. The more we seek perfection, the more we miss the bigger picture. Here are some of the famous quotes we should all strive to live and trade by:

  • If you don’t make mistakes, you don’t make anything. (Joseph Conrad)
  • Take chances, make mistakes. That’s how you grow. (Mary Tyler Moore)
  • Mistakes are a fact of life. It is the response to error that counts. (Nikki Giovanni)
  • He who is not contented with what he has would not be contented with what he would like to have. (Socrates)
  • Skepticism is the first step towards truth. (Denis Diderot)
  • Millions saw the apple fall, but Newton asked why. (Bernard Baruch)
  • He who spends time regretting the past loses the present and risks the future. (Quevedo)

Your last step, step 5, concerns trading psychology tests. You do not have to wait for the big crash. Meet yourself now. Discover what situations could trigger your shadow sides and explore ways to bypass these issues in advance.

Be brave and smart now so you don’t have to pick up the pieces later. And, this is a perfect introduction to what we will be talking about next. Until then, start getting to know yourself better.

P.S. All answers in today’s test should be NO.

Categories
Beginners Forex Education Forex Basic Strategies

Top 8 Real-Life Lessons About Forex Trading

If you ever decide to go the traders’ way, know the only boss you will have to listen to is you. Also know listening to yourself is the harder part of trading. Sounds funny but true. When an established trader thinks about foolish beginnings he can only smile and realize how much he has changed since. Becoming a trader is a lot of work, but it is one that gives many life lessons with a tremendously good outlook for young people. There is one trait that each successful trader has – they are wise. Wisdom requires experience and work, just no way around that. The sooner you start working the better the odds you could retire early. What a trader learns on this path is all about actually becoming a better person and how he sees life around him. Here are the biggest lessons that await you if you decide to become a professional trader.

“Do, or do it not. There is no try”

This line is definitely familiar to the movie series fans but it holds true to trading especially. Hopefully, it also motivates you. The initiative has to be strong, simply because forex loves to cut quitters. This market will test your mettle psychologically above all else. All those who seek to get in for the easy money will be disappointed. Making forex a sort of casino is possible, most people take it like that. Gamblers are hard to stop, only a zero on their account can until they put some more money if they have it. it does not matter how high they went, unfortunately. Those that keep researching ways to beat the casino might be the ones that find their holy grail. There is a crucial turning point here, do you want to be a gambler or a trader. Is this you in the next few years?

“Discipline equals freedom”

This is the title of a book by Jocko Willicks. The book is not about forex trading yet it is an essential life lesson that applies to forex too. There is no trader with results without discipline. By giving an example of a book that actually addresses general life problems with practical guidelines, we want to point out that forex punishes those that lack discipline as life itself. Now forex is not dangerous per se, but it can be to your financial status if you do not have rules that stand in the way to complete disaster. What you want to become is one thing, but the way to that goal is what will define you. Forex does not have feelings, do not expect mercy, mistakes will be made. But that is a good thing, you discover your psychological weak points that would need discipline to patch. 

Understanding the Concept of Risk

You have done so many foolish things when you were young, so many songs have been written about that period of human life. Simply, people take irrational risks when young. Why is this so is explained by science but that is not important since you cannot avoid it. Forex is all about how you manage risks and if you stick to the rules you set. If you are on the way to become a forex trader, it is time to make stupid mistakes. Make the hell out of them, however, we strongly advise you to do them on a demo account. Just pretend that demo is the real one. Interestingly, some young traders lack the patience or mentality to accept what they are doing on a demo does not work and go to live trading anyway. This leads us to another lesson.

Patience

Again, one more interesting result of a science experiment, more precisely the Stanford marshmallow experiment showed that willpower has a dramatic effect on the quality of life. Now, patience does not mean you have to wait for something but to keep searching for ways to improve your trading, be it through researching other traders, strategies, indicators, or reading books. Have the willpower to persist despite the failures that could set you back emotionally, feel like it is a “waste of time”. But it is not, it is just another lesson. The results do not happen overnight. According to some experts, the results may come even after two years of everyday work. Patience is also needed in practical trading, however, this is just a smaller scale of this lesson. Now when you know it takes time to get to that holy grail the question is are you willing to do the right trading approach.

Knowing Yourself

On your journey of forex trading, you will discover your personality or better said, accept who you truly are. The sooner you accept your flaws but also your advantages the better. You now know where the potential reason for losses lies. Forex will demand you to cope with the bad habits, and this lesson will translate to real life. These habits exhibit life as well, and when you think about it this lesson improves how you manage your urges that lead to events you do not want to happen. Special skill traders have developed just by trading forex, yet this skill is evident in every elite professional. 

Decision Making

This skill is so in demand because it carries responsibility not everybody can take. When the time comes to decide and accept the consequences then it takes a special skill. Sometimes this skill is attributed to leaders. In sports, this is especially evident in the last lap, the last-second shot, the final point in a match that decides the winner. Are you the one who makes it despite the failure consequences? Actually, decision-making is a stealthy skill that just makes noise when it is apparent. Elite professionals are deciding all the time by scaling the upsides and downsides of the decision. In forex, these decisions define trading, but traders eliminate the stress by knowing their strategy or a system work in the long run. They are very cool when it is decision time because they know it is just a matter of probability. In the long run, they win. 

Staying Cool

Controlling emotions is a skill and closely tied with good decision-making. You may have the methods and tools that can tell you the odds or what is a good decision. But if emotions mess that up, what good it is? Handling emotions can be done in various ways, it does not mean you need to be emotionless to make the right decision. Many will tell emotional decisions are bad ones. However, it does not mean you need to take a “pill” to stay cool. How about just staying true to your rules? If you have a plan that works in the long run, let it choose for you, there is no reason to change your mind just because you feel like it. In time, you become cool in even the most stressful moments because you strongly believe in something that just works. Now, in life, it is not recommended to be emotionless of course, but every time you need to decide about something important, you will have that attuned, cool, analytical mindset that helps. 

Wisdom

The magnificent harmony of what you have learned by forex trading is the most precious part. At this point the results are inevitable. This is the point where you accomplish and turn to higher goals by reaching out to others and sharing what you know. Now you have the responsibility to make a better future for others. Forex trading made you a better person on many levels, not just financially free. The lessons and values learned is just another lesson your personal accomplishments do not mean much if it is not reflected in the life of others. 

Categories
Beginners Forex Education Forex Basic Strategies

How to Get Better Results Out of Your Forex Strategies

Some many strategies are developed but all traders have one in common, the element that separates them from the pack (most starters lose). These traders have tested their strategies to the bone which gives them a really good chance to have profits at the end of the year. So, yes, they are slow turtles, actually, they are not racing at all. That element is called persistence, it is present in so many ways and many aspects of trading. Each of the trader’s eras requires persistence which ultimately improves your overall trading skills. Now, here is how to improve results with just this one element, even though we could argue there are many, we believe this one is the one that cannot go away if you want to see the results every year. 

Strategies that Work

It would take many pages to describe how you can improve a strategy classified as a reversal, swing trading, scalping, channel breakouts, deviation probability, and so on. You can even mix strategies based on the market conditions or mix the theories to create a “diversified” decision. At the end of the day, backtesting results will judge if that strategy combo is working or not. Strategies that work are the ones that are tested out and give good results over and over in the long term. It is great we have demo accounts so we can test as much as we like, yet we need to be persistent in this endeavor to find the right combo. And this is how most traders start, testing their first strategies. The first and the best way to improve your strategy is by analyzing the test results from the excel table, myfxbook, or any other journaling tool.

The stats are a good giveaway of what is good and bad with your strategy. The P/L line is not always the most important, pay attention to other markers such as the drawdown, profit factor, Sharpe Ratio, and other, trade-specific stats, such as Risk to Reward ratio, how much money you risk per trade, and so on. The amount of attention and work you invest in this stage will equal how much your strategy is improved. However, do not spend a year on one project just to conclude it does not work, take a hit and abandon ship. Persist. There is so much to explore out there. 

The Iron Mind Strategy

All that work you have done is paying off, your strategy works consistently in your backtests. Forward tests confirm you can make good money, all you have to do is go live. And disaster strikes. Feeling broken or mad? Does not matter, to make it in this game you need to persist. At this point, if your strategy works mathematically, there is one factor that could ruin your nicely developed system. Your psychology probably failed. The system never had a chance to do its thing because you kept interfering. 

We would advise you to start with indicators since they are strict, unlike our minds. Especially on very important trading parts such as risk management. We can get emotional, we might be tired, drunk, or something else, If we let our physical and psychological state interfere with our trading we cannot get persistent results. And there is that word again. 

Indicators are an easy solution for this, but it might not be enough, we have to accept the strategy could be better if we interfere less and let the tools work. The extent of how many indicators and tools you have in your strategy depends on you. It still might not matter because beginner traders think they can do better. Some traders drop the indicators once they become experienced reading the charts, some keep them forever and look out for better ones. 

Keeping the Mind Open

Traders can put the badges on once they overcome psychological issues. The strategies they have are finally doing what they do in the backtests year after year. With these, they can become pros, using their own money or having investors. However, traders will need to improve on what they already have. They need to be persistent still because at some point the market will change, the same way forex is different today than 10 years ago. Of course, your strategy could work great, even though it was based on the old market conditions, but this is not always the case. Very successful traders could “lose their mojo”, and this happens even to veterans in the industry.

If your strategy is indicator-based, lookout for new versions or adaptation of the same. If you use some moving average, try out a step version of the same. Did you know inverse Bollinger bands indicator can also be a great type of moving average? Improving the strategy requires keeping an open mind about ideas, similar or completely different. Each strategy has something unique, when browsing strategies pay attention to the trading plan, there might be a rule that could benefit your strategy if applied.

Find Good Resources

Exploring the world of forex is very interesting, you never know if some forum from the depth of the search list might be what you are looking for. Interestingly it is mostly the community portals where people share their ideas and creations that are the best sources. If you thought a good source is some popular tv station, you are wrong. Even the websites on the first search result page are more of the same. It is like they are cloned. Know you need to dig deeper unless you like conventional ideas that do not get you anywhere. Presenters on tv are bad traders, they just sound smart with the lines and tools understandable to the masses. We all know better, even beginners who went through babypips’ school know the analysis is much deeper, from a technical standpoint. 

Their fundamental analysis also is not what you need. Rarely ever some information from the TV is useful for trading. If you want to really have insights into what is going on with the markets, pay attention to dedicated research channels. They are present on social media like YouTube and Twitter. For example, The Rich Dad Channel is hosted by well-known investor and bestseller author Robert Kiyosaki. The channel is full of fundamental insights about the markets and politics inevitably connected to the USD, EUR, and other currencies. What is great about the channel is that Robert hosts pros who are specialized in certain markets, who in turn have their own channels. You get the idea this is great for exploring other channels of your interest knowing you won’t stumble on shallow analysis TV stations. 

Connect with Other Traders

Introverts rarely do this however, when you are really stuck and do not get the results you want, consult with other traders. Forums are a good way to go with this but do not expect someone to hold your hand. More often than not someone has already asked the same question. Still, if you have some new problem worth sharing, you will be amazed at how many smart trades are there who could help. Sometimes it is just words that you might need, not pointers or indicators. If you ever become interested to become a pro trader, try to apply with a prop firm that organizes trader community events. This is a rare value that is very helpful for your strategies and your mindset. 

Categories
Crypto Forex Basic Strategies

Do Forex/Stock Day Trading Strategies Apply to Cryptocurrencies?

The short answer to this question is yes, absolutely, however, you will need to adapt for it to be so. Let’s dive into how.

① Common Ground

Did I make money whenever I had the chance?

This is your number one question that you would ask no matter the market. When you derive some strategies from the stock/forex market, you do want to see tangible results. 

Crypto is unique but there are also some universalities. 

You need a plan because we cannot just flip a coin and decide what to do next. We need a clear idea of how we are going to approach and exit the market so that we can correct any mistakes.

→ Solution: When you come up with a plan, you must stick to it. Also, check your totals and see if your overall percentage of trades puts you in the winning or losing group.

② Community

Forex and stock community spirit tends to be quite strong. The same is true for the crypto people. Especially since it is a relatively new market, many individuals want to take the opportunity and give their projections of the future. Unfortunately, as most of these forecasts are incorrect, the only thing traders get is a false sense of support. What is more, these posts and announcements often create a major hype, causing many crypto traders to forsake common sense and their judgment even when things start to turn sour.

→ Solution: Let go of groupthink and start practicing independence and individuality. 

③ Testing

You do not want to follow any advice too piously, especially if it proves not to work for you. 

How will you know what works? You will test every strategy and idea you find interesting.

Most successful traders had to hit rock bottom to realize what they can do better. Still, you can avoid this scenario if you take time to record your trades and ponder on the ways to make your returns higher.

→ Solution: Like in the forex/stock market, you need tests to be able to improve and learn from your mistakes. 

④ Money & Risk Management

Money management is key for long-term success. Without it, we are all just playing the lottery. 

Crypto is amazing because, once you limit your downside, the upside can be infinite.

→ Solution: Set your risk at 5% maximum of your entire portfolio.

⑤ Algorithm 

Traders claim to have successfully used the same algorithm they applied in forex trading for trading crypto. Still, you can trade cryptocurrencies without an algorithm. What you cannot do, however, is avoid money management.

Crypto is known to move 25% to the positive and then 25% to the negative in only one week (late and early 2020 rallies for example). As the moves can be quite extreme, you need the protection that money management brings.

→ Solution: While you need to be active to catch the big moves, do not forget that you will lose everything without proper money management. Algorithms are optional.

⑥ Scaling out

If you want to earn smart money, you will apply the scaling out strategy. You never want to go all in.

→ Solution: Take a portion of your money off and close positions. Overleveraging can lead to terrible losses in a market that moves as much as this one.

⑦ Holding & Holding

You want to play both offense and defense. Choose your long-term and short-term investment plans to fully use what the crypto market has to offer. Remember that the possibilities are infinite with proper money and risk management. 

We noticed how some stocks that generally do not do so well can go up substantially when the S&P 500 does. Similarly, altcoins are known to go up when bitcoin does, and this usually happens at a much higher rate. That is why it’s wise to allocate a small portion of your money (less than 1/5) and invest in these other coins.

→ Solution: Set 30% of your finances for short-term (more aggressive) investments and use the remaining 70% for your long-term strategy.

⑧ Spread out

Like in other markets, you will benefit from branching out. What this means is that you do not need to trade only one cryptocurrency. Rather spread out to ensure a higher return.

For example, you can have the majority of investment in stablecoins as a protection in case everything else falls apart. Your second layer of protection could be bitcoin or XRP or, preferably, both. Then, 5-20% could go into different altcoins. As there are different ideas on which are the best, you can just take your favorites and invest a little of your money there as well. Your final layer should be your longshots or the coins you use for your long-term strategy.

You can always use interesting investing research portals such as stransberryinvestor.com. There is solid research done on crypto and stocks and a very good benchmarking tool that grades crypto assets. These are based on core evaluations on each coin, useful to gauge the market in-depth, underneath the charts. The picture below is a snapshot of the benchmark table. These are free resources but you will have to register your account. Note that you should understand the project behind the coin. 

→ Solution: Trade different coins to ensure maximum growth, profitability, and protection. 

⑨ Entry

There is no one ideal piece of advice on where you should enter the market. As with forex and stocks, we can rely on different tools to find entry signals. For trading cryptocurrencies, you can always use “Trailing Buy” and even accommodate it depending on how the price moves.

In the image above, the price went low and there is a chance of it going even lower, so we want to move the red line further down.

If the price moves up, we are not going to make any changes in terms of the position of the red line. 

→ Solution: To get the signal to enter the trade, move the trailing line down only if the price goes lower than it is right now (i.e. if it breaks down upon the candle close). When the price finally hits the trailing stop, that is your sign to buy. 

⑩ Exit

You need to have a defined exit strategy for any outcome- whether a trade has gone well or bad. 

Like in any other market, you need to align your exit point with your overall strategy and be consistent with what you do. We cannot make any changes in the middle of a trade.

Your exit strategy may vary depending on the type of trade. As cryptocurrencies are great for holding, your exit will then largely depend on your idea of how long that trade should last.

→ Solution: Always have a projection of how far you want to go and where you want to take your money off. Be disciplined to ensure you know that your approach is working out for you. 

⑪ Psychology

Since many are affected by the craze over cryptocurrencies, you may experience the fear of mission our (FOMO). The rules regarding trading psychology are all the same, regardless of whether you are trading stocks or currencies. This means that any strategy you want to use cannot be perfected until you have control of what you are doing.

→ Solution: Complete a personality test and see how your traits might interfere with your plans for growth in this market. 

⑫ Similarities and Differences

Fiat may as well one day be completely replaced by crypto. Still, until that time comes, we must know that crypto largely depends on supply and demand – like stocks and unlike forex. 

That is why any strategy we wish to take from these two markets requires testing to see if it is going to help or hinder trading cryptocurrencies. 

→ Solution: Although forex/stock strategies can generally work with crypto, we need to be careful with our choices.

Categories
Forex Basic Strategies

Trend Trading When There Are No Trends

During a larger part of 2019 traders have witnessed probably the least volatile forex market in history. These periods are often followed by steady bullish equities markets when most of the capital goes on this side of trading. Forex traders that use trend following methods have two options in these situations. Trade as they are still in trending markets and give back what they have earned during the previous year or use this environment to their advantage. The situation from 2019 is perfect grounds to learn, test, and separate consistent traders from the rest. 

To some degree, trading forex does not put you in a position where you feel out of control, like in the stock market with reports or crypto with so many unannounced events, etc. In forex, even when trades do not go your way, you still have some control. There are a few ways to recognize dead markets, some are quite obvious but beginner traders may need more clarification. Taking advantage of dead markets does not come from trading, it is by adjusting our trading systems to avoid them. Experiencing dead markets in real-time is a great opportunity to secure our future results. So traders will need a plan, and we will put in place one as an example of what you should do when you enter flat waters. 

First, a tool is needed to measure how volatile the forex market is. Volatility can also be substituted with volume, what we want to measure is the activity on the market. One such example tool used by prop traders is the Euro FX VIX ($EVZ), Index created by CBOE. Pay attention to our Volume articles about incorporating filter indicators into your system. This tool is just another filtering method that can be applied to your plan outside the usual MT4/5 indicator combo. Now, the $EVZ Index is published by a few charting sources, one can be Yahoo Finance, barchart.com, TradingView or you can even go to the CBOE site. If you notice the “Euro” in the Index name, do not think it applies to the EUR currency only, it is a good indicator for the overall forex market volatility. 

$EVZ presented as a histogram on Yahoo!Finance:

In the picture above we can notice a sharp jump in the activity once the world was hit with the COVID-19 pandemic. Just a few weeks before, the $EVZ was bottoming below the 5 mark for quite some time. The whole of 2019 was one of the quietest long periods in forex history. The Index can also be represented as a bar chart but you should not pay attention to the highs and lows, just focus on the close value. The 2019 anomaly created a stir as trend traders found their systems losing more than usual and just after the dead period traders experienced the pandemic shock. To adapt, a completely different instruction has to be used for your trading plan. Another interesting correlation to dead markets is the movement of the equities market. What some traders have found is that when S&P 500, for example, is trending but slowly, in constant small increments each day, forex markets start to die out. 

In the picture above we can see whenever a gradual S&P 500 (red line) increase is present, the $EVZ (blue line) Index is slowly waning out. Immediately after a disruption in the equities market, the forex is full of currency flows. Downward equity moves are especially sensitive as people move the money out of equities and move into forex or other markets where investing is more lucrative. The negative correlation is evident, since 2017 the S&P 500 is slowly moving up and forex is not what it has been before 2014 where trend traders’ standard gain was around 200 to 300 pips a day. 

If we take a look at the ATR indicator, calm periods can also be spotted which can drive trend followers impatient. They will not get signals, the signals are not resulting in long trends or more likely they are fake moves. Trend following strategies have only one weak moment and that is until the Take Profit target is hit. After that, prop traders secure their wins by scaling out and moving Stop Loss orders to breakeven. Signals that end with a reversal before the TP is most likely a loss and are more common in dead markets. 

Trader’s psychology is at the test here. When you are in a dead market and you are losing, this is a good thing! It is time to take advantage of this. Understand these conditions happen and will happen again. The next time it happens your trading plan will be ready. Chaos theory applies, the order goes into chaos, and chaos back to order. In case you are a beginner and just testing your system for the first time in 2019, know your system will be adjusted to this dead market and may even be not as successful as you would want. On the other hand, since you are a beginner, you should be trading on a demo without any real capital to lose. To some traders, if you are trading in dead markets and still on breakeven, your system is on a good track to endure dead markets and reap consistent gains when it is not. When you are testing your volume indicators or tools, dead markets are extremely good for forwarding tests. Once you have picked your favorite volume indicator it should filter most of the flat mini periods in a dead market by keeping you from taking any trades and even give you small winners sometimes from rare trends worth taking. This element is crucial but some may find it is the hardest to find. 

If you are still struggling to find a good volume indicator then just go and use the $EVZ we have presented. Create a set of risk management rules for your trading and apply them to your trading system. As an example some prop traders use, whenever $EVZ value is below 8, reduce your positions to 50% of what you normally take. If it goes below 7, use only 25%, stop trading below 6. This measure alone will benefit your end line and filter 90% of bad signals when combined with your volatility indicator. When you realize you are losing consistently at some game or market, avoidance is one great and simple measure that will help. Avoidance or filtering your signals in an environment where you lose is the same principle, just formulated into a strict trading plan. Even though it is fun to be in action, your ability to avoid it is what will separate you from others. 

Another interesting conclusion prop traders made during the dead markets is that the USD pairs are just not good even for small trend signals. So their suggestion is just to avoid all signals from these markets once you measure a dead market. Sticking to cross pairs is also going to be tricky but you can make one adjustment to increase your odds. Scaling out principles explained in one of our articles where you leave out a part of a position to continue riding the trend may not be a good idea in dead markets.

Since trends are not going to last for very long, it is just better to take a whole position at your first take profit target. So whenever $EVZ is below 8, for example, make this adjustment to your system. Those 200+ pip trends are not going to happen, so all of your high percentage setups may just lack that extra mile that makes all the difference on your account. Just avoid aiming for big and cut everything at your first price target. If you are following our ATR based money management, your risk to reward ratio will be 1:1 in these conditions. This is not good money management for normal conditions and will not provide you with a positive account, it is just temporary. The risk of a reversal is increasing as you keep your position longer, so based on testing it is just better to end sooner.

Once the market is active again know that your volume indicator and system are still calculating historic movements and the signal is not there yet. More often than not, the first trend after the calm phase will be missed since your indicators are lagging. As mentioned in the Volume articles, these indicators need data and would be useless if too sensitive. Be ready to accept missing out on first movements after the dead market. Do not attempt to make indicators more sensitive just to grab the first trend, it will make your system susceptible to fake breakouts frequent in calm markets and you will face new losing streaks. Experts even say the first strong moves are likely to be corrected after a day or two, and that means 1 or 2 candles if you are trading on a daily chart. Relax and know your account endured the storm (calm market) of fake moves where other traders not accounting for the volume (which is quite often) lost their morale and most of their accounts. Robust trading plans with these elements are only a result of your hard work majority of traders just lack. 

Lastly, there is one more adjustment you can make when you are close to being out of the game. It is an extreme indication something went wrong with your plan, money management, or psychology part, but if you are on the line for some reason try changing your target timeframe. Daily charts may lack conviction but smaller time frames are certainly better. Here, your daily chart trading system (for example) will be performing in an environment it is not designed to so expect less impressive results. However, the system you have designed should be universal, if you are following the structure we have provided before. Smaller time frames have a lot of other factors you need to pay attention to. This also means you need more time, more nerves, and less sleep. News event moves here are bigger and more unpredictable, then we have trading sessions and more factors. The smaller time frames we go to, the more nuances can get our trends to reverse.

However, here is also where you will find your volume if you desperately need to trade. Such needs may come if you are expected to trade by your client or a prop firm and you are in a dead market. Sometimes it may happen because you need income. If you need income by trading forex with money you cannot afford to lose, know you will fail in the long term. Other reasons to change your timeframe such as impatience will also lead to failure. Simply know forex does not forgive, it can only serve those who put in the work in the system and train their mindset.

Categories
Forex Basic Strategies

Three Trade Duration-Based Forex Strategies

In this article, we will analyze the types of existing automated systems according to the duration of the trade. I’ll show you some interesting ideas and teach you how to apply a variety of duration-based Forex strategies. 

Scalping

Perhaps the most famous method is the so-called scalping, which many of you have already tried. These are really short-term operations. Then the second group is called swing trading, mainly using higher time frames. This is my favorite approach and trading style, I use swing strategies, automated trading systems that make transactions in longer time frames. And the third group, which I also enjoyed working with very much recently, consists of long-term strategies, mainly in daily time frames. We will also consider this group because it has its own advantages that we must not forget.

Scalping is a type of specialized trade taking profits on small price changes, usually shortly after a transaction has been entered and has become profitable. Automated scalping strategies can do dozens of operations during a day and most such trades last only a few minutes. These are very short trades and, therefore, that trading style has its own advantages and disadvantages. Let’s talk about them.

Scalping is a type of trade specializing in taking profits on small price changes, usually shortly after a transaction has been entered and has become profitable As a general rule, scalping strategies are marketed in short time frames using 1-minute candles. So the main advantage is the opportunity to make big profits in a very short time. These automated strategies can be very profitable, but at the same time very risky. Where there is great profit potential, there is also high-risk potential. And, as we said before, scalping has some huge disadvantages.

In general, automated scalping systems are potentially very risky and very sensitive to market conditions. This is because it is almost impossible to perform transactions in a one-minute time frame to simulate with historical accuracy. Then, it is not possible to elaborate an exact subsequent test. We can only backtest a strategy, how it should work in ideal conditions. However, there are situations in the market, when there may be a publication of some important macroeconomic news, for example, that the unemployment rate increased. As a result, the market makes a very strong price movement in a very short time and we may suffer a large slide, something that has not been taken into account in subsequent tests, and that will definitely worsen the results of our strategy.

Where there is great profit potential, there is also high-risk potential. So, in the world of scalping strategies, only one of those unfavorable circumstances can mean that one loss takes ten of our earnings, and this is what we can’t see in our subsequent tests. Therefore, it is very difficult to develop robust scalping strategies, and I personally do not even use them. In the past, I’ve worked with scalping strategies and gotten really good results, but at times, these were due to luck and being in the market at the right time.

The potential benefits can be really huge. However, scalping is so risky and so sensitive that it makes no sense to use it at all. I would not care too much about the complexity of developing such strategies if they are so risky. Here we see big risks that can’t be determined in advance, so if you’re just starting to operate, I don’t recommend scalping.

Swing Strategies

I recommend directing your attention to swing strategies. This is my favorite type of strategy, which is usually marketed in the H1 time frame. In 90% of cases, they will be within one hour, in exceptional cases in M15. If we want to talk about whether to use a time frame of one hour or fifteen minutes, we need to consider the type of strategy. In 90% of cases we will use a time frame of one hour, which has its own advantages, but of course some disadvantages as well.

Therefore, I have chosen it. The main advantage is that it allows you to perform longer operations. Usually, an average trade lasts about 24 hours, it can also take several days, but usually around 24 hours, and it is also one of the factors with which I am satisfied. Such trades are not as sensitive. The number of trades in a month is a maximum of 10, so such a trading style is not as expensive.

Usually, an average trade lasts about 24 hours, it may also take several days. When someone is scalping, they pay a lot of money just for commissions or for spreads. This is not the case with swing strategies, with which you only need to pay commissions for approximately 10 transactions per month. Such a fee is less important and does not have a significant impact on your account.

Of course, swing strategies are not as profitable due to the smaller number of operations that are performed in longer time frames. Therefore, a trader earns less, but with more stability. Because these strategies are not so sensitive, they are not so influenced by the unexpected news of strong market movements. For example, when publishing macroeconomic news, such as the decision of a central bank on rates, unemployment rate, GDP growth, etc. In those moments, we only risk an operation and we are not so afraid of a negative result because it is not a big problem for us. It will not result in a great loss.

Swing strategies help us deal with some difficult situations in the market, and we can also perform backtesting with more accuracy and reliability. This is the main advantage of swing strategies compared to scalping: it is easier to simulate real market conditions for backtests. These strategies, in my opinion, are the perfect combination of the number of trades and stability, and if you’re a beginner, the one-hour window is definitely a good choice.

Position Trading

The third type of strategy is position trading. In general, these are strategies for long-term positions which, in some cases, can be maintained even for a few years. Basically, they are negotiated in daily or even higher time frames. I personally operate all position strategies in the daily time frame, and sometimes very interesting situations and transactions can occur.

The main advantage is that these positioning strategies are very stable, as they are usually used to take long-term trends. To take one example, in the past, we witnessed a crash in the oil market with a price that fell steadily for more than a year, so we could be in this position for a long time.

So position trading can be very stable because we are working with strong trends. I am satisfied with the positioning strategies in the daily time frames. Another advantage is that they can be tested very accurately because economic news has an absolutely minimal impact on their overall results. In many cases, it is only in the short term impact, and from the perspective of the daily time frame, this impact is not something we should fear.

Therefore, we can perform subsequent tests with a very high level of accuracy; however, these positioning strategies generally have lower yields. This third type of strategy has the lowest gains of all these types of strategies. It is necessary to note that position trading gives gains of ten to twenty percent. However, this can be achieved with great stability and can be re-tested with precision.

In addition, these positioning strategies generally work in a wide range of markets, so they can be used to trade indices, commodities, different currency pairs, as well as some exotic currencies such as the Polish Zloty, the Swedish Krona, or the South African Rand. We can do this because it operates on long-term trends, and you can even afford to operate in exotic markets.

This would not be possible when operating in lower time frames and with a greater number of operations; however, positioning strategies are connected with a low frequency of operations and therefore the costs are lower and Therefore, even the high entry costs in trades (usually very high spreads) are secondary due to the duration of our trades.

Categories
Forex Basic Strategies

What Is the Best Strategy for Forex Trading in 2021?

2020 is over and we must prepare our best Forex strategy to start the year 2021 in the best possible way. Undoubtedly, to define the future of our Forex operation we must take into account the most relevant events and news that we will encounter. Let’s define below some of those we think will most influence when designing the best strategy for Forex next year 2021.

What should we pay attention to? Highly effective news about Covid vaccines can lead to a decrease in the extreme levels of market volatility we saw in 2020 and a return to normality faster than expected. Investors should also consider the need for fiscal stimulus to save the economy before the global availability of vaccines, the increase in cybercrime, the relationship between the United States and China, and the risks to market leadership. Many investors may want to diversify to find high-return assets that can provide a stable source of income. There is broad consensus that the infrastructure sector will be one of the main beneficiaries after potential economic stimuli.

Then, looking at the market outlook for 2021, following the pandemic and the global crisis, next year will present both opportunities and risks for investors, as markets and sectors will rebound unevenly. This has been an unprecedented crisis, with winners and losers, that has entrenched current market trends, accelerating Internet disruption, and worsening the disinflation of the service industry. Therefore, it will be advisable for investors to diversify into different assets to search for their income.

In the year 2020, we have experienced a deep recession and the consequent bearish market, but it has not affected all sectors in the same way. Many companies are at their worst, and others have never really been better. This situation has led to an incredible dispersion in equity yields and credit spreads. In addition, the rebounds of different assets should remind us all that their valuations have as much to do with the discount rate as with the benefits.

The Current Economic Recovery Will Continue

In 2021 we see that the economic recovery will continue, as the latest sanitary innovations allow the normalization of private sector activity. However, with negative real interest rates in all advanced economies and likely to remain so for 2021 and several more years, investors will have to do more to find attractive returns.

The attractiveness of opportunities in alternative assets could increase in this low-return environment for longer. And as we have already mentioned, the infrastructure sector will be one of the main beneficiaries of the global economic stimulus packages and, within the universe of the instruments listed, the low level of return on a fixed income in developed markets will mean that investors will have to have a more global view. For example, dollar-denominated emerging market debt, including Chinese government bonds, can be particularly attractive.

What to Look for In 2021

The COVID-19 pandemic shocked us all during this year 2020, so investors need to consider what surprises the year 2021 could bring and what this will mean for their investment decisions.

1- The rise of cybercrime: the virus and the associated economic shutdowns have led to significant adjustments in telecommuting, which can make some sectors or businesses more vulnerable to the negative effects of a cyber attack.

2- 2021 will be the year of vaccines: highly effective and rapidly distributed vaccines would allow a return to normality sooner than expected. This, coupled with monetary stimuli, can trigger a strong rally in the markets.

3- Fiscal paralysis: Despite low interest rates and economic needs, paralysis in Washington, D.C., and reduced fiscal appetite in Europe mean a bridge to the vaccine is missing in the coming months. This could lead to a double-dip in the economy and markets.

4- Threat to monopoly: A possible change in the tax code and stricter regulation for large technology companies can bring about a major shift in market leadership towards small caps.

5- Improving US-China relations: the new US leadership lays the groundwork for a new engagement with China, including a reduction in tariffs and a reduction in restrictions on technology exports. Reducing uncertainty and improving the business landscape catalyse a significant shift in the flow of assets from developed to emerging markets.

Best Strategy for 2021?

The search for the “best strategy” in Forex is eternal. Most new “traders”, even some of the most experienced spend their whole lives looking, unsuccessfully, either in forums, books, and seminars, for the superior strategy to all the others.

We think what you should know about “the best” strategy is this:

It doesn’t exist!

Not only is there a way to do that, but there are many ways. This applies to successful strategies or methods of trading currencies as well. The different negotiating styles used by professionals specializing in making money consistently in the market are countless; just as each individual has his own type of DNA. That makes a lot of sense, as trade numbers and indicators, oscillators, and concepts are infinite as well as how these can be combined. Therefore, long searches for perfection in the buying and selling of currency sooner or later lead to disappointment.

Have you ever heard the saying “the best attack is sometimes a good defense”? This is a great truth that applies not only in the legal field but also in the currency market. Even an excellent entry strategy (what would be the offense) becomes weak if it does not have a good exit plan (what would be the defense). All traders employing strategies such as Martingale (a strategy that continues to increase losing transactions, thereby anticipating a setback) or other flawed exit methodology that keeps large open losses waiting for the market to return, are doomed to failure.

The best strategy can quickly become the worst if traders’ minds are not attuned to success. You will have heard experts say over and over again: “Trading is mostly mental”, this is a universal truth based on the law of attraction (which has become a buzzword because of the movie “The Secret”).

In Conclusion… 

The search for “the best” strategy to trade on Forex is useless. Instead, the trader should focus on the above three points to maximize their success in buying and selling currency. The best Forex strategy is a personal decision for each trader, but we must always understand it perfectly and we must identify with it. It should be consistent with our resources, and, speaking of resources, it should be cost-effective. And most importantly, we should feel comfortable with the strategy.

It becomes obvious because it is important to practice on a demo account, the possibilities are many and the more options, the greater the indecision. When testing on demo accounts, it’s time for the truth, and that’s where we can find our best Forex strategy. In a demo account, we have total freedom to experiment and test with many different strategies. Then, we can circumvent any limiting aspect and make attempts with everything we desire. It is now that we can make mistakes, refine small details, polish what is needed, and learn as much as possible.

Categories
Forex Basic Strategies

Trading The Forex Market Effectively Using ‘Renko’ Charts

Introduction

If you are a Forex trader, you can agree-many winning strategies exist out there. And Renko charts are among the handy weapons you can deploy to your advantage. This write-up will help you grasp handy tips to get your feet wet, as well as scaling your trading into a profitable trajectory.

Renko charts are not very popular as bars or candlesticks among traders. However, they can be very profitable when a trader uses them correctly. Renko chart trading is a robust way to analyze price trends, and even superb when you combine it with another tool to confirm entry and exit positions.

What Is Unique With Renko?

Well, Renko charts only show you the price movements of an underlying asset without factoring in time and volume. The formation of a Renko bar or body is in one direction. And it forms only when prices move by a predefined amount in pips. You can adjust the number of pips per block to suit your needs or trading strategy.

Also, a subsequent Renko bar can only form either adobe or below a previous one. It’s that model that shows you the price direction with unique preciseness.

Their naming arises from Japanese “Renga,” which means brick. Therefore, Renko charting arises from a series of blocks. In the light of Forex trading, the charting of the blocks moves up or down with prices.

Advantages of Trading Forex using Renko charts

  1. Renko charts are simple in both ease of interpretation and use.
  2. Great for determining the levels of support and resistance.
  3. Traders can adjust the block sizes to suit their trading needs.
  4. Renko charts are great at signaling price breakout or reversal.
  5. Ideally, Renko charts only show you how prices are moving.

Overall, Renko charts give traders an edge with overly volatile commodities like Oil and Gold. The charting digs deeper into the pricing histories. The charting model behind Renko builds on plotting price on the -Y-axis Vis a Vis time.

Renko beats conventional price-charting by removing insignificant price movements.

There are three metrics that Renko shades off from ordinary price action. And they are:

  • Any false price breakouts
  • The candle-wicks
  • The price volatility

Ideally, it pays attention to the critical metrics: support, resistance, and the trend.

Whenever prices move, Renko converts that into a commensurate block on the chart. And every block forms after price confirmations. The reality is, Renko charts do not work with partial blocks. They have to be wholesome and in line with the set numbers per single block.

As a trader, it makes great sense if you’re able to sift out short-term fluctuations out of a price chart. Beauty is Renko charting is a great tool at that. Price volatility is the greatest enemy for many traders, especially if you can only bring in a small trading margin.

While most traders can establish trends from normal price- charting, Renko charting is another wholesome set of trading tools to help you sharpen your decisions while trading.

More Pointers with Renko Charts

As indicated earlier, Renko charting creates blocks after by concurrently establishing the closing positions of a previous block. Next, subsequent blocks can only form either below or above a previous one.

Using the precedence above, Renko charting brings you a precise tool into your trading arsenal to help you view trends more clearly. Along with that, it’s also important to calculate the most appropriate block size – in line with the asset you target to trade.

Calculation of Renko blocks

There are two documented methods for the determination of the optimal sizes of Renko blocks.

First is the ATR or Average True Range. It relies on the ART indicator to determine the height of an ordinary candlestick.

Second is the model where a trader provides a predefined value for the size of a block.

So, new blocks only form when price movements meet the minimum value set for a block.

Sniffing a Buy Opportunity with Renko Charts

Image credits: best-trading-platforms.com

Renko charts help traders spot trend directions very clearly. And there are two ways to spot an opportunity to go long. Using the image above, a monthly view of a stock’s prices is visible. Simple, green bricks signify uptrends, while the ref ones signify the downtrend.

Primarily, the years 2017 and 2019 are trends – good opportunities to go long (buy). Towards the end of 2018, there’s a trend reversal (bricks turn red- the opportunity for buyers to exit and pocket profits)

Also, the same trend reversal creates an opportunity for traders to go short and also take profits. Look at 2019 also; the green bricks signify the continuity of the uptrend.

Image Credits: best-trading-platforms.com

Look at the figure above, the EUR/USD pair oscillations ranging from 1.0500 – 1.1500 from 2015 through to -2016. Also, notice the uptrend starting from 2017 but with a reversal along the way. Uptrends are opportunities to go long, while downtrends are opportunities to go short.

Pro Tip: If you are looking to upscale your trading success, Renko charts greatly help. However, ensure that aside from mastering them, it’s excellent to confirm the trends, support, and resistance levels using one or more indicators.

Keep in mind that trading success arises from careful analysis of entry and exit positions. Upfront, it may seem cumbersome – taking time to do the due diligence in the analysis. Utmost, do not trade with emotions. Renko charts and many other tools will help you sharpen your analysis.

The preciseness and effectiveness of a strategy arise from long spells of practical use. Renko is a super-tool for scalping when you compare it to classical price charting or bar or candlesticks.

Other handy trade signal tools to combine with Renko Charts

  • Simple Moving Averages -SME Enter trades with three bars in the direction of the trend and 10 SME sloping downwards or upwards. (This will help you avoid false breaks in a reversal against the trend)
  • On Balance Volume –OBV Enter trades when you confirm the trend and SME as tally that with OBV indicator’s direction.

Parting Shot

Renko charting brings in more preciseness for your trend confirmation in line with price action and the trend. It helps you filter out the noise with volume and time and leaves you with price direction only. For successful scalping, incorporating Renko is a better way to go about it. Renko charts help you keep the focus on the trend for position trades and note it’s the reversal in good time to exit.

Categories
Forex Basic Strategies

The Absolute BEST Forex Trading Strategies for Beginners

It’s easy for beginner traders to become overwhelmed, which sadly leads many to give up on trading for good before ever really getting started. This can be avoided when beginners have access to simple, easy-to-follow strategies that aren’t overly technical or risky. Below, we will outline some of the best simple trading strategies for beginners:

  • Trailing Stop/Stop Loss Combo Strategy
  • Moving Average Crossover Strategy
  • Breakout Trading Strategy
  • A more detailed 50 Day Breakout Strategy

Trailing Stop/Stop Loss Combo Strategy

This strategy uses stop-loss orders and trailing stops, which ensure that the share will be sold at market price value if it dips to a certain level. Loss-limiting strategies are good for beginners because they can allow traders to get used to trading without risking a larger amount of capital. Trailing stops are also applied through this method to add to the efficiency of the stop loss. 

Traders would combine trailing stop and stop loss together and set those limits based on their maximum risk tolerance. For example, you could set the stop loss at 2% below the current trade price and the trailing stop at 2.5% below the price. If the price increases, the trailing stop will surpass the fixed stop loss and render it obsolete. Note that it can be more difficult to use trailing stops with active trades, due to price fluctuations and volatility. You’ll need to study a stock for several days so that you can set a trailing stop value that will accommodate normal price fluctuations and only catch the true pullback of the price. 

Moving Average Crossover Strategy

This strategy uses a simple moving average (SMA). SMA is a slower price indicator that looks at older data than what is used by most indicators. Usually, a longer SMA is combined with a shorter one. For example, a 25-day SMA might be combined with a 200-day SMA. Information can be compared on charts to indicate bullish or bearish trends and to provide buy or sell signals. 

Moving averages are often used to indicate the overall trend and can be used in combination with a breakout strategy to help do away with signals that don’t match the trend indicated by the moving averages. 

Breakout Trading Strategy

This strategy focuses strongly on trends in the market. Consolidation occurs when the market moves between bands of support and resistance. A breakout occurs when the market moves beyond the boundaries of the consolidation, either to new highs or new lows.  A breakout must occur for a new trend to begin; therefore, breakouts are signals that a new trend has started.

Following this strategy is fairly straightforward, which is why we would recommend it to beginners. Of course, risk management is crucial for the strategy to work with limited losses. One of the Breakout strategy’s downsides is that not every breakout signals a new trend. 

You’ll also need to get a feel for the type of trend you’re entering:

  • A breakout beyond the highest high or the lowest low for a longer period suggests a longer trend. 
  • A breakout for a short period suggests a short-term trend.

Once you learn to identify trends more quickly, you’ll be able to react more quickly and ride the trend earlier in the curve, although this could lead traders to follow shorter-term trends. 

The 50 Day Breakout Trading Strategy 

This strategy evolves around momentum, meaning that when prices are moving strongly in one direction, it is likely that things will continue in this direction. Further movement in the direction of the trend is also considered to be far more likely than any movement against the trend.

When using the Breakout Strategy, traders should focus on the pairs EUR/USD and USD/JPY because these pairs have shown the best reliability through research. Traders will also want to use the Average True Range trading indicator. There are a few other key steps to accomplishment with this strategy:

  1. Monitor the daily chart for the entry signal. A new 50-day high signal that a long trade should be entered, while a low indicates that one should enter a short trade. The trade should be entered immediately once the signal is received. 
  2. Traders should only risk a maximum of 0.25% of their account size per trade. Someone with $2,000 in their account would only risk $5 per trade, which makes this more beginner-friendly.
  3. Tighter stop losses will help to ensure greater profitability.
  4. Two days after the trade entry, move the stop loss to break even if the trade is still open. If the market price is worse than the stop loss, you should close the trade at market price. 
  5. Use an exit strategy that is either based on time or using a trailing stop. Exiting after 8 days has shown the best profitability through research.  

While some beginners may struggle with the exit strategy, you should remember that a time-based exit of around 5-8 days is profitable. This helps to avoid frustration with making mental judgments as well. 

Categories
Forex Basic Strategies

Profitable Forex Strategies That Nobody Tells You About

There are a lot of factors that can make or break your chances of success in the forex market, from the amount of money you risk to your general knowledge of what moves the markets, and everything in between. One of the most crucial keys to success is to trade with a solid trading strategy that has been tested and proven to actually bring in profits over a period of time. 

Forex traders typically base their strategies on two different types of data. Fundamental strategies consider economic data and data that is affected by businesses, while technical analysts use indicators and study historical price data. Trading strategies consider data based on their chosen method and then provide traders with techniques that tell them when to enter or exit the market in order to make a profit. Your trading strategy will guide you and ensure that your trading decisions are structured and based on as much fact as possible to increase your chances of making money. 

If you search for trading strategies online, you’ll find a long list of options. The choices can honestly be overwhelming for beginners, as there are so many different factors to consider when choosing a strategy. There is no one-size-fits-all method, as every forex trader has different needs and thinks from a different perspective. So which strategy should you choose? Below, we will break down three of the best trading strategies out there so that you can decide for yourself based on your own personal preferences. Keep in mind that many veteran traders might not tell you about these choices, as many professionals prefer to keep beginners out of the loop when it comes to top-rated trading secrets for success. After all, it is a competitive industry.

Not Sure Which Trading Platform to Use? Try MetaTrader 5

MetaTrader 5, or MT5, is one of the most popular trading platforms out there, right alongside its predecessor MT4.  MetaQuotes developed this platform to offer more financial instruments, trading tools, and resources. Here are a few of the highlights that influence our love for this timeless trading platform:

  • Provides access to a wide variety of forex, stocks, CFDs, and futures
  • Offers a navigable interface with 21 timeframes and 6 pending order types
  • Supports robotic and algorithmic trading
  • Allows hedging and netting
  • Supports 36 technical indicators, 44 analytical objects, and an unlimited number of charts
  • Built-in economic calendar for quick access to important news data
  • Can be accessed through a web browser, desktop version, or on mobile devices and tablets

When compared to other options out there, MT5 truly offers more services and resources to traders, making it a great tool for success if it is incorporated into your trading routine. If you do plan to use it, you can find many video tutorials on YouTube that will teach you how to use the platform efficiently. The best way to use the MT5 platform is to open an account through a broker that offers it so that you can trade on MT5 for free, as licensing fees can be expensive. 

Using Trading Signals

A trading signal is a suggestion to enter a trade that is typically delivered to the trader through a phone or email alert. The suggestions come from expert traders that have personally analyzed the market based on their own ideal sets of data so that you don’t have to. This concept is especially helpful for beginners that may not completely understand the market or for traders that just don’t have the time to sit around analyzing charts and data all day long. Many traders consider signals to be a shortcut to success that takes away from the overall time spent trading, as long as a profitable signal provider has been chosen. 

Experts that create trading signals do so to help other traders, but there is usually a cost of these services. Keep in mind that some signals are free, while most cost money, but you shouldn’t blindly trust every signal provider that’s out there because scammers are involved in the market. Before choosing a provider, you should read online reviews about their services and take a look at their overall reputation, especially if it is a paid provider. 

One-on-One Training Sessions

Some traders overlook the benefits of personal one-on-one training sessions with professionals for a few different reasons. One of the most common reasons is that these sessions usually cost money, although some brokers will offer you free sessions if you make a large enough deposit with them. It’s true that there are many free resources available online, but you should stop to consider some of the benefits of one-on-one training:

  • You’ll be mentored by a veteran trader that knows the market inside and out.
  • You can ask personal questions and receive professional-grade advice.
  • Your coach will teach you basics, market fundamentals, and everything you need to know.
  • Your mentor can suggest profitable trading strategies you might not have heard about once they learn about your personal trading style.
  • You’ll learn to use technical indicators and how to effectively analyze the market for trends and directions.
  • This is one of the best ways to get hands-on practice in a live market environment.
  • You’ll receive tips that can help you to achieve profits on the same level as expert forex traders.

The Bottom Line

If you want to get the same results as a professional trader, you’ll need to trade like one. The three professional-grade strategies we’ve outlined above can help you get off to the right start in the financial markets, as long as you take the time to practice them effectively.

Categories
Beginners Forex Education Forex Basic Strategies

Always Test Your Forex Trading Strategies! Here’s Why…

Coming up with a new trading plan can be exciting. It can make you want to jump straight into the markets and use it to make you some lovely money, but should you be jumping in now? Have you actually tested the strategy out and can you be sure that it actually works? The only way you will find out the answers to those questions are if you thoroughly test it out.

Testing the strategies that you come up with can actually be seen as far more important than actually coming up with it. This is mainly due to the fact that anyone, even someone with no knowledge of trading could actually come up with a strategy. This doesn’t mean that it will be a  good one or one that will actually work, but they will be able to come up with one. This is where the testing comes in, this is where you can differentiate between the good strategies and the bad ones, but it also offers far more opportunities than that.

So why do we test? We test for the simple reason of wanting to make sure it works. We do not want to get into a live trading situation nowhere we put a strategy into practice just to find that it falls apart or doesn’t actually function as a strategy. The strategy needs to have entry criteria, and exit criteria, and some risk management built into it, if any of those parts fail, so will the entire strategy.

We can test them in a number of ways, the best and most prevalent way of doing it is via a demo account, this account will mimic the trading conditions as closely as they can to live ones. This allows you to try out your strategy on something that could almost be considered a live trading scenario. If your strategy is successful here, then there is a good chance that it could be on the live markets too. It should be noted, that being successful for one or two trades is not enough, it needs to be consistently tested for at least a few months to know the full extent of how good the strategy is.

Let’s say you are testing a strategy and everything is going perfectly, this does not mean it will on a live account. While the conditions are similar, there are some distinct differences such as commissions and slippage, these do not exist on a demo account. So if you are taking small profits to be sure to take this into consideration. 

There are also backtesting facilities available these take your strategy and will apply them to the last years of trading to see how it would have performed in the conditions that had occurred in the past. This can give you a small indication of how successful it could be in the future. This is not a 100% accurate testing method but can be used as a viability indicator.

So you found an issue, that is the whole point of testing. This gives you the opportunity to resolve that issue and then test again. This cycle should continue until you are 100% happy with the strategy, only at that time should you troy and deploy it onto the live markets.

Even with a strategy that works perfectly on a demo account, you need to stay disciplined, expect some losses, and always analyse and adapt the strategy as it needs. No strategy is full proof, they always need adapting and changing so be sure to stay on top of it and continue testing as the years go by.

Categories
Forex Basic Strategies

Top 3 Terrific Ways To Trade Price Channels Like A Pro

Introduction

A price channel is a state of the market that slopes up or down bounded by a trendline above and below the asset’s price. The upper trend line acts as a resistance to the price, while the lower trend line acts as support. The price channel helps traders maintain the focus on the price alone, unlike the other trading tools, which are plotted directly over the price chart. In an uptrend, as long as the price advances and moves within the channel, the underlying asset trend is considered bullish. The break below the channel line is a sign of the trend being reversed. Two main components of the price channel are the Main Trend Line & the Channel Line.

Main Trend Line – It takes a minimum of two to three points on the price chart to draw the trend line. The line sets the tone for the price slop as well as the trend. To draw a bearish trend line, we need at least three reaction points at the highs. To draw a bullish trend line, we also need two to three reaction lows on the price chart.

Channel Line – After drawing the main trend line, we draw the channel line parallel to the main trend line. For drawing the channel line, we also need two to three reaction highs and reaction lows in accordance with the trend. This channel line also acts as a support in an uptrend and resistance in a downtrend.

Trading Strategies To Trade The Price Channel

Trends + Channel

Channels are perfect to trade the pullback markets. It is advisable to look for the price channel that is sloping at a healthy angle. Don’t try to trade the steep or flat channels as they won’t provide good trading opportunities.

Firstly find a trending market and mark at least two reactions of highs and lows. For taking buy entries, wait for the price to touch the channel line and for selling trades, wait for the prices to touch the main trend line. Remember not to trade both buy and sell opportunities in an up-trending market. This approach is used by amateur traders who fail most of the time as we are going against the flow.

The price chart below indicates the price channel on the AUD/NZD forex pair.

The price gave the first selling opportunity on the 16th of May and the second trade was around 19th May. These trades printed a brand new lower low, and we closed our trades when the prices broke the channel.

Reversals + Channels 

In this strategy, we need two timeframes to find accurate trading opportunities. Look for an uptrend on the higher timeframe and then see the same chart on a lower timeframe. On the lower timeframe, let the price to pull back enough. When the prices gave enough pullback, draw the price channel on that pullback. If the prices break below the channel line (in an uptrend) and get knocked back immediately, it is a sign for us to go long. When this happens, we can expect a brand new higher high.

As you can see in the image below, the pair was in an overall downtrend. During the pullback phase, price action tries to break the price channel but get knocked back immediately. It means that some buyers are trying to take the price higher, but the aggressive sellers are grabbing the opportunity to fill a few more orders. After the fake-out, prices held inside the price channel for a bit, and after a few hours, we witnessed a brand new lower low.

Breakouts + Channel

Breakout trading is the most common yet effective approach to take high probability trades. Firstly, find an up-trending market and draw a price channel. Wait for the price to approach any significant level and break below the price channel to take the trade. When the price action goes below the channel line, it is a sign for us to go short. Similarly, in a downtrend, draw the price channel and let the price approach any significant level to take the breakout trade. After the breakout, go long and place the stops just below your entry. If the price holds after the breakout, it is a great sign to take the trade.

The image below represents a sell trade in the GBP/AUD Forex pair. As you can see, the prices were in an uptrend, and when the sellers broke below the price channel, we took a sell trade. We choose a smaller stop-loss order as the channel line also acts as dynamic support to the prices. For booking profits, a higher timeframe support area was a perfect place.

Conclusion

Trading Channels are effective as they provide numerous trading opportunities when the market is moving in that state. You can use all the mentioned ways stated above to trade a channel or use the method that best works for you. When trading, the channel always trade with the trend. Do not over trade whatsoever. If you get used to it, sooner or later, you will blow your trading account. Don’t do this. Instead, always follow the trend. The trend is your friend. Let the market pullback to the channel line to trade with the trend. Another approach is to wait for the prices to break the channel to trade the reversals. These simple approaches are healthier ways to grow your trading account while trading channels. All the best!

Categories
Forex Basic Strategies

Are You Switching Up Your Forex Trading Strategies?

Having multiple strategies can be a result of one failing in a certain market environment. Traders then try to fill up holes the original strategy had with another strategy adapted to new market conditions. According to some experts, having additional strategies is always beneficial, having more weapons in your arsenal is good.

Another common argument is that markets always change in many ways, one strategy will sooner or later start to fail. The global economy itself is cyclic, not to count all the other things mixed in. However, what if we instead of changing strategies just move into the market where the conditions are right, suitable for the original strategy? Basically, it is the same thing – adapting to changes. This concept then sets another question, how to recognize the market is not suitable for our strategy, when is the moment we need to switch strategies, to find other markets, currency pair, or assets?

There is no simple answer to this question since every strategy is different to some extent, and there are more strategies than traders. Developing a strategy that works only in specific conditions is a specialized strategy, their drawback is not only a tight schedule but also a limitation to a few of the markets available for trading. If you are familiar with automated trading scripts, you will see they are mostly designed for one or a few other currency pairs. This is because they are tested back and forth only on a limited historical/future period and only adapted to that currency pair specifics. At the moment of their public release, these strategies or scripts will run well probably. If they are not updated their performance will drop. 

We see a lot of content on the internet about having more strategies, adapting, experimenting with indicators, rules, and settings. Building your system should never stop. However, most of the traders fail not because they are not good at the technical or fundamental analysis, but money management and psychology. It is common to see traders overoptimize their systems to new conditions. Then change them again once they do not work as intended. If they are very thorough with their testing, as they should be, the operational time of their strategies is low compared to the optimization time. After all, some traders may question is it worth it to maintain and develop multiple strategies for new conditions perpetually?

Notice we have added trader’s mindset and money management into the mix that makes a strategy. According to some popular trading education resources, it is advised to be flexible. Being flexible also means not only using tools and indicators to decide but also your experience, your skill analyzing the price action. Additionally, absorb a hit or two trading with an inadequate strategy with sound money management. In other words, you have to trade and know how to trade in so many ways. Well, in our book this is just going to mess everything up. No trader is universal, traders will shape their trading ways as they see fit, and could be successful in many ways.

Technical traders will like indicator systems and have crisp money management based on them. They will have the edge as they do not have to deal with doubt, hesitation, overtrading, and other common mistakes. Price action traders with a minimalistic approach recognize historical patterns from experience and base their decisions on that. Fundamental traders take a long-term approach and people adept with coding could even indulge in making trading robots. Switching strategies and how a trader approaches trading is contradictory to their personalities and their trading cannon. 

Optionally, traders could develop a universal system. This strategy may work only in specific conditions, limiting their performance, however, there is no limitation to other markets. For example, trend following strategies would need trends, volume, but they fail in ranging conditions. Now traders know what to avoid. If a ranging market or consolidation is imminent, stop all trades and find other currency pairs or assets. Specialized strategies cannot switch to other pairs without additional tweaks. Whatsmore, their effectiveness may be short-lived if the intended pair starts different price action. Traders will now have to consider whether developing such strategies is better for them than universal strategies. 

Trying new things always carries more knowledge traders use to combine amazing indicators, strategies, and trading styles. Consider if your failures lie in your strategies or if your money management and psychology are out of place. According to many professionals, traders struggle with the latter. Be sure that if you have many strategies it is not a product of bad money management or many trading psychological issues one could have. There is no better strategy you can make without the two most important pillars. 

Some proprietary company traders even go far enough to say good money management and a random decision strategy beats the best strategies without good risk or money management. Considering this, maybe a better headline question would be “Are you changing your mind often while trading your strategies?”

There are certain times you may be put under pressure to trade, for whatever reasons, hopefully not out of desperation. It is quite normal to switch timeframes and rules. For example, trend following strategies does not have great odds when the whole forex is not active. Professional traders create a rule for these periods, money management rules. They lower their positions and if forex is almost dead, they do not trade at all. Now, switching to other strategies that work in quiet environments are likely to be reversal strategies. Sometimes they might not be adaptable to a trader’s lifestyle, especially if they require more screening time. Curious and “out of the box” thinkers could go into other possibilities and find a good automated trading solution that works great in these conditions. Forex has a place for everyone and everything, but only rewards those persistent to find the solution. 

A trader who has universal strategies that work with little adaptation to different markets like forex, precious metals, indexes, and crypto, using the same good risk management principles is a complete trader. Getting to this point is the hard work of testing, frustration, losing, and trying again. Mastering one strategy takes a long time, probably a few years. Sometimes it is normal to give up on that one if you do not have results, provided everything else is good. Those years are not wasted. More often than not, traders that have moved into other trading styles use some elements from previous work, sometimes even coming back to their old strategies that needed just a bit of knowledge and experience from another perspective. It is eureka for most of these traders, however, know such people are rare, and only they come to the top. 

As a final piece of advice, search out for other strategy resources, and experienced people. You will find out each may bring up some ideas or tools that you could use in your current system. Strategies that are not into your style of trading are also useful as they may hide some rules or money management principles you could carry over. Creative traders will enjoy this process of discovery and implementation but never forget that playing with tools is fun, money management and psychology concepts are not, yet all professional traders spent a lot of time developing them. For more info about adaptable universal strategies, risk management, and psychology, check out our previous articles.

Categories
Forex Basic Strategies

When Is the Best Time to Use Trend Following Strategies? (The Answer May Shock You)

Trend following strategies are some of the most popular strategies around today, they have grown in popularity due to the increase in social media presence of some of the larger and most successful traders, these traders often use some form of trend following strategy that shows off large profitable trades. Something that a lot of newer traders want to be able to aim for.

There are also a large number of timeframes available to trade ranging from a one minute chart all the way up to a monthly chart where each candlestick is an entire month. So the question that we will be answering is which of these time frames would be best for a trend following strategy in order to try and emulate the trades and results of some of the most successful traders.

In order to answer that question, we first need to understand exactly what we mean by a chart timeframe. To put things simply, when you are looking at a chart, the candlestick chart, for instance, each candlestick will correspond to the timeframe of the chart, so on the one minute chart, a new candlestick will be made each minute on the 5-minute chart a new candlestick will be created every 5 minutes and so on all the way up to the monthly chart where a new candle will be created at the start of each month.

Each of these timeframes offers a lot of advantages and disadvantages depending on the strategy that you are using, and many strategies will require you to use multiple timeframes for the same strategy. The time frames are generally divided up into three different categories, the short-term timeframes which include the lowest timeframes for a minute up to several minutes. The medium-term timeframes work from around 10 minutes up to around an hour, and the long term trading time frames are often seen as an hour up. So let’s get into which ones will be best for a trend following strategy.

When looking at trend traders, a short term timeframe would last up to a week, a medium-term timeframe would last up to a few months and a long term timeframe could last up to a few years. Trend traders are looking for large movements that can last a long time, weeks to months at a time, so generally, they are looking for longer-term trades and long term timeframes.

If you were to try and trade a trend on a  small time frame, let’s take 5 minutes as an example, what information would you actually be able to see? Pretty much nothing that would relate to a trend, you would see the past hours movements which could simply be an up and down cycle, but if you can only see the past hour or so, then it may look like an upwards or downwards movement, but in reality, the markets could even be moving sideways, these lower time frames simply do not give you the scope to see what is actually going on long term in the markets.

Trend trading is one of the longer trading strategies in terms of the amount of time that you hold on to trades for and so one of the strategies where you need the higher timeframe on the charts too. Trading h trend basically means that you are looking for the overall movement of the markets and then try to trade along with the trend, coming out of your trade as the markets decide to reverse. Trend trading takes a lot of technical analysis to do properly, however, there is also an underlying issue of fundamentals to take into account.

Having said that, simply watching just the long term timeframes may not be enough for trend traders to be successful, you need to have a knowledge of all time frames in order to get the most information out of the markets as you can. Seeing a trend on the monthly chart is great, this is giving a good indication of the markets movements, however in order to work out the best point of interest, you may need to take a look at some of the lower time frames in order to work out what is happening on a more micro level. 

You also need to consider your own strategy, what size of trades are you putting on? If you are planning on trading the trend, then generally the trades will be smaller but held for much longer. If you try putting on large trades in order to follow the trend, you will be putting a lot of capital at risk on each trade. Remember, you are looking for huge movements in the markets, not just a little up or down, the larger the trade you put on the more risk you are putting too. So when using the higher time frames, ensure that you are scaling down your trade sizes too in order to ensure that your account will be able to handle holding on to those trades for extended periods of time, potentially weeks to months or even years.

So ultimately there isn’t a single best timeframe for trend trading, you will need to get a good understanding of a number of different timeframes. However, getting to grips with the longer time frames such as weekly and monthly will give you a much better overview of the current trends within the market compared to the smaller faster-paced timeframes. Do not be afraid to use the lower time frames to help with your conformations, just don’t use them as the basis for your entire trade.

Categories
Forex Basic Strategies

What Are the Best Forex Strategies of All Time?

It is not every day that you come across a strategy that has been used for many years, or at least not one that can be considered as a successful one. More often than not, a strategy will work for a short amount of time, maybe days, weeks, or months, but at some point in time, that strategy will stop working. Maybe the market conditions have changed, or maybe it was just luck to begin with. Whatever the reason, there is a good chance that without any changes or adaptations, a strategy will begin to struggle.

There are however a number of strategies, that at least a form of them has survived the dangers of time, they have been successfully used over a long period of time, years, in fact, there will need to be some adaptations as things change, but the principle behind them will remain the same. So let’s take a look at what some of these long-lasting strategies are, maybe one of them could be the right thing for you.

Support and Resistance Strategies

Support and resistance trading is one of the most widely used trading styles and strategies due to its simplicity and its ability to work in ranging markets, a condition that a lot of other strategies don’t work in. The strategy is pretty simple, you are looking at the support and resistance levels, they act as a block for the price, the market will be moving higher and lower between these markers, so as soon as it hits the lower support leave you will place a buy trade and as soon as it hits the higher resistance level you will place a sell trade. It is also one of the simplest strategies to chart, you can draw the lines based on previous prices and there are plenty of different indicators out there that will automatically do it for you too. 

The support and resistance levels can also be used to work out the current sentiment and trader preferences within the markets, as well as show you when to enter or not enter the markets. Having a good visual representation of when the markets change position and where it is reversing and bouncing between will give you a good idea of what the markets may do in order to help you analyse other potential strategies too.

Trend Trading Strategies

This is quite a simple strategy in the fact that you are there to trade the market trends, when the price is moving up you will buy and when the price is trading down you will sell, some people only like to buy and some only like to sell. The strategy simply requires you to identify which direction the market is moving in and then trade that same direction. The RSI indicator is a form of trend trading that has been used for a long time and will continue to be used for a long time to come. It’s very simple. When the RSI reaches above 70 or below 30 then it may represent a potential reversal. You will then set some take profit and stop losses at the support and resistance levels in order to close out the trades, this strategy can be incredibly rewarding and very simple to do, as long as the market conditions suit it though.

Fibonacci Trading Strategies

You may well have heard of Fibonacci at some point in your trading career, it is a well-known strategy and is based on a famous mathematician from Italy. This strategy is often seen as a medium to long-term strategy and it is used as a way of following the support and resistance levels that are repeating themselves. Markets are often trending and the Fibonacci style of trading does well in these sorts of trending markets. The trading system works by trading long (to buy) when the price retraces at the Fibonacci support levels when the markets are on the way up, and when the price retraces on a Fibonacci resistance level when the markets are going downwards. It can be a very reliable and profitable strategy, but it can take a bit of time to get used to.

Scalping Trading Strategies

Scalping is a type of trading that is growing in popularity, the idea of scalping is that you are looking for smaller trades, and lots of them in order to make your profits. The strategy aims to make little bits of profits from small changes in the price, both up or down. You are able to increase your profits by simply trading more and increasing the number of trades the account is taking. The lower the timeframe the more trades you will need to win, the higher the timeframe the less you will need to win in order to remain profitable. Successful scalpers will have much higher winning ratios of trades, the one benefit to scalping is that it can be profitable in ranging markets as well as trending ones, so if you get the hang of it, you will potentially be able to make money whatever the markets are doing.

Candlestick Trading Strategies

If you look at the person next to you, they will most likely have their charts set to candlestick mode, this is afterall by far the most popular style of trading chart. There are of course other styles of charts, but these candlestick charts offer a lot more ways to analyse the markets when compared to the others. Candlesticks basically show the price movement over a certain period of time, from a small time frame like 1 minute all the way up to monthly candles. They can be analysed to look at price movements, potential reversals, trends, and breakouts, they can be seen to demonstrate and indicate many different trading phenomena. Learning what the different candles mean can be extremely valuable to a trader and can be an opportunity to make a lot of profits if you are able to successfully read them.

So those are some of the different trading styles that you are able to use and that have withstood the test of time. All five of them have been used for many years and will continue to be used for many more to come, so if you are looking for a strategy that you can keep going for a long time, one of these five would be a good place for you to start.

Categories
Forex Daily Topic Forex Videos

Secret Techniques For Profitable Forex Trading Part 1!

Secret Techniques for Profitable Forex Trading I


Profitable Forex trading is an elusive goal for many traders. According to most statistics, over 75 percent of traders lose money. This comes for several reasons. There are well-known causes of this unfortunate outcome. Most traders get blown out because they bet too much and lose all when the market turns against them. Another source of failure is their psychological bias to let losses grow and cut their profits short. But today, we will focus on one key factor: How to assess entries and exits properly.

The States of a Market

Many people classify market action into over six states: Bul, Bear, Sideways with high or low volatility. Although this is usually correct, it does not offer enough simplicity to make decisions. The best way to look at market action is similar to what the Elliott Wave Theory states: Elliott stated that the market had impulsive phases and corrections of this primary impulse. We don’t need to be a genius to see that it is logical. Waves need to swing for it to form. But impulses and corrections have different properties. What works on one, it does not work on the other. Thus, the secret to master the trade is to
Assess which state the market is on
Apply the proper tools for entries and exits.

Impulse Properties

Impulses are characterized by directional movement. Bull or bear, we can see a steady price movement toward a new equilibrium, as impulses are created by an imbalance between supply and demand. The volatility on impulses is directional, and the tools to apply are moving averages and superior form of them such as instant trend, MAMA, MESA, and similars.

Chart 1 – Bitcoin 4H chart impulsive Phase

In chart 1, we show Bitcoin moving in its latest impulsive phase, although we can also see a glimpse of corrective structures. The main idea here is to follow the trend. The chart shows a ribbon formed by Ehlers Instant trend, an advanced indicator freely available on Tradingview but also MT4 and MT5 platforms.
We see that the indicator is right at delivering timely entries and exits. The chart also shows its 50 and 200 simple moving averages, heading up and supporting the trend. We can see that the touching of the 50-SMA line could be used as well to enter or add to the position, although the instant trendline seems to lead the 50-SMA. Tradingview’s Instant Trendline Indicator colorizes the candles’ body so the upward phases can be spotted with ease.

Corrective Properties

Corrective phases come at the end of an impulse. We have to realize that impulses come from a lack of equilibrium between buyers and sellers due to actions to find a new fair value. The fair price is unknown; thus, usually, the impulse creates overbought or oversold conditions. When some savvy traders spot this, they start to unload their positions in a profit-taking activity. That lowers the price to a level where it finds new buyers. The price moves up now, but the memory of traders who lost near the top makes more selling pressure ahead of this level, lowering the price and creating a cyclic path. Thus, the main characteristic of corrective phases is its cyclic characteristic, whereas the main feature of impulses is their lack or decline of cycles.

Since the cycle is the main component of corrections, The best way to time them is by using an oscillator, such as the Stochastic, RSI, or an advanced wave oscillator. If you’re price-action oriented, you may use support-resistance levels and breakouts to spot the right entries and exits.


Chart 2 – Bitcoin 1H chart Corrective Phase with Ehlers Stochastic CCI, Stochastic, and AutoCorr Angles.

As an example, we show on chart 2 the corrective phase of Bitcoin that started after a move up to $15,000 from the last consolidation of $13,500.
The image shows the stochastic oscillator( third curve) and two advanced oscillators buy the innovator of this century, John Ehlers, The Stochastic CCI, and Autocorrelation Angle. These two can also be found on Tradingview.com and MT4 and MT5 platforms.
We see that the Ehler’s Stochastic CCI (second curve, following the price) can precisely time the cycles on the chart with razor-sharp precision. However, the Stochastic oscillator is not far behind and can be used to profit from these cycles or confirm a reversal candle.

The bottom image shows the Autocorrelation angles indicator.
Autocorrelation is an advanced way to spot the short-term memory of the markets. A sharp move on the angle will show a transition from bear to bullish and bullish to bearish phases. This indicator is harder to handle, though.

There are many others, such as the Even better Sinewave indicator, shown in the third chart. The Even Better Sinewave is designed to find the dominant cycle of the price action. Sometimes, the market loses its pace, as happens in the whipsaw (amber) shown. But most of the time, this advanced indicator can time the cycle changes accurately.


Chart 3 – Bitcoin 1H chart Corrective Phase with Even Better Sinewave Indicator

To conclude
Markets have two phases: Impulsive and corrective.
Each needs the right tools to find suitable entries and exits.
Traders need to spot first the state of the market.
If Impulsive, apply Averages or advanced versions of moving averages and follow the trend.
If corrective, use oscillators to spot turning points.
Don’t be conformist. Look for advanced tools and learn to use them. They will give you a better edge.

Categories
Forex Basic Strategies

FX Strategy Selection Is Everything: Here’s How to Choose Wisely…

Are you a new trader that’s still trying to figure out which strategy will work best for you? Or perhaps you’ve been trying something that just isn’t working well and you’re looking for a strategy that works better with your own personal trading style. Below, we will outline some of the most popular trading strategies, along with their pros and cons to help inspire any trader that needs to switch up their strategy. In this article, we will talk about the following strategies:

  • Price action trading
  • Range trading
  • Trend trading
  • Position trading
  • Day trading
  • Scalping
  • Swing Trading

First, you’ll need to understand that each strategy is unique in its own way. Some strategies require more of a time investment, while others won’t require as much time in front of your computer. You’ll also find more trading opportunities and different risk to reward ratios, depending on the strategy you choose. 

Price Action Trading

Traders that use this strategy typically look at historical price data on charts in order to form more technical trading strategies. In some cases, traders look at fundamentals like economic events, but they usually stick with historical data. The technique can be used alone or in combination with indicators. Traders use Fibonacci retracement, candle wicks, indicators, trend identification, and oscillators in order to define support/resistance levels for entry and exit points when using this strategy. One of the benefits of using this strategy is that it can be incorporated over short, medium, or long-term time periods, and several other options on our list fit within this category. 

Range Trading

Range trading traditionally uses technical analysis in order to define support and resistance levels that inform traders where to enter and exit trades. Traders often use oscillators in combination with this strategy, with RSI, CCI, and stochastics being the most popular choices. This is yet another method that can work with any time frame, but it does require a lengthy time investment per trade. There are some things to look out for, as the strategy is most successful when the market is calm with no detectable trend and it is very important to have a strong risk-management plan in case breakouts occur. On the bright side, there are many trading opportunities and there is a good risk-to-reward ratio with range trading.

Trend Trading

Trend trading is considered a simpler trading strategy with the goal of making profits by exploiting the market’s directional momentum. Traders using this strategy calculate their entry points using oscillators, while exit points are based on the risk to reward ratio. Multiple timeframes can be used, although this strategy most commonly used medium to long-term timeframes. 

Position Trading 

Position trading mainly focuses on fundamental factors and especially economic circumstances without paying attention to minor market fluctuations. This is a long-term strategy that judges entry and exit points based on technical analysis and other strategies. 

Day Trading

This popular strategy involves opening and closing one or more trades within the same trading day, making it a short-term strategy in which trades are opened from minutes to hours within the same day. Traders use different means to determine entry and exit points when using this strategy.

Scalping

Scalpers try to profit from small price changes by placing multiple positions per day. This short-term strategy prefers more liquid forex pairs because they generally come with tighter spreads. Scalpers define entry and exit points by defining the trend, often in addition to using indicators and oscillators.

Swing Trading 

Swing traders hold positions anywhere from a few hours to a few days while attempting to profit from trending markets and range bound. Traders typically favor long-term trends as they provide more of an opportunity to capitalize. Once again, indicators and oscillators are primarily used to calculate entry and exit points.

Categories
Forex Basic Strategies

Pairing Significant S&R Levels With RSI Indicator To Generate Accurate Trading Signals

Introduction

In the previous set of articles, we discussed strategies based on trend continuation or trend reversal. Let us change the subject a little bit and discuss a strategy based on ‘Support and Resistance.’ Although we all know how to trade support and resistance, there is always a problem of consistency when it comes to trading using the conventional support and resistance strategy. We have a look into some of these issues by designing a strategy that provides not only decent risk-to-reward (RR) but also a high probability of success.

Markets are continually changing due to changes in market participants, global politics, and economic events. This means if we continue to trade the usual way, we could be in trouble. It is necessary that, along with markets, we, too, change our trading strategy in order to adapt to the changing market environment.

Time Frame

The strategy works well on the 1-hour, 4-hour, and ‘Daily’ time frame. Therefore, the strategy is suitable for the swing to long-term traders.

Indicators

We make use of only one technical indicator in the strategy, and that is the Relative Strength Index (RSI) with its default settings.

Currency Pairs

The strategy is suitable for trading almost all currency pairs listed on the broker’s platform. One thing we need to ensure before choosing a currency pair is that it should be volatile.

Strategy Concept

‘Cup and Handle’ is a powerful candlestick pattern that shows the prevalence of bullish strength in the market. It is a very reliable pattern that offers excellent trading opportunities. ‘Cup’ formation indicates that the price was unable to make a proper ‘lower low’ on the higher time frame due to a strong buyer who took the price up. The ‘handle’ indicates that the market was unable to reach the previous ‘low’ due to weak sellers where eventually buyers bought at a higher price and are in the process of making a new ‘higher high.’

The logic behind the formation of the ‘Cup and Handle’ pattern makes it one of the most powerful patterns. But the pattern alone is not the basis for the strategy; we also use the RSI to take the highest probability trades. We apply the concept of ‘Cup and Handle’ pattern and RSI indicator at a long-term ‘Support’ level to execute low-risk ‘long’ trades.

The same concept applies when taking ‘short’ trades at long-term ‘Resistance’ level. Here we should look for the formation of the ‘Inverse Cup and Handle’ pattern at ‘Resistance.’ ‘Cup’ here indicates that the price was unable to make a proper ‘higher high’ on the higher time frame due to strong seller who crashed the price. The ‘handle’ indicates that the market was unable to reach the previous ‘high’ due to weak buyers where eventually sellers sold at a lower price and are in the process of making a new ‘lower low.’ We use the RSI indicator to take the highest probability trades by looking for ‘overbought’ and ‘oversold’ situations in the market.

Trade Setup

In order to use the strategy, we have considered the 4-hour chart of AUD/USD, where we will be illustrating a ‘long’ trade using the rules of the strategy.

Step 1:
The first step is to identify long-term support and resistance levels. By long-term we mean, support and resistance levels on the 1-hour time frame and above. Note that the greater number of touches, the stronger is the support or resistance. We would recommend at least three touches at the support or resistance to calling it a strong one. To raise the odds in our favour, we can look for trading at support level in an uptrend and resistance in a downtrend.
The below image shows long-term support being formed in the AUD/USD pair on the 4-hour chart.

Step 2:
Once we have identified the critical technical level, we will wait for the price to present the ‘cup and Handle’ pattern at support and ‘Inverse Cup and Handle’ pattern at resistance. Here we should make sure that when the price at support, the RSI indicates an oversold (below 30) situation in the market at least once and then shows up the pattern. On the other hand, when the price is at resistance, the RSI should cross above the level of 70, indicating an overbought situation and then show up the ‘Inverse cup and handle’ pattern.

Step 3:
After ensuring that the pattern is formed at the right place along with suitable indications from the RSI, we now discuss how to enter the trade. In a ‘cup and handle’ pattern, we enter ‘long’ right at the price break out above the ‘high’ of ‘cup’ pattern. In an ‘inverse cup and handle’ pattern, we enter ‘short’ when ‘price’ breaks below the ‘low’ of the ‘cup’ pattern.
The below image shows an example of we enter for a ‘buy’ at ‘support.’

Step 4:
After entering, it is essential to determine the stop-loss and take-profit levels for the trade. One of the primary reasons behind low risk-to-reward (RR) ratio is late ‘entry.’ Stop-loss is placed below the ‘low’ of the ‘handle’ pattern in a ‘long’ position and above the ‘high’ of the ‘handle’ pattern in a ‘short’ position. The strategy essentially says to enter when prices have travelled a decent amount of distance from support or resistance, which considerably reduces the risk-to-reward (RR) ratio.
The below image shows the result of the trade executed using the above strategy where the resultant risk-to-reward (RR) of the trade is 1:1.

Strategy Roundup

Although the ‘Cup and Handle’ pattern is a bullish continuation pattern, if we understand the logic of the pattern and apply at key technical levels, it can provide excellent opportunities for short as well as long-term traders. Using the RSI indicator along with the pattern gives an extra edge to the strategy, which makes it highly suitable in changing market environment.

Categories
Forex Basic Strategies

Holy Grail Forex: Three Successful Strategies

“Holy Grail Forex” is what traders call a successful strategy, which gives virtually no unprofitable trading. To search for the Grail, traders can take many months, even years, but cannot find it. It is very evident that there are no perfect strategies, but if we have the right approach, virtually every strategy can be made into a Grail-like trading system.

Rules for Creating an Ideal Trading System

The strategy should not be overloaded with technical indicators. The “more indicators, better” rule does not work. A professional trader can earn money using simple classic tools (mobile, Bollinger bands, oscillators, etc.) and by combining them correctly.

The trading system is tested in the demo, and then in the account cents with a minimum of 100-200 transactions, setting the main indicators: maximum profit and loss, a series of profitable and unprofitable operations, the relationship between average profit and average loss, etc. During testing the trading system optimizes the configuration of parameters and indicators from the point of view of optimal profitability and moderate risk. If at any time there is an anomaly in the actual trading account of the statistics of the working indicators of the test indicator system, the negotiation stops for the search of the causes.

The success of a trading system depends largely on the psychology of the trader. The key to success is composure, control over emotions, risk minimization, and self-confidence. Don’t be afraid to experiment. I prefer to use combined indicators in strategies, which are built on the basis of modified classical tools. Here are some examples of these indicators, which can be downloaded for free and installed on MT4. The strategies are polished and show good results. The main thing is to comply with risk management rules and not pursue surplus profits.

1. Strategy of “Bollinger Bands and MACD”

Simple channel strategy, the basis of which is a single combined indicator. Its composition includes:

Bollinger Bands is a basic channel indicator that denotes limits, support levels, and resistance. The rupture of the channel limits signals the emergence of a new strong trend, but more often the trend is reversed from the limits of the channel in which the strategy is built.

MACD is a very popular indicator that is used to test the strength and direction of the trend, is built based on moving averages. The combo indicator can be downloaded for free. After downloading the file, it must be copied to the MQL4/Indicators folder. Then, in the “Charts/template” menu, find the template of the indicator installed and run it. Recommended settings for BB_MACD are already listed in the template and cannot be changed without a deep understanding of the indicator principles.

Since the underlying instruments are indicators of volatility, it is best not to use BB_MACD in illiquid currency pairs. I would recommend the classic pair EUR/USD and the timeframe M30. Here the results are better.

Conditions for opening a long position:

-BB_MACD draws red dots below the red line. This can be a single point, but if there are several in a row, it will be a stronger sign.

-After the appearance of the red dots on the next or second candle above the red line a green dot will appear.

-On the next sail, you can open a position.

I recommend Stop Loss at the 10-point level. Exit the market is necessary with the sequence: as soon as you have obtained a profit of 15 points, close half the position, and in the second secure the trailing stop at 15 points and leave on “floating free”. The opening of a short position is completely opposite: a series of green dots must first appear above the blue line, after which a red dot must be drawn below the blue line. On the next candle after the signal, you can open a position.

Tip: If the channel formed by the Bollinger bands visually seems narrow with respect to past periods, the position should not be opened independently of the signals.

2. Fast Trend Line Momentum

Momentum oscillator is included in most trading platforms as a basic tool. Its objective is to measure the magnitude of the price variation of an asset over a certain period by comparing the current price with the price of some periods ago. Fast Trend Line Momentum is a modified impulse, which is not calculated on the basis of the closing prices of the sails, but on the basis of a smoothed trend line. Thanks to this, the curve looks smoother, and the indicator itself gives more precise signals.

Currency pairs -any liquid active, timeframe -1 hour.

Conditions for opening a long position:

-The oscillator draws a consecutive series of 3 or more red columns below “0”. Green columns should not have.

-The last “column” drawn must be located below level -0.002.

-Once the above conditions are met, a green column appears on the chart. The signal will be even more accurate if in the green column the candle is rising.

-Immediately after the green column has been drawn, open a position.

Everyone decides for themselves when to close a position, depending on their appetite for risk and the nature of the market, but I would recommend not to overexposure, closing half at the level of 10 points. The conditions for the opening of sales positions are opposite.

3. Stochastic + JRC + RSI

This indicator combines three basic tools, which are often used in beginner strategies:

-Stochastic oscillator that reflects the level of overbought and oversold of the asset. It is used to identify reversion points.

-CCI is an indicator that shows the overall rate of exchange of quotations of an asset in the market.

-RSI is a relative force index that also helps to identify potential points of trend reversal and the emergence of a new direction.

The simultaneous connection of three oscillators is an indicator, which shows their weighted average, helps to monitor the state of the market. Although exact signals to open the strategy position do not usually occur very often. Currency pairs GBP/USD, EUR/USD, 1-hour timeframe.

I recommend leaving the indicator settings in basic. Note the weight parameter, this is the weight coefficient of each oscillator in the general formula of the indicator, which can be adjusted in the range from 0 to 1. For CCI and RSI, the default value is 0.1.

Conditions for opening a long position:

  • The green line falls below -50.
  • The red line remains above -50.
  • The red line is crossed by the green line from bottom to top.

When these conditions are met, one position can be opened on the next sail. The greater the angle of intersection, the better the signal. If the green line crosses the red line almost in parallel, the signal may be false.

The selling position opens in opposite conditions, but with a level of 50 and with crossing the green and red lines top down. The indicator can be used with other tools, for example, slider analysis or graphics.

Conclusion. These simple strategies are convenient because they are not overloaded with redundant indicators and position opening points are easy to examine. The use of a combined indicator instead of basic 2-3 saves the trader time and simplifies control over the situation in the market. Recommendations for optimizing strategies:

Determine the time when strategies give more frequent and accurate signals.
Do not negotiate on these strategies in flat and at the time of publication of the news.
If the strategy gave 3 consequential unprofitable signals, take a breath or change settings.

Categories
Beginners Forex Education Forex Basics

Signs that you Need to Ditch your Current Trading Strategy

Think back to the beginning of your trading career: did you adopt a trading strategy that was promoted by others, or did you create your own system that was intended to be perfect? You’ve likely come across claims of “holy grail” trading strategies before and it can be easy to get caught up believing that these systems are a one-size-fits-all answer to all your trading woes. Unfortunately, the strategies you read about online might not always work for you, or a strategy you’ve created yourself may prove to be less than profitable. If you’ve been questioning your strategy lately, see if it fits in with the following sings so that you’ll know whether to keep it up or ditch it completely.

Sign #1: You Have Trouble Following your Trading Rules

One of the most important things you need to do once you have a trading strategy is to keep using it consistently and to follow all the rules you have set. If the rules are too vague or specific to follow, this is a good sign that they need to be adjusted if possible or that the trading plan might not be well thought out enough or just too specific overall. On another note, a plan with rules that are overly difficult can also cause frustration or lead to mistakes if you’re having issues determining what to do. 

Sign #2: If you’re Feeling Burnt-Out

How much effort does your strategy take? It’s true that you’re going to have to put some time into trading if you want to make money, but you shouldn’t have to be online 24/7 to do it. If your plan is leaving you feeling burnt-out because it requires more effort than its worth, you probably need to ditch it for a less time-consuming option. After all, flexible hours are one of the main benefits of forex trading and there are many options out there that don’t require you to wake up at daybreak. 

Sign #3: The Cost is too Much 

It’s okay to spend money on indicators, strategies, and EAs and some of these systems can be profitable. However, it’s important to ensure that these systems are actually paying for themselves and bringing in some profits on top of the cost. You also need to be skeptical when the creators of these systems claim that they are foolproof or guaranteed to make a certain profit for you. Some of these options can be expensive, so be sure to look to see if you’re actually winding up with more or less money in your pocket at the end of the day.

Sign #4: It isn’t Profitable

This sign might seem obvious, but some traders might have trouble letting go of a strategy that they imagined to be perfect. If you’ve already tried changing the parameters, testing, and trading under different conditions, and you still aren’t making profits, it’s better to just let the strategy go and move on. Keep in mind that some systems work great for certain traders but don’t work well for others because of the attention they require, difficulty levels, your trading personality, and other factors. In the end, if you just aren’t making money, you need to look for a strategy that better fits with your own personal trading style.

Categories
Forex Basic Strategies

An Exclusive Strategy To Trade The Fiber (EUR/USD) Currency Pair

Introduction 

In the previous article, we discussed a trading strategy that was a combination of EMA and RSI. Presuming that all the readers easily understood it, we will now discuss a trading strategy that is a combination of three technical indicators. Today’s article will acquit us with another useful and reliable trading system that is based on the combination of Simple Moving Average, Stochastic Oscillator, and Relative Strength Index (RSI).

Time Frame

This strategy is only applicable on the 1-hour time frame. This is because all the indicators tend to sync in this time frame. Therefore, the strategy may not be suitable for day traders.

Indicators

The strategy consists of three indicators – a 150-period Simple Moving Average (SMA), Relative Strength Index (RSI) with period 3, and a Full Stochastic Oscillator with standard settings. The overbought and oversold levels for the indicators stand at 70-80 and 30-20, respectively.

Currency Pairs

As the name suggests, this strategy is exclusively meant for ‘EUR/USD.’ The liquidity and volatility of EUR/USD are extremely supportive of this strategy.

Strategy Concept

We first identify the direction of the market using the 150-period SMA and then establish a channel in the same direction. This is the first condition that has to be met before we can initiate a ‘trade.’ One could also this is a ‘channel’ based strategy as it involves going ‘long’ at the bottom of the channel and ‘short’ at the top once the indicators generate signals.

For a ‘long’ entry, we need to see if the Relative Strength Index drops in the oversold area. Once it drops, we look for a bullish crossover of the Stochastic lines, while they are also within their oversold zone. In simple words, we need a channel in a bull trend with both the indicators indicating that the market is oversold and with the Stochastic displaying a bull reversal.

Conversely, a ‘short’ trade is generated when the price starts moving in a downward channel in a bearish trend. The RSI and Stochastic should be in the overbought area that will later display a bearish reversal. As soon as the Stochastic fast and slow lines make a bearish crossover, we enter for a ‘sell’ on the next price bar. All of the above price action must happen below the 150-period SMA.

The strategy offers a high degree of capital protection as we place our stop-loss at the most recent ‘swing low’ or ‘swing high.’ As far as the ‘take-profit’ is concerned, we can use a fixed profit target, or we could scale out as the market approaches our target and protecting it with a trailing stop. An exit signal is also generated by the Stochastic indicator, which we will be discussing in the upcoming section of the article.

Trade Setup                     

In order to explain the strategy, we have considered the 1-hour chart of EUR/USD, where we will be applying the rules of the strategy to execute a ‘long’ trade.

Step 1: First of all, open the 1-hour chart of EUR/USD and establish the trend of the market. Plot Simple Moving Average (SMA) with a period of 150, Stochastic and Relative Strength Index with their default settings on the chart. If the price is above the 150-period SMA, we say that the market is in an uptrend. Whereas if the price is below the 150-period SMA, we say that it is in a downtrend. Next, draw a channel within the trend. It is better to have an upward channel in an uptrend and a downward channel in a downtrend.

Step 2: This is the crucial step of the strategy, where we align the three indicators together to generate a signal. After the identification of the trend and channel, we need to wait for the price to come at the extreme of the channel. In an upward channel, the price should be at the bottom of the channel, while in a downward channel, the price should be at the top.

Once the price reaches these extremes, we should watch the Stochastic and RSI. We enter ‘long’ when we notice a bullish crossover in Stochastic and an oversold circumstance of RSI (below 40). This means that the price might be putting up a ‘low’ that will result in a reversal. Similarly, we will go ‘short’ in the currency pair when we notice a bearish crossover in Stochastic along with an overbought condition of RSI (above 60).

The below image shows an example where the above step is being accomplished.

Step 3: In this step, we shall determine the Stop-Loss and Take-Profit for the trade where both these levels are derived mechanically. We place the stop-loss just below the ‘swing low’ from where the reversal took place. It will be above the recent ‘swing high’ in a ‘short’ trade. When speaking of the take-profit level, there is no fixed point for it. We take our profits when Stochastic reaches the opposite overbought/oversold level. At this point, we can either exit the trade, scale-out, or use a trailing stop. This can help in increasing the risk-to-reward (RR).

In our case, the risk-to-reward (RR) ratio of the trade was 1.5, which is above average.

Strategy Roundup

The RSI+Stochastic+SMA strategy is a reliable trend trading system that accurately pinpoints the bottom of a channel in a trend. More importantly, the strategy can provide the best-with-trend entry points that are necessary to increase the probability of winning. Since we are applying this strategy on a higher time frame, it will limit the effects of whipsaws that are encountered more often these days.

Categories
Beginners Forex Education Forex Basic Strategies

Simple FX Scalping Strategies to Put to the Test

The fact that you are here means that you most likely know what scalping is. For those that don’t, scalping is one of the fastest styles of trading, you are looking for very short term profits putting on a vast amount of trades. It is also considered to be one of the riskiest trading strategies that you can do as it is far harder to put proper risk management in place due to its quick nature. It is the main strategy style that many in the outside world would compare to gambling, simply due to the fact that you are putting on so many trades in the hope that more win than lose (that is how it is seen from the outside). Even with its risks, this does not mean that you should not take it up as your main style, a lot of people make a lot of money out of it.

Before we get into some of the easy to use strategies, let’s just outline exactly what scalping is, as many have a misconception as to what is involved and some even see it as the easy route to money, which we must point out now is certainly not the case. Scalping is all about putting on small trades trying to make small profits, normally between 5 to 10 pips. When done over a longer period of time these small profits all add up to larger profits. For this reason, you are required to use an account with low spreads and preferably low commissions too. When scalping one bad trade could potentially wipe out the profits of 4 or 5 good ones, which is why it can be so risky.

In order to be a good scalper, you need to have the right mindset for it, there is a lot of stress that comes with scalping, you need to be able to deal well with it, you also need to be able to deal with a lot of risks, if you are a very risk-averse person then you may struggle to keep scalping for long, as you will always be putting extra risk on your account. You also need a broker with pretty good servers, as scalping is so quick, you need a broker that is able to activate the trades quickly, this also goes for your trading platform. If there are any delays within the platform when communicating with the broker, it could be the difference between a winning trade and a losing one.

The other thing that a scalper needs is volatility, if the markets are not moving then there is very little chance or opportunity to make any profits. It doesn’t matter if h markets are moving up or down, just as long as they are moving. If the markets are not moving at all, then it may be time to take a break or think about a different style of trading for the time being. You need to learn how to read charts and how to get them quickly, scalpers normally use charts ranging from the 1-minute chart up to the 1-hour chart, charts any bigger than this will not really be useful as you are looking for smaller movements rather than large ones. Some people decide to scalp before, during, or after major news events, this can be very profitable but also very risky, so unless you know what you are doing, we would advise avoiding the news.

So we know a little about scalping, now let’s take a look at some of the more simple scalping strategies (in no particular order) that you could try out.

Volume and Price Action

When using this strategy it is required that you eat a few volume indicators to help you look for price action, the strategy is based on the idea that changes in volume are normally then followed by some price action. So in that way, the volume will act as your signal and the price action would then act as your confirmation. When the volume is low, it can be an indication that the trend is beginning to slow down and that a reversal may be approaching, or that it needs to take a break before then continuing the trend. Scalpers need to see their patience when the markets are ranging, they need to spot volume spikes alongside the price action, attempting to buy or sell before the price moves. If you are planning on using this strategy the be aware of where you get the information from, if it is a broker give statistic then it may only be taking into account the orders that they themselves are fulfilling, you won’t be able to get an entire picture as to what the actual volume is, but some indicators make a god job of it.

Exponential Moving Averages

This strategy relies on EMA (exponential moving averages) indicators. You most likely would have heard of them at some point through your journey. The EMAs are pretty easy to use, they work by showing us the underlying trend that is currently behind a forex pair, it does this by showing the average price over a certain period of time instead of showing you the current price. The strategy is pretty straightforward, when the price is above the EMA then it can be a signal to sell, when it is below the EMA then it can be a signal to buy. It is recommended that you use more than one EMAIL though, it helps to improve the accuracy of the signals that you are receiving. Using a slower and a faster EMA, one on the 10 EMA and one on the 20 EMa seems to work well, a sell signal would be when the price reaches the lower EMA, a buy signal would be when the price reaches the higher EMA.

Stochastic and Trend Lines

To use this strategy you will need to use the Stochastics indicator as well as trend lines. Stochastics is pretty straight forward, it basically helps to measure whether something has been overbought or oversold, if it is above 80 then it is classified overbought, and below 20 as oversold. This strategy works best during an up or downtrend, you need to draw the trend zones onto the chart, either yourself or using another tool or indicator. The strategy works by looking for the trend line, when it is met or crossed, you would then use stochastics to look for it being oversold or overbought as a signal to enter the trade. It is a slightly safer strategy as it requires two conditions to be met, the trends one and the stochastic is another.

Dynamic and Static Support and Resistance

This is a strategy that is pretty much entirely based around support and resistance levels. The static support and resistance levels refer to the levels from the beginning of the day, the highest and the lowest points. It is best to identify these when you first start trading. Dynamic support and resistance levels on the other hand are always changing and depend on the market movements and fluctuations, they can be a lot more subjective than static levels, someone may have certain levels while another trader may have different levels. This strategy will look for where the static and the dynamic support levels meet, these will be your buy and sell positions. You can use other indicators as confirmations, but the strategy is simply where the two trend lines meet.

Bollinger Bands

One that you most likely would have heard of as it has become increasingly popular. Bollinger bands are used to help you see volatility, the further they are from the centre, the higher the levels of volatility. If the bands are close together then it means that the markets will most likely be ranging and for a scalper, this is a time to avoid trading. The strategy is simple, when the prices are by the upper band then you sell, when the prices are at the lower band then you buy. It can be done in a ranging market but it is far more difficult to be consistent in a ranging market. Try and set a stop loss around 10 pips above or below the bands in order to keep tight stop losses but to also allow a bit of movement.

So those are a few of the strategies for scalping which are regarded as pretty straight forward, not all strategies will work in all situations, it is also important that you do not try to over complicate things, if you do then you could end up confusing both yourself and muddying the signals that you have been receiving. Make sure you are also backtesting your strategy and also trying it out on a demo account to ensure that it is both consistent and that you are able to successfully implement it as well as fully understand h signals that you are receiving. Scalping can be very profitable, but also very risky, so practice, practice, practice, and then practice some more.

Categories
Beginners Forex Education Forex Basic Strategies

Let’s Discuss Get Rich Quick Trading Strategies

A lot of the adverts that you see around the internet all seem to be based around the fact that you are able to get rich pretty quick, even overnight when trading, but is this actually the case? Can you actually get rich overnight, or is that just a fantasy?

The truth of the matter is that you can in fact get rich quick overnight, it certainly is possible, is it likely? That is another question and one that is a resounding no, so you can get rich, but you are far more likely to lose any money that you put in rather than making more. We will point out straight away, that while he adverts may say that you can get rich quick, you certainly won’t with them, those sorts of adverts are complete scams and should be avoided at all costs.

There are a few different strategies that you could use to get rich pretty quick, again we must point out that we are not recommending that you try these strategies, there is probably a 0.01% chance that you can sustain them for more than a day or two and so they are ultimately a sure-fire way to lose your money and to blow your account. So let’s take a little look at what these strategies are.

Double or Nothing

The name pretty much suggests what this one is, it is pretty much like flipping a coin, you will either double your money or you will blow your account. It is certainly not something that you should be doing unless you are pretty heavily drunk and are happy to throw away whatever money you have lying about. You will simply put on a trade with a much higher trade size than you should, place a take profit at the point where the balance would double, place, and sit back and see what happens. Some people put it to a 10 pip movement to blow, others a bit more, but people who do this are often looking for a quick turnaround, so it will normally only take a few pips up or down to either double or blow the account. I am sure that you can see why this is not a sustainable method, simply because at some point you will be wrong and that will be everything gone.

For those that wish to try this rather risky strategy, we would highly recommend that if you win the first trade, take out the initial money, at least this will protect the moment that you put in. We have actually seen people win  3 or 4 of these trades in a row, going from $10 to $160 in next to no time, of course, the next trade lost and so they lost it all. If you remove that initial deposit, at least you won’t have lost anything. We have also seen people lose the first trade 5 or 6 times in a row, will take a lot of luck to make that money back and if you get into that situation, it is probably better to just quit and walk away.

Martingale

If you have been in the casino game or done any sort of gambling in the past then you would have probably heard of the Martingale strategy. The strategy was eaten and was popular in 18th century France. The strategy is based around doubling your bet or in this case trade size each time that you lose. So if you had a trade of 0.01 lots which lost, you would then do a trade of 0.02 lots, if those lose then you would do a trade of 0.04 lots, you would continue to do this until you had a trad that won, the winning trade would then win back all the original losses plus the profits that the original trade would have won. Seems like a good strategy, and in theory, it is. In theory, it could give you a 100% profit rate as you will eventually have a winning trade, won’t you? Yes, but how long will it take?

The problem with this strategy is that it could take an unlimited amount of money in order to make that trade. If you have a balance of $100 you will only have a certain number of trades available for you before you lose all your money, if you have a $1000 account, you only have two extra trades than you would have and $100. The more times you need to trade, the amount required will grow exponentially, so unless you have an unlimited amount of money, at one point or another, you will blow the account.

Rapid Trading

Another form of trading that looks to try and double your money, or at least trade it up as quickly as possible is something called rapid trading, this basically involves you making a lot of trades, and we mean a lot of trades in order to take lots of little profits. The problem with this trading strategy is that it is very easy to overwhelm yourself with the number of trades that you have. In a normal scenario, you may have one, two, or maybe three trades active at any one time, but with the rapid trading strategy you can quickly grow up to 100 open trades, on various pairs, or even on the same pair. The issue really becomes apparent when you do not have stop losses set properly on these trades, so you could ultimately have 100 small trades going against you at the same time, giving the same results as placing one very large trade, well above the size that you should be trading.

There are a number of different expert advisors that have been set up to work this way, they are often the ones claiming that they are able to double your money in a day, and they actually can, the problem is that they may double it one day, the next day they will completely lose everything. This is an extremely reckless strategy to be using and one that we would certainly not recommend. Having said that, it does look pretty incredible seeing 100 different grades all changing prices at the same time, it looks good but doesn’t work well.

Borrow Money

This is probably the worst idea that you could probably have, yet it is something that a lot of people still do. One of the major sayings and pieces of advice that people are given is not to trade anything that you cannot afford to lose, this ensures that you are still able to pay your rent and buy some food, so what would make you think that it is a good idea to borrow some money in order to trade? We understand that having more money means that you can make more money, but what if you lose? There is a  good chance that you will lose, if you do, then how are you going to be able to pay that money back.

Trading or gambling with borrowed money is a disaster waiting to happen, if the thought of doing this ever crosses your mind, try to think about what would happen if you lose, you will be paying that money back for years to come, a lot of years depending on the amount that you borrow. Don’t do it, just don’t. Only trade what you can afford to even if the prospect of making a lot more money is a good one.

So those are a few different strategies that really can live up to the promise of making you rich pretty quick, the problem is that the chance of them actually making you rich is very low due to the massive amounts of risk involved in them, in fact, we would just as likely suggest that you put all of your money on the lottery, you probably have just as much chance of winning that than you do for these strategies to succeed over any long period of time.

We would advise that you stick to tried and true strategies that have been tested and proven to work, trading is not a quick money-making scheme, it is a long term project that can really change your future if used properly.

Categories
Forex Basic Strategies

Combining Moving Averages with Parabolic SAR To Generate Accurate Trading Signals

Introduction

Trend trading is a great way to earn money from the forex market. Any retail trading strategy based on a trend continuation pattern works well when it moves within a trend.  Therefore, in this trading strategy, we will take trades from minor corrections using the parabolic SAR towards the trend.

Furthermore, we will use a 100-period exponential moving average to determine the trend. If the price is trading above the 100 exponential moving average, we will consider the trend as an uptrend. If the price is trading below the 100-period exponential moving average, it will consider it a downtrend. We will follow a simple logic by considering buying trades when the market moves up and considering sell trades when the market is moving to drown.

However, there are no specific rules about the period of your moving average. Some traders are comfortable with 100 EMA, while some traders are compatible with 20 EMA or SMA. Therefore, if you’re trading in a lower timeframe, you can use any moving average from 20 to 100 periods. However, we will focus on 100 EMA as it provides good profitability based on swing trading ideas.

Why Should We Use Parabolic SAR?

Parabolic SAR is a forex trading indicator that stands for “stand and reverses.” This trading indicator was devised by J Welles, represented by some dots below and above the candlestick. In an uptrend, dots remain below the price and indicates a bullish pressure once the price is rejected from these dots. Similarly, in a downtrend, the dots form above the price, and the price starts to move once it gets rejected from the parabolic SAR.

In the image below, we can see a clear chart of the candlestick pattern.

Let’s plot the parabolic SAR in the price chart and see how it looks like.

It is visible that in an uptrend, Parabolic SAR is below the price, and in a downtrend, the parabolic SAR is above the price. This is why the parabolic SAR is considered as a stop and reverse indicator.

Furthermore, the parabolic SAR has a built-in stop-loss function. Once the price moves up or down with a new candle, the parabolic SAR changes with the price. Therefore, you can move your stop loss once the price creates a new higher or lower low. Furthermore, you can edit the primary parameter of Parabolic SAR from the indicator’s setting, but in this trading strategy, we will use the default format.

Moving Average with Parabolic SAR

If we use a 100-period exponential moving average, we can catch the major trend direction from the minor correction. The forex market Moves Like a zigzag. Therefore, there is a minor correction in a major bullish trend and minor bullish correction in a major downtrend. If we know the major trend, we can quickly enter the trade from a correction to get the maximum reward from the minimum risk.

In the forex market, parabolic SAR usually provides trading signals earlier than expected, which might create a negative impact on your trading result. Overall, any trend following indicator does not provide a good result when the price moves within a range. In most of the cases, markets follow the trend of about 35% of the time. Therefore, it is essential to filter out the conditions where the market is moving within a range.

We can eliminate the unexpected market behavior by using the 100 moving average as it will provide a more significant trend that will prevent over-trading. In the image below, we can see how the parabolic SAR provides false trading signals when the market moves within a range.

In the ranging market, it would be difficult to make a profit using this trading strategy. Therefore, it is better to use the 100 moving average to get the overall direction of the trend.

Moving Average With Parabolic SAR Trading Rules

Every trading strategy has its unique rules. In the moving average with the Parabolic SAR trading strategy, our main aim is to follow the trend towards the direction of 100 EMA.

Overall, we will follow simple rules as Complex trading rules make it challenging to implement it on the chart. You can make good profits with a simple trading strategy if you can utilize it well with appropriate trade management and money management rules.

Timeframe

The moving average with the Parabolic SAR trading strategy works well in all timeframes from 5 minutes to weekly charts. The longer timeframe will provide better trading results. However, it is better to stick to the 1 hour to daily chart as it can cover fresh moves driven by banks and financial institutes.

Currency Pair

There is no obligation to use a currency pair. However, it is better to use a currency pair that does not remain within a range for a long time like EURCHF. Therefore, all major and minor pairs are good to go with this trading strategy.

Buy Entry (Inverse for Sell Entry)

  • Identify the price above the 100 periods moving average. If the price is choppy at the 100 EMA, Ignore the price chart, and move to another market.
  • Identify the parabolic SAR to point dots below the candlestick, which will be a buy signal (above the candlestick is a sell signal).
  • Later on, place a buy stop order above the candlestick high.
  • Put your stop loss below the printed dot with some buffer.

Example of Parabolic SAR Strategy

At the image below and see how parabolic SAR provided a buy trade setup.

  • Notice that the price is moving in a range at the 100 EMA area with a violation. The blue horizontal line represents the support and resistance level, where the price is consolidating. In this consolidation, we will not take any trade.
  • If you look at the price structure, you can see the price is moving within a range from their resistance to support. On the price move above the 100 exponential moving average, you should put a pending order above the range, projecting that it will break out from the resistance level and create an impulsive bullish pressure.

Stop Loss and Take Profit Set

When you put the pending order above the resistance level, you should put a stop loss below red dots that have appeared below the candlestick. While setting the stop-loss, make sure to use some buffer of 10 to 15 pips.

Later on, hold the price until it points red dots above the price. The red dot above the price will indicate that sellers are entering the market, and there is a possibility to create a new lower low. Furthermore, while sitting the stop loss and take profit, you should follow the basic rules of price action, including the breakout and pullback.

Summary

Let’s summarize the moving average with the Parabolic SAR trading strategy:

  • You should look for a fresh trending movement above or below 100 exponential moving average.
  • Parabolic dots below the price will provide buy-entry, and parabolic dots above the price will indicate sell-entry.
  • You should avoid ranging markets where the price might violate parabolic dots.

Moreover, trade management and good trading psychology are mandatory for every trading strategy. You cannot make a decent profit until you know how to minimize the risk to get the maximum benefit from trade.

Categories
Beginners Forex Education Forex Basic Strategies

When To Let Go Of Your Trading Strategy

You may have spent the last few days, weeks or months developing your very own trading strategy which is great, having your own strategy that is suited and adapted to your own personality and trading habits is great, however, this does not actually mean that it is the right strategy for you to be using, this can be for a number of reasons that we will look at later in this article.

You may well be seeing others boasting about their profits or the amount of pips that they are making each month which could then make you want to switch over to that one and to abandon all the work that you have put into your current strategy. This is of course not the best idea or thing to do, firstly we do not know if those results are actually real and secondly, those strategies are created for those people not for you. So simply wanting to emulate someone else’s success is not a good reason to throw your own strategy to the side, instead you should be sticking to your own.

Before we look at the reasons why you possibly should change your strategy, create your own and what you put into it, because if you missed out one or more of these things then you may just need to alter your own rather than look for an entirely new one. Did you take your time to play it? Including risk management, your risk to reward ratio, and just overall risk of the strategy. Are you using the correct indicators for the strategy, there is no point having 100 indicators if you only use 3 or 4, but make sure that those 3 or 4 indicators are the right ones which give you the right information. How long have you tested the strategy? If it has only been a week or two, then you need to use it for longer, a few months at least to ensure that you are clear as to whether it is working or not. Finally, are you following the rules, and do they suit the current market conditions? Not all strategies work all the time, yours may work when there are different conditions to the ones in the markets right now, so you may not need to abandon it completely.

Since you have done all of that, if things still aren’t working then it may be time to try something new, so we have come up with some reasons why it may be the right time to jump out of your current strategy into a nice new shiny one, this does not mean that the new one will work, it may give the same results, but it is worth trying something that more suits you as a trader.

You struggle to follow your own rules.

When you created your strategy, you would have created some rules that you are meant to be following. The problem is that some people struggle to do this for a number of reasons. Maybe there are just too many of them, maybe they are a little unrealistic, whatever the reason as to why you are not following them, it could be an indication of this strategy not being suitable for you. You breed to be able to be consistent with the rules, this is the only way to work out whether a strategy is successful or not, so if you are struggling to stick to them, no matter what they are, this strategy is probably not the right one for you. Of course, as mentioned before, it is always better to slightly tweak these rules to see if that makes things easier rather than just ditching the entire strategy, although that is of course still an option that is available to you.

Does your strategy require too much effort?

Let’s be honest, you probably don’t have 12 hours a day that you can set aside for trading, if you are working a job at the same time then you probably only have a couple of hours each day to trade. So if your strategy currently takes you hours to find a trade or it requires you to be online at ridiculous hours then do you feel that you will be able to keep it up? If your system is keeping you up or is requiring you to be online at hours and times that are not suitable for you then it may not be the right strategy. You may need to find one that fits in better with your current schedule rather than allowing one to dictate it for you.

Are you spending more than you make?

This is more for those that are buying their strategies or using Expert Advisors. We should point out that some are fantastic and can make you money, while a lot of others will not. However, if you are paying for a signal or an EA, then you need to be able to add the costs of this into your profit and loss numbers. If this results in you spending more on the signal or the Ea than you are making,g then we are sure that you can see the issue here. A good signal or EA will be able to cover its own monthly cost with its results, if it cannot, then there’s clearly something wrong and you should probably consider moving on to a different one.

The market conditions aren’t right.

There may not actually be an issue with your strategy at all, it may just not be the right time to be using that exact strategy. There is no one strategy that works all of the time, they are all suited to certain market conditions. Some like trends while others like a more up and down market If Your strategy works on a trend but the markets are going sideways then of course it will not be effective. This does not however mean that it won’t be effective once the markets begin to trend. So you should still be keeping that strategy at hand once the market conditions change. So try and have multiple strategies that you can switch between based on the current markets and what works best for them.

It’s not profitable.

The big bad obvious one, if your strategy is not profitable, then you should not be using it. We are not talking about not being profitable week to week, we are talking about being profitable over a long period of time. If you have been using it for months and it is still not profitable then it may be time to look for another one to try.

So those are some of the reasons why it may be the right time to try and get a new strategy. It is entirely up to you what you do, or how long you give a strategy before deciding to get a new one, but try and give it enough time to have enough results to see an accurate portrayal of how it will perform. You should also not be shy about simply tweaking things with your current strategy rather than looking for a new one completely.

It can take you time, effort, and possibly a little bit of luck before you find a strategy that works for you, just don’t be afraid to ditch some of the work that you have put in in order to find a more suitable strategy for you. Take your time with it, demo it to ensure that it works and this will hopefully allow you to be more successful over a longer period of time.

Categories
Forex Basic Strategies

You Must Know This ‘7-Day Period’ Forex Trading Strategy!

Introduction

Trying to pick the top or bottom is one of the favorite things a trader likes to do. We tried to do that using the ‘Dolphin Strategy.’ We did that with no indicator support. We are again going to unveil a strategy that does pick a top or bottom with no indicator support. This strategy is called the 7-Day period strategy. Let us take a step back and think, indicators are nothing but a mathematical representation of prices, which are calculated in different ways.

Therefore, sometimes it is important to look at prices alone. The 7-day period strategy is based on the idea that after every seven days of consecutive strength, a currency pair’s move is due for a retracement. The question arises, why seven days? This number is derived after constantly watching the market for years. Often, a new trend emerges at the beginning of the week, and if the trend is strong, it can last for several days with no retracement.

Many psychologists believe that human beings have the best retention rates on numbers that are in groups of seven or less. This is one of the reasons why phone numbers in the U.S. only have seven digits, aside from the area code. We have seen that the seven-day reversal pattern is more accurate in a trending market. We gave occasionally seen those periods when the market continues to move in the same direction after seven days of the exhaustive movement, i.e., from the 8th day onwards. Even though the setup is rare, when it does occur, it is significant.

Time Frame

As the name of the strategy suggests, it can be traded only in the daily time frame.

Indicators

In this strategy, no indicators are used. Simple Moving Average (SMA) can put on the chart to get a clear idea of the trend.

Currency Pairs

This strategy can be applied to all the currencies in the forex market. Exotic pairs should be avoided.

Strategy Concept 

The basic idea of the strategy is that when the market is strongly trending on the hourly chart, the retracement does not last more than seven days and changes its direction at the sixth or seventh day. This retracement is considered to over-extended, which leads to a strong reversal in the pair.

If the sixth or seventh candle coincides with a key technical level, the ‘move’ may very well stall at that level and continue its major trend. To implement the strategy effectively, we need to know trends and trend retracement. Since this strategy is based on fixed rules and price action, it is not necessary to know about technical indicators. However, SMA and ATR can be used for trend identification and measuring the momentum of the market.

Trade Setup

In order to understand how the strategy works, we will apply it on the USD/CAD currency pair and execute a ‘short’ trade using the strategy.

Step 1

The first step is to identify the direction of the market. As this is a trend trading strategy, we should be able to identify the major direction of the market. If the market is making higher highs and higher lows, it is an uptrend, or if the market is making lower lows and lower highs, it is a downtrend. A trend can also be determined using the Simple Moving Average (SMA) indicator. Very simply, if the price is below SMA, we say that the market is in a downtrend, and if the price is above the SMA, the market is said to be in an uptrend.

In the example we have considered, from the below image, it is clear that the market is in a strong downtrend.

Step 2

Next, wait for a retracement from the highest or the lowest point, which we will be evaluated based on our strategy rules. The retracement should be such that there are seven consecutive candles of the same color. One or two candles of the opposite color are okay, but we need to make sure that it does not impact the structure of the retracement. These seven candles represent an extended pullback, which can lead to reversal any moment.

In the below image, we can see seven days of the up movement, which is exactly the kind of retracement which we need for the strategy.

Step 3

In this step, we need to check the position of the price after seven straight days of the movement. The strategy works best if the price coincides with a key technical level of support and resistance. This is because, in these areas, the price action is very strong, and market moves as per expectations. But it is important to make sure that no step of the strategy is used individually. All of them need to be used collectively.

We enter the market once we get confirmation after the 7-day period. The confirmation is nothing but a bullish candle in case of a ‘long’ setup and a bearish candle in case of a ‘short’ setup.

In our example, we see that the price has approached the previous ‘lower high’ of the downtrend. This is an area where we can expect sellers to get active and take the price lower.

Step 4

Finally, we need to determine the ‘stop-loss’ and ‘take-profit‘ for the strategy. We place the stop-loss a little higher than the bullish candle when entering for a ‘long’ and little lower the bearish candle if entering for a ‘short.’ We take profit at two places in this strategy. The first take-profit is set at the previous higher high or lower low, while the second take-profit is set at 1:2 risk to reward.

Strategy Roundup

As there are many conditions associated with the strategy, the setup might be rare, but when it does occur, it is significant. We have seen trends where the retracement occurs for just a few days before it starts moving in the direction of the major trend. But these setups are not reliable. The most important condition of this setup is the continuous appearance of bullish or bearish candles for seven days.

Categories
Forex Basic Strategies

Learning To Trade The Forex Market Using ‘Pure Die-Out’ Strategy

Introduction

Everyone wants to be the hero in the market and claim that they have picked the top or bottom of a currency pair. However, apart from boasting, there is no gain from repetitive selling at every new ‘high’ in hopes that this one would be the final ‘high.’ One of the biggest dangers encountered by novice traders is picking a top or bottom with no logic. The pure die-out is an intraday strategy that picks a top or bottom based upon a strong recovery after an extended move.

Time Frame

As it is an intraday strategy, the highly suitable time frames are 1 hour and 15 minutes.

Indicators

In this strategy, we will be using two indicators. The two indicators are RSI and Bollinger Bands.

Currency Pairs

This strategy works best on major currency pairs only. Among these, the preferred ones are EUR/USD, USD/JPY, GBP/USD, GBP/JPY, and USD/CAD.

Strategy Concept

The strategy looks for intraday fake-outs using three sets of Bollinger bands and the relative strength index (RSI) on the hourly and 15-minute charts. The trade setup is formed when RSI hits either an overbought or oversold level. The market is considered to be overbought when RSI moves above 70, while the market is considered oversold when RSI goes below 30.

This signals a possible reversal in the market and that we can start looking for a trade in the opposite direction. However, rather than just immediately buying or selling in hopes for a trend reversal based solely upon RSI, we add in three sets of Bollinger Bands, to help us identify the point of over-extension. We use three sets of Bollinger Bands because it helps us assess the extremity of the move along with the extent of possible U-turn.

The conventional theory of Bollinger bands suggests buying or selling when prices hit the two bands. In our strategy, we will totally be using three Bollinger bands, and when prices hit the third band on any side, we say that the move is within the 5% small group, which characterizes the move as extreme.

When prices move away from the third standard deviation Bollinger band and move into the zone of first and second Bollinger band, we are confident that the currency pair has hit its extreme point and is moving into a reversal phase.

Finally, we look for one last thing before making an entry: a candle to close fully between the second and first Bollinger Bands. This last step helps us screen out false moves and assures that the previous move was really exhaustion. This is a low-risk and low-return strategy that is suitable for traders who like to scalp the market.

Trade Setup  

To illustrate the strategy, we have considered the USD/JPY currency pair, where we will be applying the 1-hour chart strategy. Here are the steps to execute the strategy.

Step 1

Firstly, open the 1 hour or 15 minutes chart of the desired currency pair. Then plot the Bollinger band and RSI indicator on the chart. We need to plot 3 Bollinger bands with the same ‘period’ but different standard deviations. The first Bollinger band (BB) should have a standard deviation (SD) of 1, the second BB will have SD of 2, and finally, the third BB will have SD of 3. RSI will carry the default settings.

The below image shows the Bollinger band indicator plotted on the USD/JPY currency pair and the RSI on it.

Step 2

If we are looking for an overextended move on the downside, wait for the price to cross below the lower band of the 3SD BB or if we are looking for an overextended move on the upside, wait for the price cross above the upper band of the 3SD BB. Along with this, we need to see that the RSI goes below the 30 ‘mark’ in a down move and moves above the 70 mark in an up move. Both conditions need to be satisfied simultaneously.

In the example since we are looking for a ‘buy’ trade, we have to wait for the price to cross below the lower band of the 3SD BB along with the RSI reading of below 30. The below image shows that the conditions mentioned above are fulfilled.

Step 3

In this step, we wait for a candle to open and close between the 2SD BB and 1SD BB zone. It is important to check that the entire body of the candle is within this zone, and it closes near the lower band of the 1SD BB. This was for a ‘long’ setup. In the case of a ‘short’ trade, the only difference is that the candle should close between the upper band of the 2SD BB and 1SD BB.

In the below image, we can notice a bullish candle that closes well within the required zone, which is a sign of reversal.

Step 4

In this step, we determine the ‘stop-loss’ and ‘take-profit‘ for the strategy. Stop-loss is placed below or above the ‘low’ or ‘high,’ respectively, from where the reversal began. As we are trading against the trend, the ‘take-profit’ is set at 1:1 risk to reward. We will also lock-in some profits when the market starts moving in our favour, to ensure that we don’t lose money if it turns midway.

Strategy Roundup

In this strategy, we combine two technical indicators to identify the market’s top and bottom, without making wild guesses. This means we are determining overextended moves logically and technically. After practising well on the 1-hour chart, we can spot trade setups on the 15 minutes time frame. Since these are counter-trend trades, the probability of success will be less. This strategy is very simple to understand if we have basic knowledge of indicators.

Categories
Beginners Forex Education Forex Basic Strategies

Forex Trading Strategies To Avoid: Martingale

There are a lot of strategies out there, some are fantastic and some not so much, there are also some that you should be avoiding like it was the plague, these are strategies that are either extremely unrealistic or will increase the risk within your account to an unacceptable level. Some also have literally no risk management and just rely on luck or hope that the markets will change.

One of those such strategies is the Martingale strategy, this strategy was first seen in the 18th century and was most popular in France. This strategy was used a lot in the casinos, there were those that made a lot of money from it, but far more lost everything. The casinos also came up with their own defenses and changed the way some tables world primarily to simply prevent people from using this strategy.

So if the casinos are changing things to prevent it, it must be quite effective right? Well, it can be, it can actually guarantee you wins, the problem is that you will need an unlimited amount of money in order to guarantee a win.

What is the Martingale strategy?

The idea behind the Martingale strategy is very easy to understand, you place a bet at $1 on a 50/50 outcome, if it wins, then you get back $2, If the first bet losses then you will double up your bet, so the next bet would be $2, if that wins, you get $4 back which is $1 profit ($1+$2 bet $4 win). If it loses again, then you double it again and place a $4 bet, you are starting to see the pattern now.

Those that advocate the strategy will tell you that if you have enough money, you will always have a winning bet, this is technically true, the laws of probabilities indicates that you will eventually have a win, the problem is, that you would potentially need millions in order to win that $1 if too many trades go the wrong way. The amount that you need to pay can very quickly get out of control.

So looking at that table, you can see that the amount that you are betting and the potential losses can very quickly go through the roof and they will continue to escalate at a much faster pace the more you go. Many people will be expecting to make a win before getting to that stage, but are you really willing to potentially risk $1000 just to get a $1 profit, it really isn’t worth it, this strategy is only achievable if you have an unlimited amount of money.

Many people have tried to use this strategy, unfortunately, the majority of them have lost all of their money. When you look at it from the outside, you would assume that you would win at least one of your trades out of 10, but the markets do not work through those sorts of probabilities, the majority of people using this style do not necessarily use a well thought out strategy, instead, they trade and hope, hope that one of their 10 trades wins, but unfortunately, a lot of people often realise that it is not quite as easy as that, and so ultimately lose.

There is also an anti martingale strategy, this works in much the same way, except that you would not be increasing the bet size after each win instead of a loss. People believe that they should take advantage of their winning streaks, each win will multiply the current profits, you then reset down to the minimum trade until the next win when you then double up again. This method will help to reduce the potential losses, however a run of losses will still then require you to win a number of different bets or trades in order to make up the differences, so it is still considered as quite a risky strategy, but nowhere near as risky as the original Martingale strategy.

So that is the MArtingale strategy, something that has probably been taught to you, and something that you will find a lot of expert advisors using, it is certainly something that you should avoid due to its nature and the risks involved.

Categories
Forex Basic Strategies

Heard Of The ‘Good Morning Asia’ Forex Trading Strategy?

Introduction

In the previous article, we discussed a strategy that was in the European session. However, there are a fair number of traders who prefer the U.S. session as they feel the market tends to be more exciting and thrilling. These traders consider the Asian session to be boring and quiet most of the time.

Many part-time retail traders based in the United States and Europe miss out on opportunities in European and U.S. sessions because of work and other business commitments. The only time they are left with happens to fall in the apparent boring and quiet Asian session. Therefore, it becomes necessary to come out with a strategy that is exclusively meant for the Asia session.

The strategy we will be going to discuss today is suitable for trading during the early-morning Asian hours. This time period has numerous opportunities for traders in different time zones across the world, whether they are part-time or full-time traders. We hope that the strategy will greet everyone like the bright morning sun.

Time Frame

The good-morning Asia strategy works well on the 4-hour time frame. This means each candle represents one day of price movement.

Indicators

This strategy is based on pure price action, and hence no indicators will be used during the process.

Currency Pairs

This strategy applies only to the AUD/JPY currency pair.

Strategy Concept

Opening hours of the Asian market begin a couple of hours after the U.S. market closes. The Asian market direction tends to take its cue from the previous day’s movement during the U.S. session because the U.S. market is the largest economy of the world, and most of the institutional banks are located in the U.S.

It is observed that when the U.S. market closes with the bullish sentiment, the Asian market usually starts the day bullish. If the U.S. market closes with the bearish sentiment, the Asian market remains bearish throughout the day.

During the early morning Asian hours, the best currency pair to take advantage of this phenomenon is none other than the AUD/JPY, as the Japanese Yen and the Australian dollar are the most active currency during the Asian session.

Looking at the price action, we take an entry right after the U.S. market closes at 05:00 PM. The first requirement of the strategy is that we need a ‘range’ or a ‘channel’ before the U.S. market closes. Depending on the position of the price and where the candle closes before the U.S., we take an entry. There are many rules that we need to follow before we can use the strategy profitably.

Stop-loss is placed above or below the technical levels, which is the easiest part of the strategy. The risk-to-reward ratio for this strategy is anywhere between 1.5 to 2, which is quite good.

Trade Setup

For this strategy, the closing of the 4-hour candle corresponding to 5:00 PM New York time is crucial for the strategy. Here are the steps to execute the strategy.

Step 1

Firstly, we need to identify a ‘range’ or ‘channel’ on the chart of AUD/JPY. This becomes our trading region, where we will be carrying out all the trades. A ‘range’ or ‘channel’ is confirmed only if the price has reacted and reached the other end at least twice after touching the extremes.

We have considered an example of a trade where we will be applying the rules the strategy step by step. The below image shows the 4-hour time frame chart of the AUD/JPY pair, where we identified a ‘channel’ with multiple touches on either side.

Step 2

In this step, we need to pay close attention to the position of the price and the closing of the U.S. market. The most important part of the strategy is looking out for the price action taking place at the end of the range, which should be occurring at the close of the U.S. market. Depending on the signal we get from the market, we will take an appropriate currency pair position.

At the close (U.S.) if the price closes as a bullish candle from the support, we will enter for a ‘buy’ at the opening of the subsequent candle. If the price closes as a bearish candle from the resistance, we will enter for a ‘sell’ at the opening of the subsequent candle.

Step 3

In this step, we take an ‘entry’ with a suitable size and determine the stop-loss and take-profit for the trade. As mentioned earlier, we will enter for a ‘buy’ or ‘sell’ right after the U.S. market closes, and the next candle opens. This ensures that the risk to reward will be higher.

The stop-loss for the trade is placed a few pips below or above the key technical level of support or resistance. To increase the risk to reward ratio, we can also place it just above or below the previous candle. This would require some experience of using the strategy over a long time. The ‘take-profit’ is set at the other end of support or resistance. We can have a larger ‘take-profit’ if we are trading with the trend of the market. The ‘take-profit 1’ ensures that we lock in some profits if the trade goes against us.

Strategy Roundup

This strategy is suitable for traders with little time to trade. Furthermore, it does not require complex market analysis. It does have some strict rules which might reduce the creation of the trade setups. The ‘entry’ time of the trade is fixed at every morning. Since Japan and Australia are the first countries in Asia where markets open, there will be ample liquidity in the market that will allow traders to execute ‘long’ and ‘short’ positions very easily. All the best!

Categories
Forex Basic Strategies

Trading ‘Cable’ Using The ‘English Breakfast Tea Strategy’

Introduction

When traders deal with a particular currency pair for a long time, they start to observe certain characteristics and behavior of that currency pair. Such common behavior could be observed during market opening hours, closing hours, or major news releases. Traders may notice common behavior before and after the holiday season, such as Christmas or New Year.

Day traders enjoy the volatility of the market opening. This could be either Tokyo open, London open, or New York open. Some traders are familiar are with the pattern developed during the Tokyo open while some are comfortable trading the New York open. While some traders like to trade when the market is not extremely volatile, they prefer to trade when the market is quiet and less volatile.

The strategy we will be discussing today is based on the peculiar behavior observed in the GBP/USD currency pair. This behavior is mostly observed during the London opening hours.

Time Frame

The English breakfast tea method works well on the 15-minutes time frame. This means each candle represents 15 minutes of price movement.

Indicators

This strategy is based on pure price action; hence we will not be using any indicators.

Currency Pairs

This strategy applies only to the GBP/USD currency pair.

Strategy Concept

The pattern is observed in GBP/USD before, and after the London market opens in the morning, we have named this strategy an ‘English breakfast tea strategy.’

We have observed that when GBP/USD trends in one direction from 04:15 hours to 8:30 hours London time, it tends to move in the other direction after 8:30 hours. We now compare the closing price of the 15-minute candle that corresponds to 04:15 AM and 08:15 AM London time to determine the direction of the GBP/USD. We then enter the market in the opposite direction at 08:30 AM London time.

For example, if the closing price of the 15-minutes candle at 08:15 hours is lower than the closing price at 04:15 hours, we go long at 08:30 hours. If the closing price of the 15-minutes candle at 08:15 hours is higher than the closing price at 04:15 hours, we go ‘short’ at 08:30 hours.

The stop-loss for the strategy is fixed at 20-30 pips depending on the point of entry on the chart and risk appetite. There are two profit targets for the strategy with risk to reward ratios of 1:1 and 1:2. In other words, the ‘take-profit‘ would be at around 30 pips and 60 pips, respectively.

Trade Setup

Since this strategy is based on the London time zone, we need to make sure that we change the trading platform’s time zone to ‘London.’ If this is not possible, we should know London’s corresponding time opening with respect to our time zone. Let us see the steps required to execute the strategy.

Step 1

In the first step, we mark 04:15 hours and 8:15 hours London time on the chart. Then we look at the difference between the two candles. If the closing price of 8:15 hours is lower than the closing price of 04:15 hours, we then look for buying GBP/USD. On the other hand, if the closing price of 8:15 hours’ candle is higher than the closing price of 04:15 hours’ candle, we will for ‘short’ trades in the currency pair.

In the following example, we see that the market moves lower between 04:15 hours and 8:15 hours London time. The closing price of the latter is below the former. Therefore, we will take a ‘long’ position by executing further steps.

Step 2

In this step, we examine the ‘entry’ part of the strategy. ‘Entry’ is the simplest part of the strategy where we enter the market at the close of the 08:30 hours’ candle. If the difference between the two candles marked in the previous step is negative, we enter for a ‘buy’ at the subsequent candle. If the difference between the two candles is positive, we enter for a ‘sell’ at the subsequent candle.

We can see in the below image that the subsequent candle dropped significantly lower. As per our strategy, we will take a ‘long’ trade at the close of this candle. Let us see what happens later.

Step 3

In this step, we determine the stop-loss and profit targets for the strategy. The stop loss is usually set at 20-30 pips depending on the risk appetite of the trader. However, a technical approach for setting the stop loss is that, if the trade is taking place in the direction of the major trend of the market, we keep a small stop loss. If the trade is taking place against the major trend of the market, we opt for a larger stop loss. The first profit target is at 1:1 risk to reward, and the second one is set at 1:2 risk to reward. If we are trading against the trend, the first ‘take-profit’ ensures that we don’t lose any money even if the market turns around mid-way.

In the below image, we can see that the price hits our final ‘take-profit’ after taking an entry at the close of the red candle. Since the market was in an uptrend, we kept a small stop loss.

Strategy Roundup

This strategy is based on a fixed time period, i.e., during the market opening hours. The rules are simple and specific. Any trader can try out this strategy to benefit from the volatility associated with the market opening. However, the currency pairs will change for other market openings. Since we are not giving much importance to the market trend, we might have some losing trades in the beginning until we become expert in the strategy.

Categories
Forex Basic Strategies

‘Balk the Talk’ Strategy – Combining Fundamentals With Technical Analysis!

Introduction

Fear is the greatest driving force in humans. We tend to react drastically in times of fear or when they are presented with sudden moves from the market. Fear is an emotion that drives traders around the world to watch out for every news announcement, for fear of missing out on important information. Fear results in fast decisions by traders, which are most of the time taken without thinking.

In the previous article, we mentioned that trading the news is one of the best ways to make a profit in a short period of time. We also mentioned focusing on news events with the highest impact (red flags) on the currency. In today’s strategy, we will be trading the Forex market by looking at news events that have the least impact on the currency and do not have a long-lasting effect on the pair.

Timeframe

Balk the talk strategy works well with the 15-minutes timeframe only. Since we are dealing with small price movements, we will capture those little gains by analyzing the 5 minutes time frame chart.

Indicators

In this strategy, we will not be using any technical indicators.

Currency Pairs

The strategy is suitable for trading in all major currency pairs listed on the broker’s platform. Make sure not to use the strategy on Minor and Exotic currency pairs. Currency pairs such as EUR/USD, USD/JPY, GBP/USD, USD/CHF, USD/CAD, AUD/USD, GBP/JPY, and NZD/USD are highly preferred.

Strategy Concept

Although we are trading based on the news data, this strategy’s concept is very different from the previous strategy. Here we will be taking advantage of the sudden surge in volatility due to the news announcement. The volatility leads to price movement, which is not reliable and mostly false. Hence, we will analyze the charts from a technical point of view and position in the currency pair based on the indications provided by technical analysis.

News events that have orange and yellow flags associated with them are the ones that are not of great importance to traders. Even then, during the news announcement, the volatility gives rise to price movement, mostly not dependable. This means any move in the market created by such news releases does not last for long, and the market continues to move in regular from a few minutes after the news release. We will take advantage of this false movement by combining the market’s current price with that of the key technical levels.

Trade Setup

In order to illustrate the strategy, we will be taking the example of the Final Services PMI news announcement, which was released recently. We will analyze the impact of data PMI on the currency and see how we can take a suitable position in the currency based on the volatility induced in the pair due to the announcement.

Step 1

The first step of the strategy is to look for news events that have an orange or yellow flag linked to them. Note down the date and time of the announcement and open the respective chart. We recommend looking for news announcements of major economies only and trade in currency pairs involving the U.S. dollar.

In our example, we will be considering the impact of Services PMI on the EUR/USD currency pair.

Step 2

In this step, we will mark out the key technical levels on the chart. They could be support, resistance, demand, supply, and some indicator signals. Based on the sign of each technical level, we will take the position accordingly.

We can see in the image below that we have identified two important levels of support and resistance and marked them on the chart.

Step 3

The crux of the strategy is that we wait for the price to reach our key technical levels as a result of the volatility due to the news announcement. Once the price reaches those levels, we will place trades based on our technical analysis and understanding of market psychology. For example, in the below image, we see that due to the Services PMI news release price reaches exactly to our resistance, which we had marked in the previous step. Since the PMI data was slightly better than expectations, it led to bullishness in the currency, thereby taking the price marginally higher.

Since the Services PMI is a low impact event, we cannot afford the market to continuously move higher. This means it will respect key technical levels and follow the major trend of the market. In this case, the trend is down. Therefore, we trigger a ‘short’ trade precisely at the resistance, taking a bearable risk.

Step 4

The next step is to determine stop-loss and take-profit levels for the strategy. Since we are taking an aggressive entry, the stop loss for the trade will be small, resulting in a high risk to reward ratio. The take-profit is pretty much straightforward, where it will be set at the latest obstacle.

In this case, the take-profit is placed at the support of the range, which is ideal for booking profits.

Strategy Roundup

The strategy takes advantage of the market reaction when the actual figures of some news events are not of great importance to traders. Such news announcements only create panic in the market with no confidence. Keep in mind that this requires many things to be assessed before being able to successfully use this strategy over and over again. This means a lot of practice is required to apply in the strategy effectively. Pay attention to news releases which do not hold much ground. All the best!

Categories
Forex Basic Strategies

Buy and Hold FX Trading Strategies

In this article, we will discuss and explore options you have once you are already trading on Forex. It is also for beginner traders so they can understand all the benefits of becoming a consistent, successful trader. At one point, as an established professional Forex trader, you would need to consider options with the capital you can extract from Forex. The skills traders gain in their career are universal. They do not apply only to Forex. It is not only the mindset, but it is also the system(s) they have built. This way they can use the money from one business and use to invest in another. The money will be multiplied many times over throughout their life. Of course, some people may not be interested in this, and they are probably not reading this as motivated future traders. However, this group will most likely have only one way of winning, while Forex traders have many ways to win.

Buy and Hold strategies are not very well presented and the people that talk about them do not give you anything substantial traders can use. There are a couple of them and in this article, we will discuss some applicable to Forex traders. Also, why to Buy and Hold Strategies are important, the number of people who have one is so small compared to the ones who do not. Forex traders have a huge advantage to those who are investing long term. This advantage will be discussed later. Note this is just an opinion and observation by certain professional prop traders.

People come to Forex for the most attractive reason, to gain a lot of money in the short term. This is possible although very unlikely. Forex is therefore interesting to those who do not have much to invest. However, the sooner you have, the better. It is imperative to start using the Buy and Hold strategy at the beginning of your life or as soon as you can. Regret you did not will come after many years. The long game or long term investing is not popular. The rewards are late. Sometimes too far for us to consider it as a solution to our present problems. We give present problems priority even if we have a solution for our future problems in the present. Part of this mindset is the same reason why many fail to trade on Forex. It is finding a quick fix for their financial and career problems, they want to quit their captivating job and break free.

This might be a good idea if your life expectancy is short, although for most it Is not. Having an early start will be very soothing for the future you, the longer you delay, the Buy and Hold strategy will have a diminishing effect. Once the strategy is started, it keeps snowballing and you will start to make good decisions that are lifechanging. Feeling secure in your future will relieve you of stress and you will feel the security few people do. So, from another view, you already have something right away, peace of mind. Another reason Buy and Hold investment may be unappealing in the fact many people are tied to the money they made by working hard, the idea they need to start investing stirs fear, they are hanging to the money they have. This is not a wise decision.

The book “The Richest Man In Babylon” by George S. Clason is a classic but the most interesting part is when a poor man comes to the rich and asks him how to become rich. The answer is first you need to earn 10 coins a month, then, put one away. Make this a rule you will not break. The poor guy protested, stating he will not have anything left at the end of the month, he needs every penny. This is not an option, however, to become rich you will need to make this step. After a while, the poor man came back and said there is no difference except now he has some savings, and that he never felt better.

Even if you are a good, profitable trader, earning money in one way is the same as saying you are putting all eggs in one basket. Not wise, you should play the offense and defense at the same time. The defense analogy part is known as Passive Income. The best teams play both sides, why not you. While you are making nice gains off Forex, do not spend the whole batch, set one part aside, and create your evergrowing capital. This move will take trading anxiety away because even when your trading comes to a halt, you will have the Passive side still working behind the scene. Imagine that terrible month where all of your previous year gains are negated, it feels like a year is wasted. But if you have that other Passive side, it will not feel that bad.

The Mystery of Buy and Hold Strategies

Buy and Hold strategies are not explained and not present on the internet, because the internet places the most popular first, not the most beneficial to you. So how we can use our forex trading skills to become better than most of the population who is doing this? Some common sense takeaways are often overlooked with this strategy and we, as forex traders will know what to do better. There is a lot of ways you cad do a Buy and Hold strategy. They are not all great but let us start with the Buy and Hold Forever idea. This one is not too bad to follow, there are a good argument and logic behind this strategy. When you look at the stocks or Indexes history, they just rise up and up, even when they crash a bit they end up recovering and rising again. The history will repeat, cycles will do their thing until the repetition does not hold and something new occurs.

That equities rally may just stop rising, you simply do not know. All you have are the odds. The odds imply that it does not matter when you enter the market with the Buy and Hold forever strategy as long you keep that forever mentality. This means if you invest in Gold and it starts to decline in price, you do not blink, do not bailout. On the contrary, this is an opportunity to buy more, you are playing the long haul. The plan is set here to hold the asset for a very very long time as the price moves up and up. Withdrawal is not set in the plan and it is not uncommon people never withdraw. They might come to the point of old age where all that money is not very useful to them and pass it on to their kids. There are many iterations of this approach and there is nothing wrong with it.

The Buy and Hold until you cash out big is the one with many weak spots, and here is why. The plan is to collect all the investments and put everything into the pocket. This form of Buy and Hold is very common, especially with the people who are into investments. They may have an idea to wait until the price is very high (high relative to what?) and cash it out, then use the money for something else or just count the bills. This plan is not a good one. Until you have a precise number when this investment ends, it is not a good plan. Now, for example, if we take an excited blackjack player who comes with just $100 and lifts his game to $40.000, he will just keep playing. He will play $40,000 for more until he is back to $100 all in one day. These people did not have a plan.

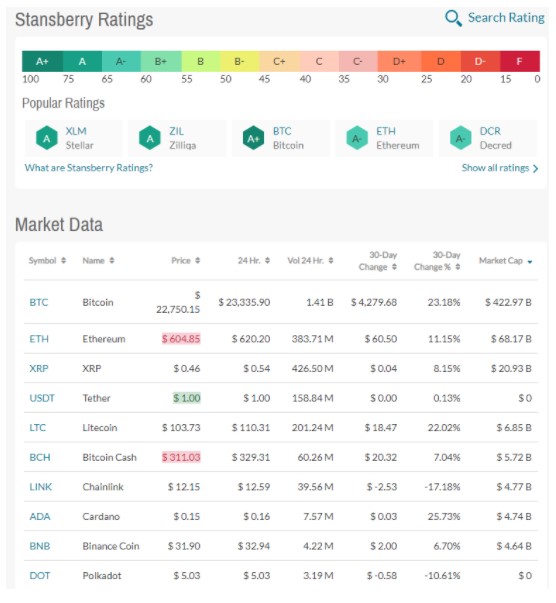
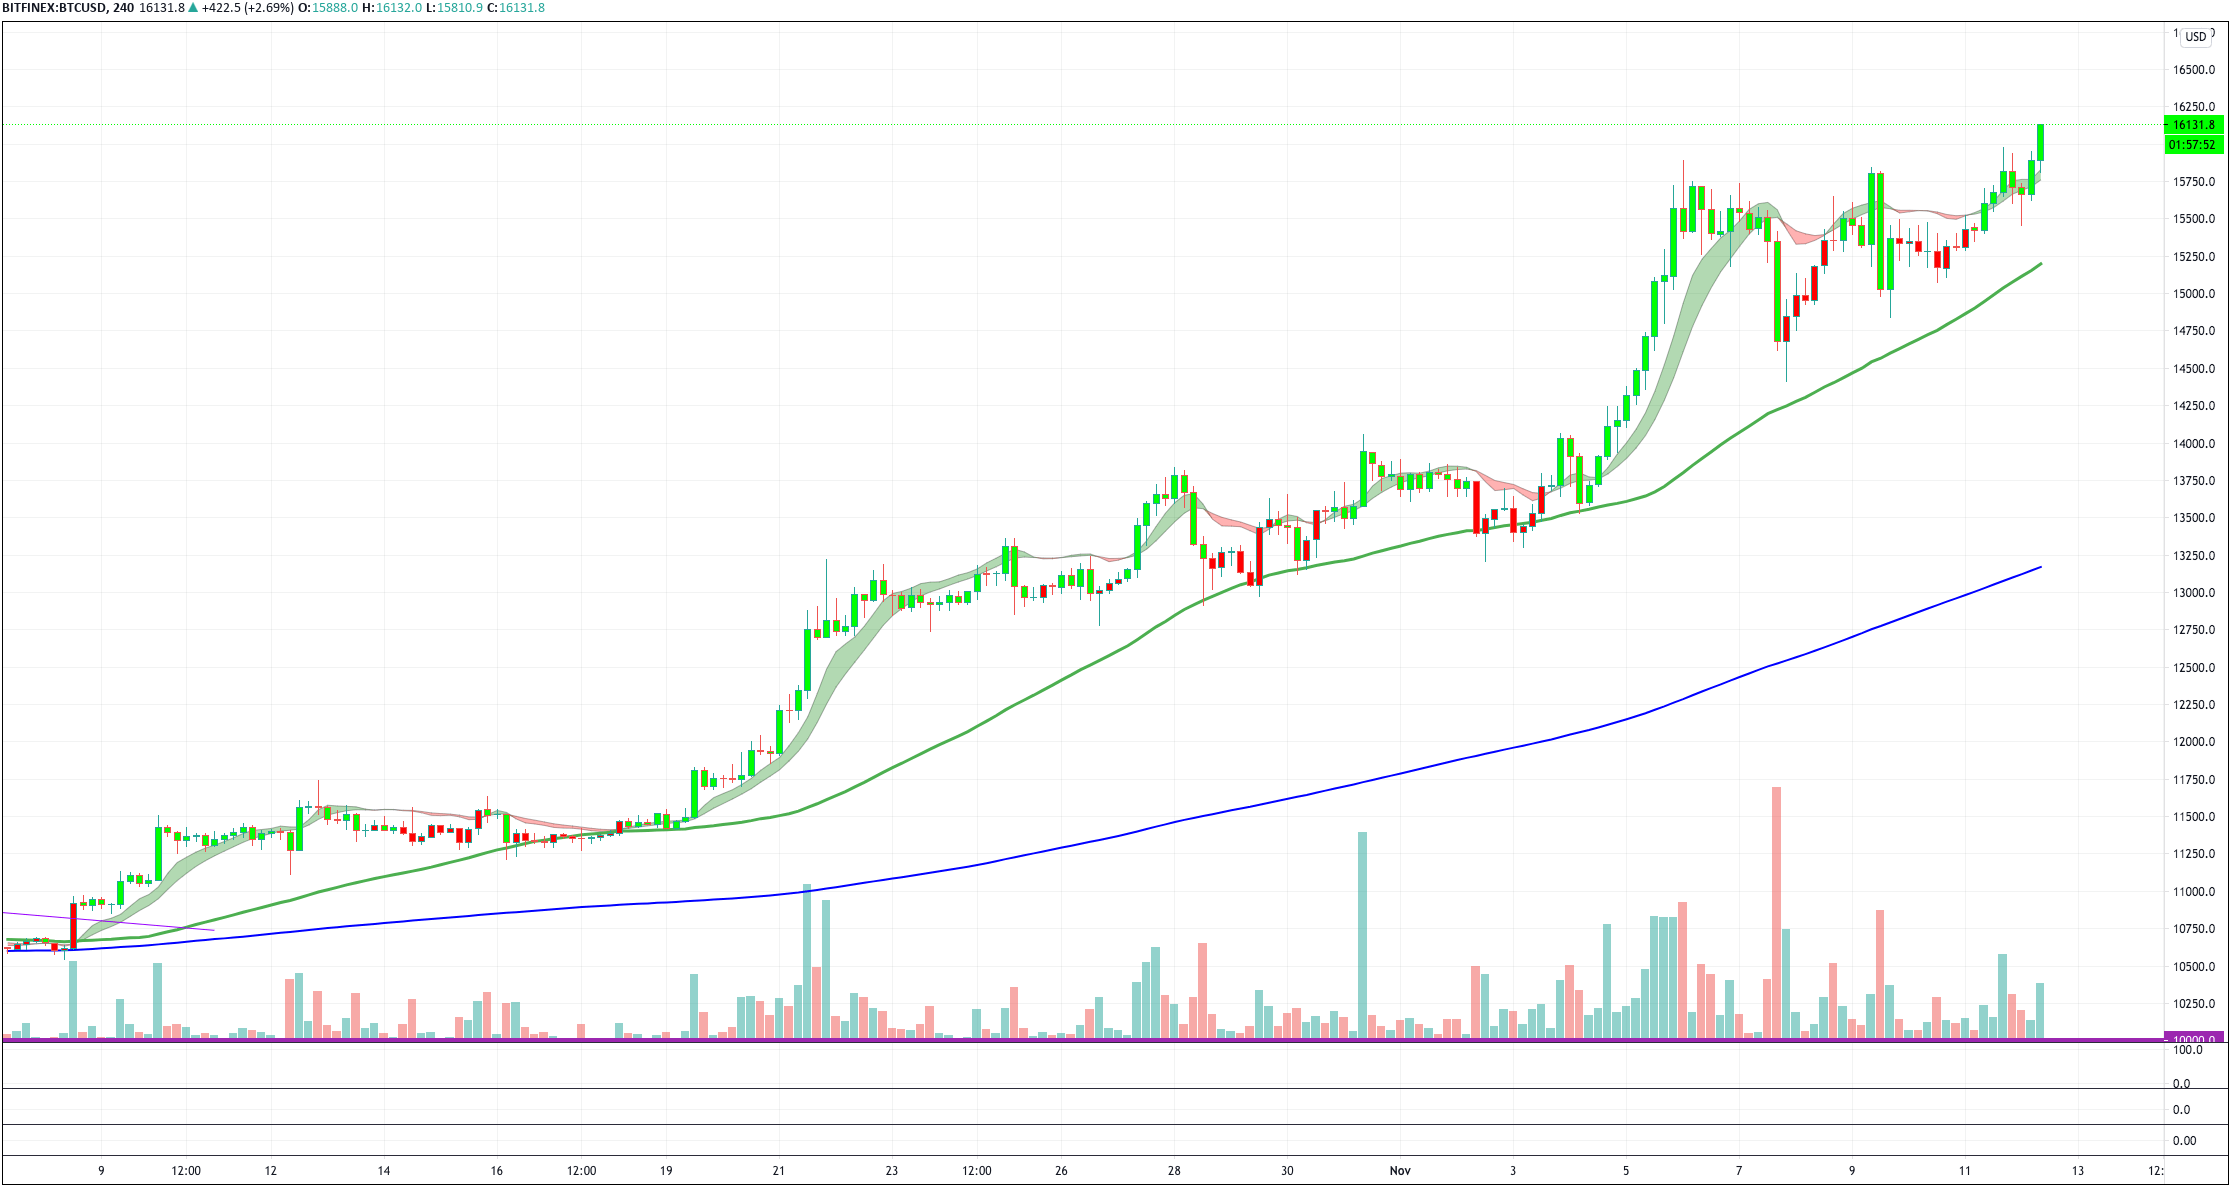
The same people who bought Bitcoin when it was just $1000, hyping when it reached almost $20,000. Then the talk about the BTC made millionaires circles, but the truth is only about 40 out of hundreds of thousands of people got out at the right time. The majority let the hype run and when it is over some may even go with the Buy and Hold Forever strategy. Od course, they would for sure sell near the $20,000 mark and buy it back when it went down if this option is available. After all, just be sure to avoid this strategy.

Forex would like the approach with a structure, even in the Buy and Hold strategy. This is a type where investors Buy and Hold and cash out along the way. Where are the points in time and level where you cash out, is subjective. It depends on the investor’s tolerance, how long to hold, and what is the asset held. Forex traders will have a plan and structure for this. Again, having a passive income element is very important as your trading will not be as great as before.

Long-Term Swing Trading

Long-term Swing trading types may not really be in the category of the Buy and Hold idea, but it is also very interesting for forex traders who have a plan and a system. More on this strategy later. Just to point out what makes forex traders better right off the bat is their Money Management structure. Without Money Management, there is no money. If you are strictly following the Buy and Hold Forever strategy then you probably do not need to worry about Money Management.

However, people who follow this strategy fail with their psychology trading element. When you think of it, all they have to do is invest and do nothing. The do-nothing part is a very hard thing to do it seems. Warren Buffet can do it but most cannot. When the markets stir up with volatility, their fears kick in as their asset is going down. Then they get out at the wrong time. Trading by fee is the worst possible way to trade, and it is often what beginner traders do, not just forex traders. So it can be said that all decision making is just better when the emotions are not in the way. Forex traders beat this with their systems. Unfortunately, others do not have the system. The rules for forex trading is easy. Trade according to your system, then go away, and repeat.

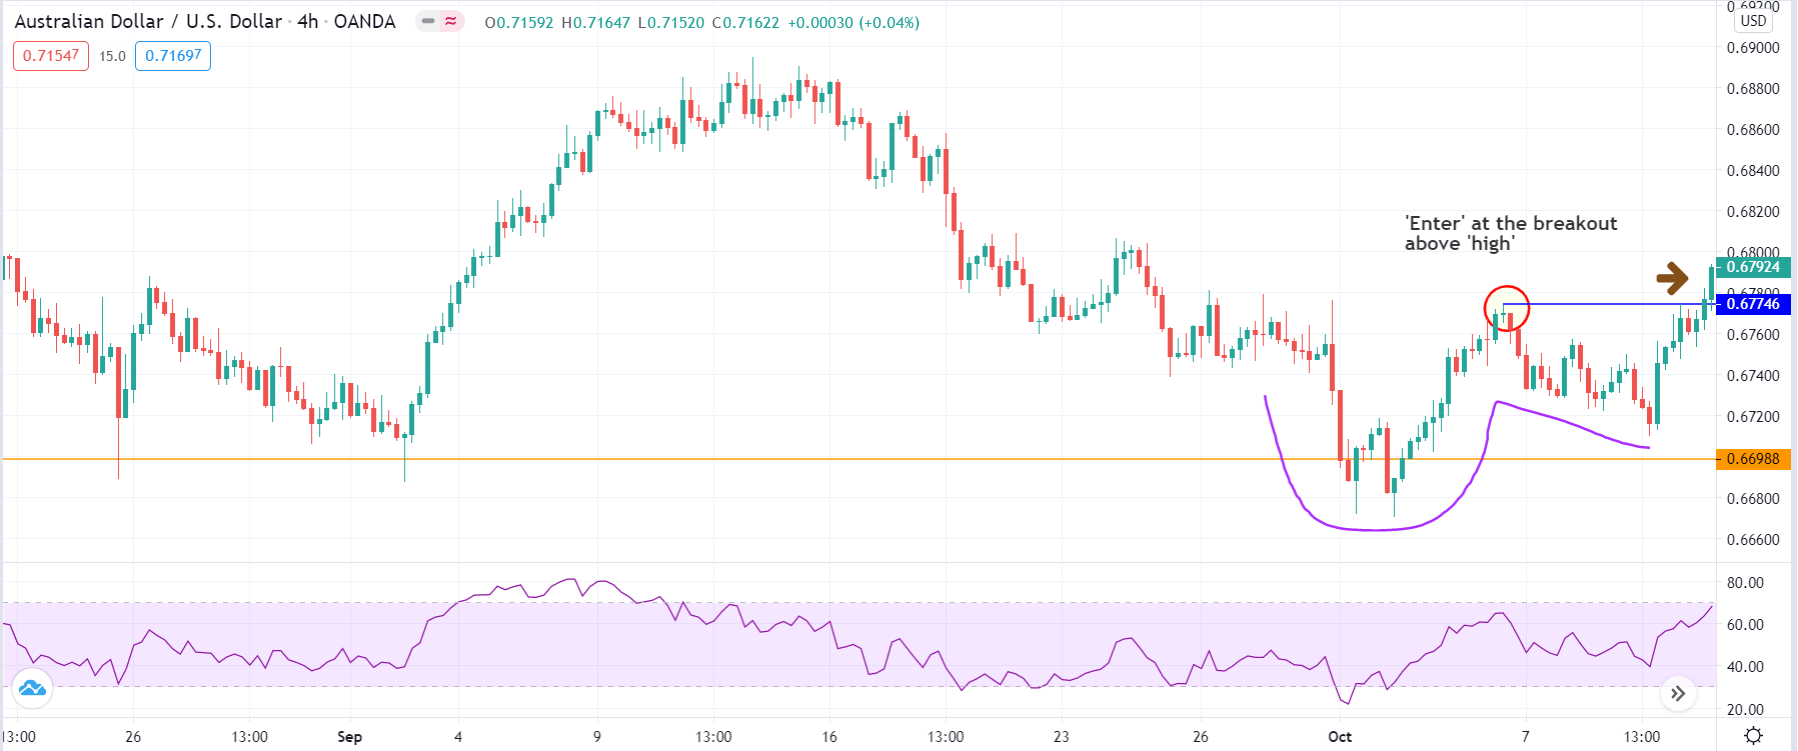
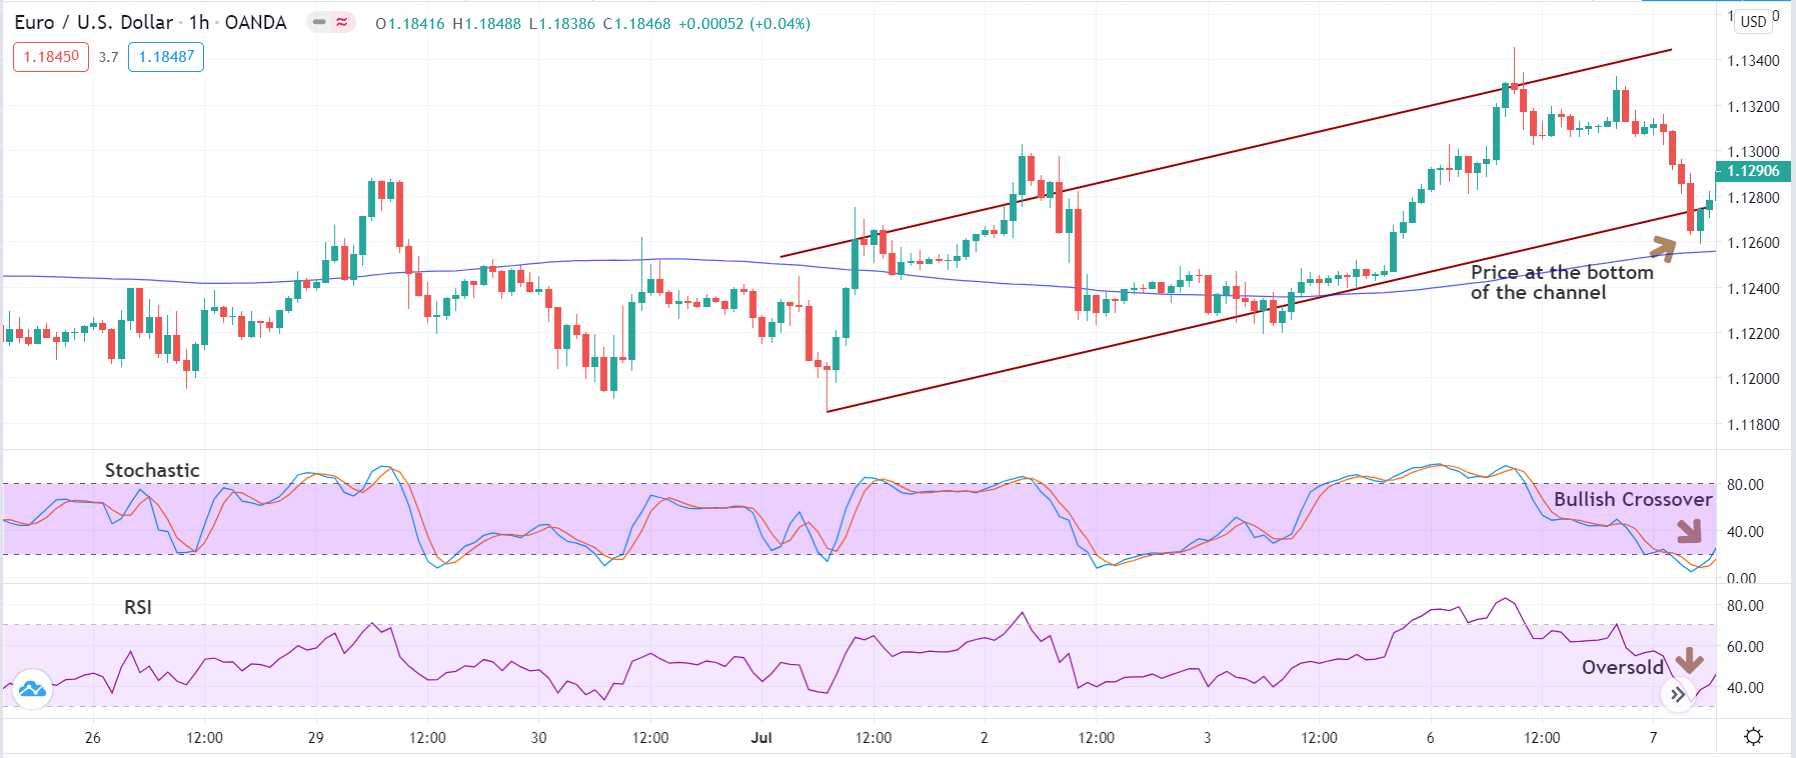
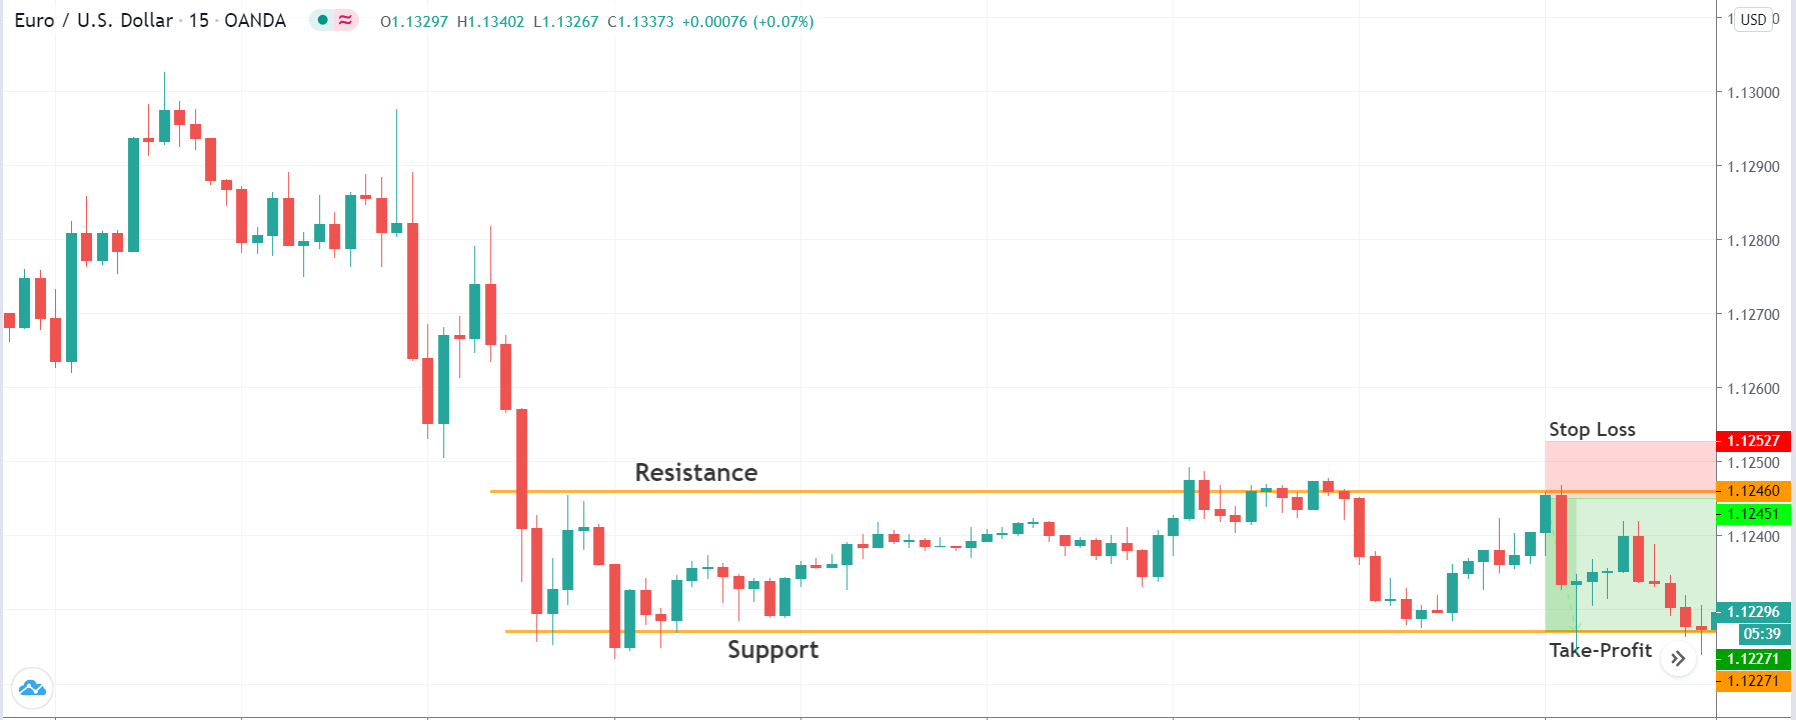
Taking the above into consideration, we can create some common-sense rules you can follow. Just by using these general pointers and then create your strategies over time, you will probably do very well with the Buy and Hold investing. Have a plan. Most do not have one, which gives you an advantage right away. Execute the plan. Write it down and follow it like it is holy. Writing it down will also write it in your mind. This will make a psychological effect that helps to obey the plan. A forex trader can also use their trading platforms to set Take Profit levels, etc.

You may be caught in a mania, an emotional excitement when your asset shoots up. There will be an urge to move that TP level higher or cancel it altogether just to see where is the limit of this fortune. If your plan set the TP, then messing around with it is not an option, no exceptions. There are no regrets, as another opportunity always shows up. Regret is another emotion that may cause bad decisions so enjoy your cool just by following the plan no matter what. At the begging, you will have these urges, but in time it will vanish.

Buy and Hold Cash Out

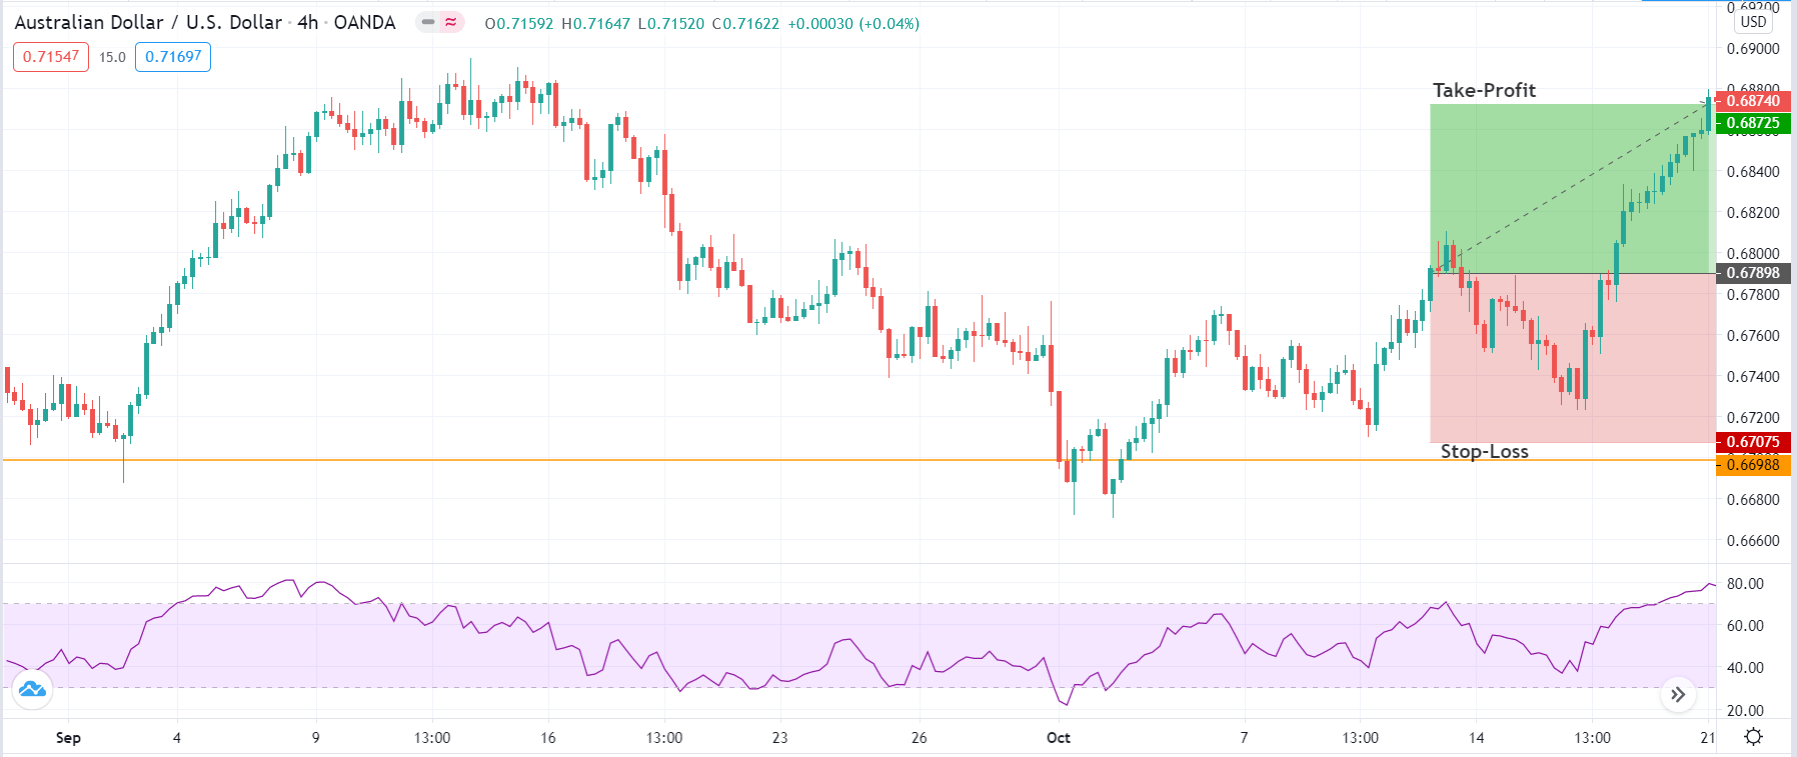
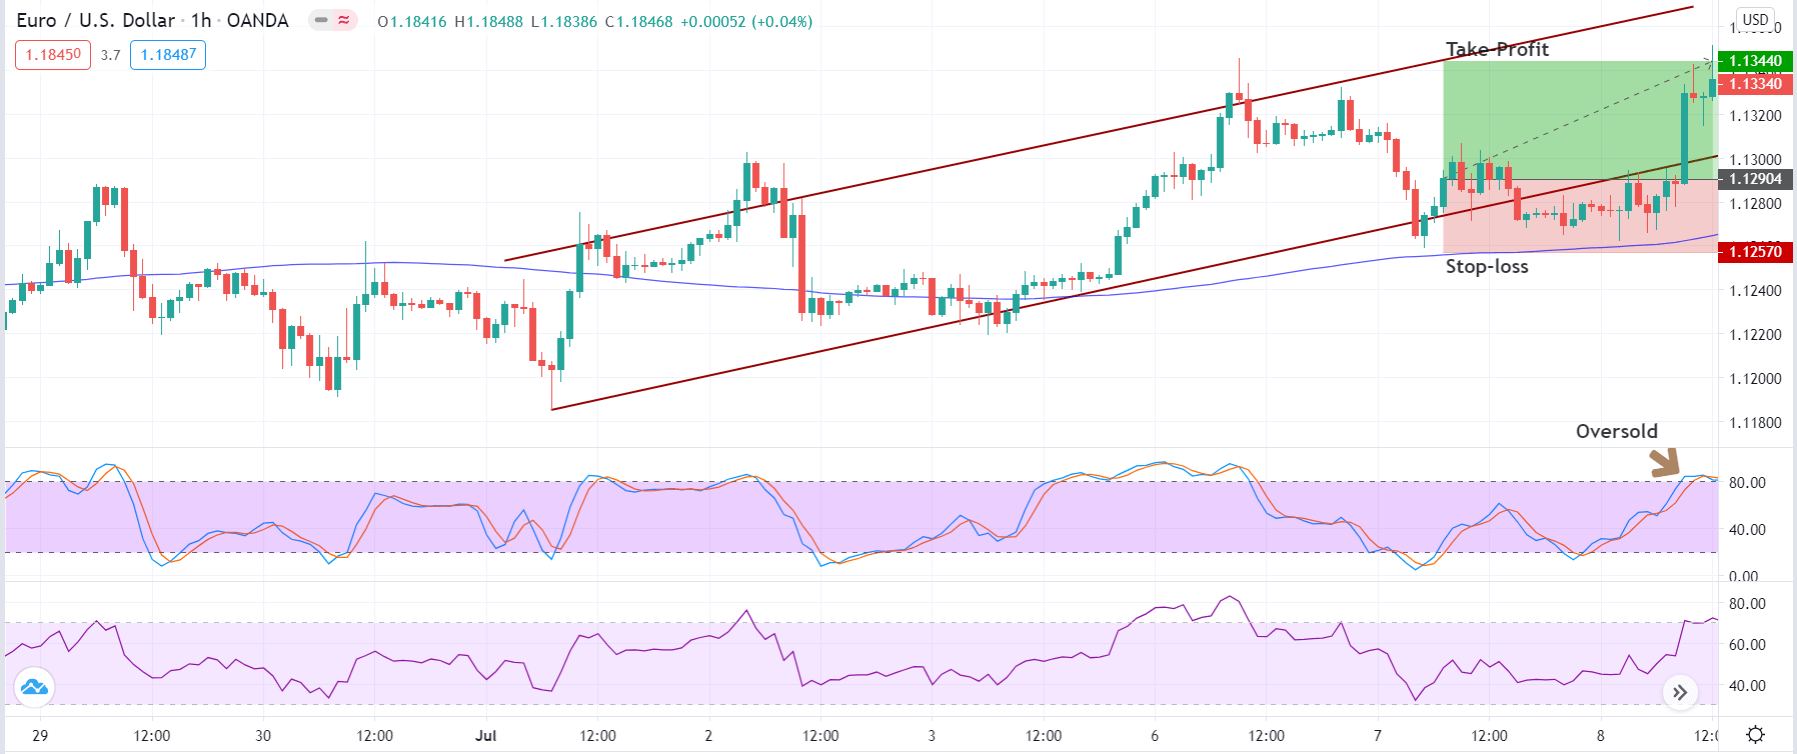
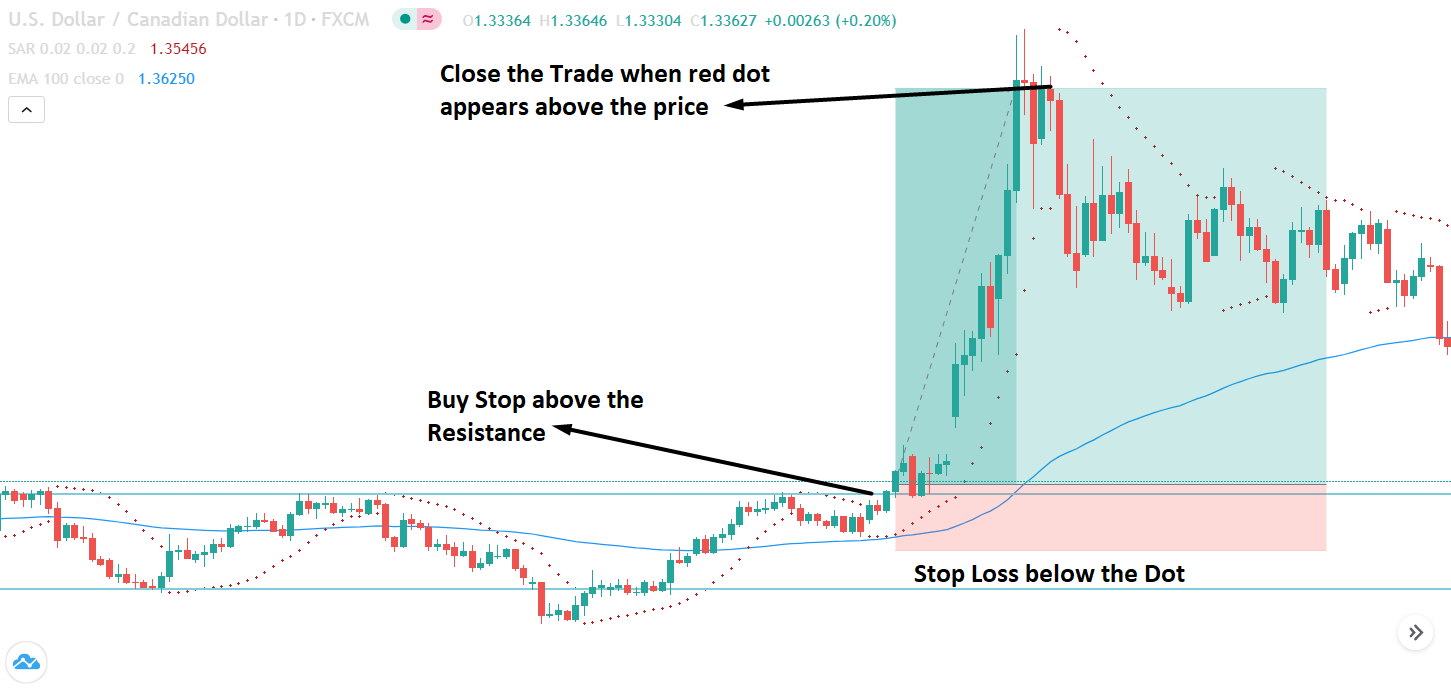
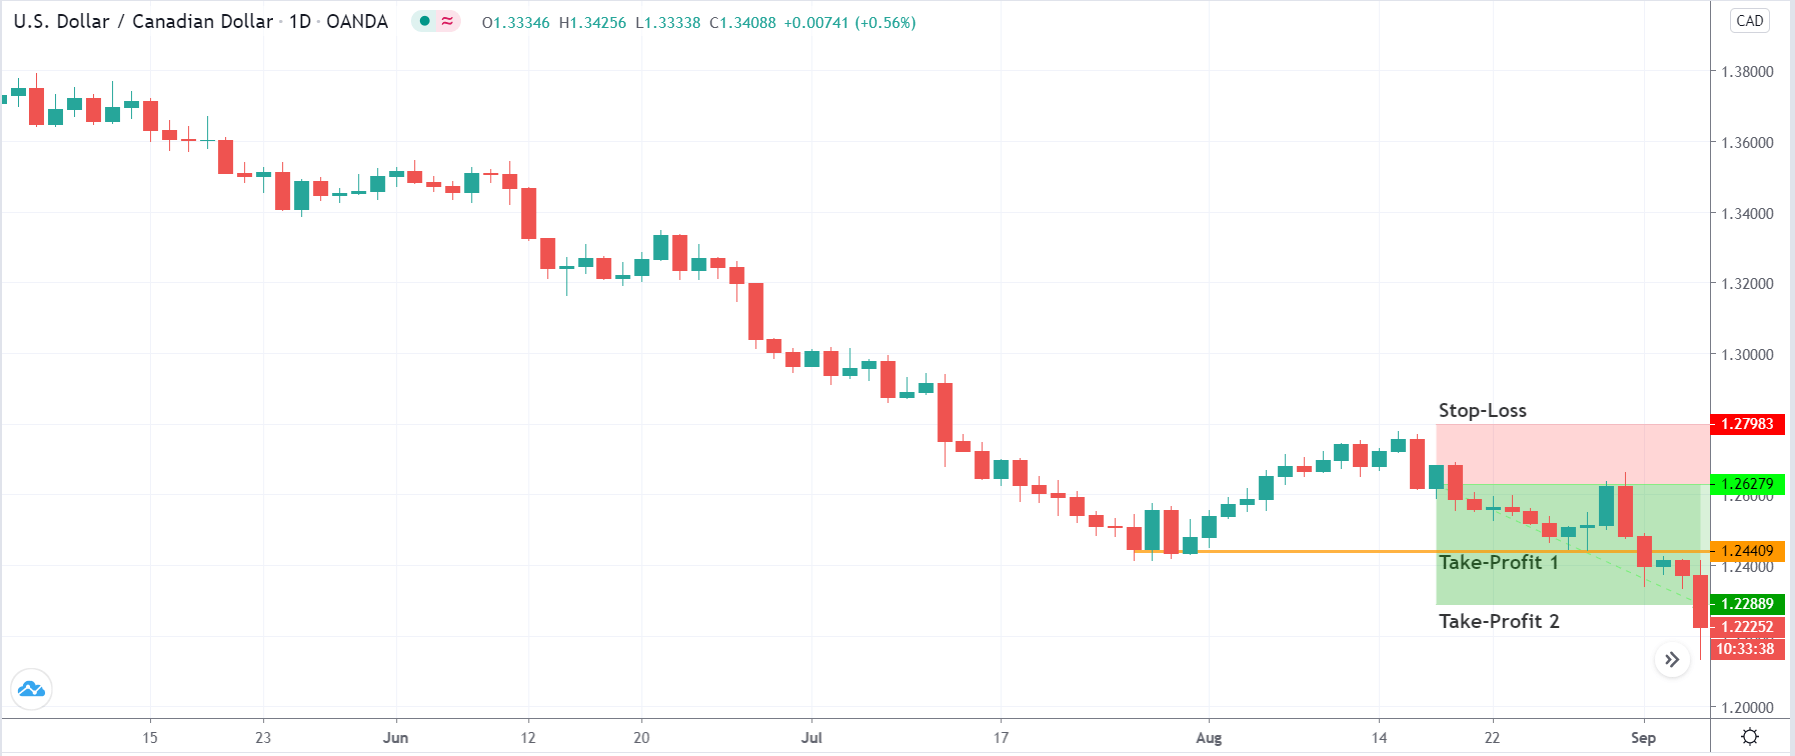
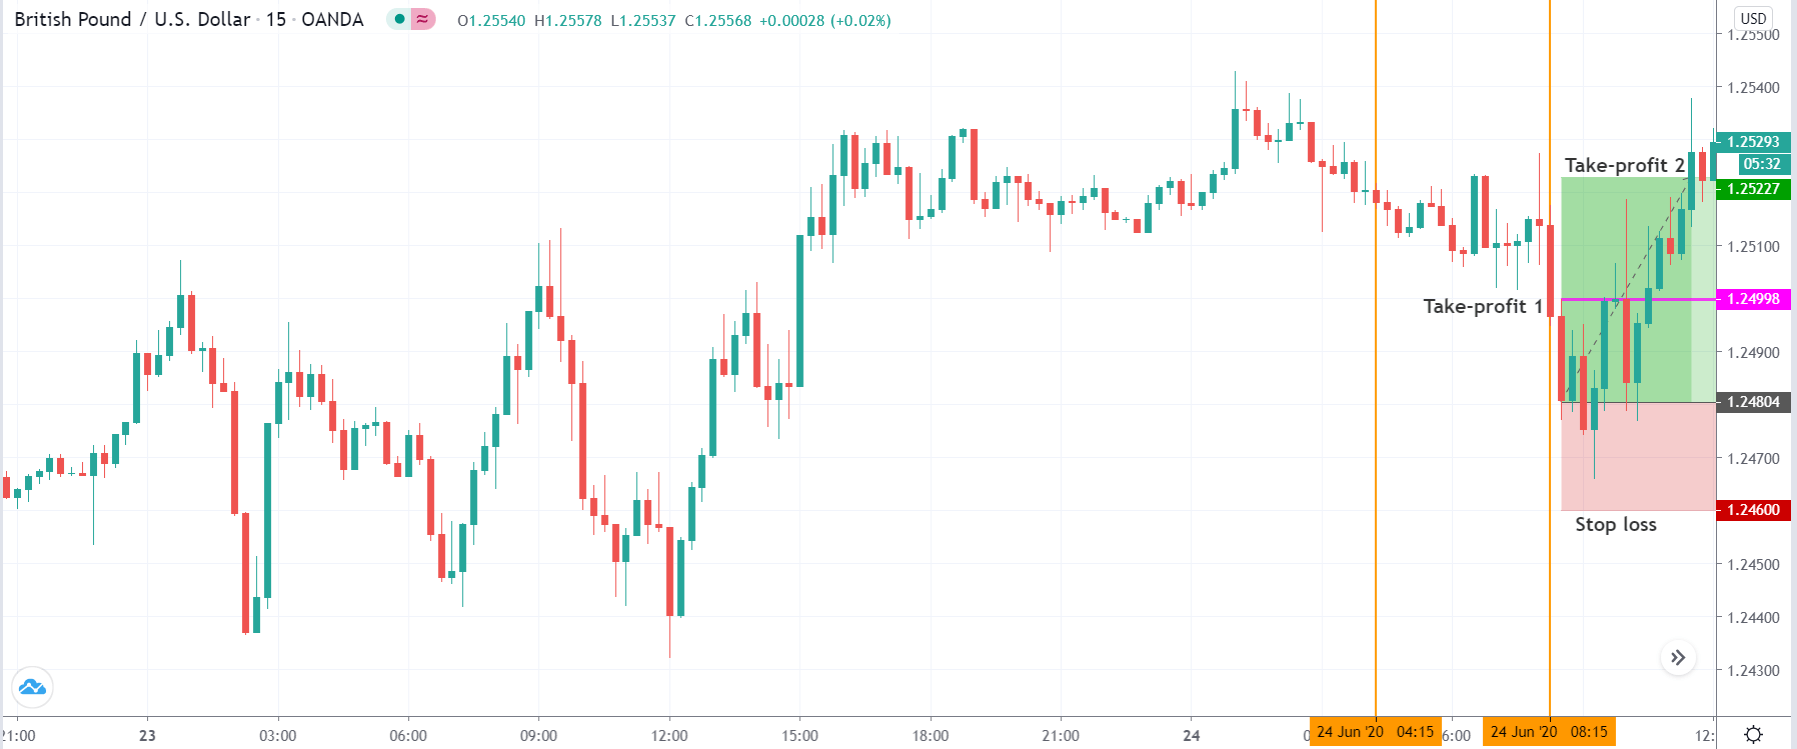
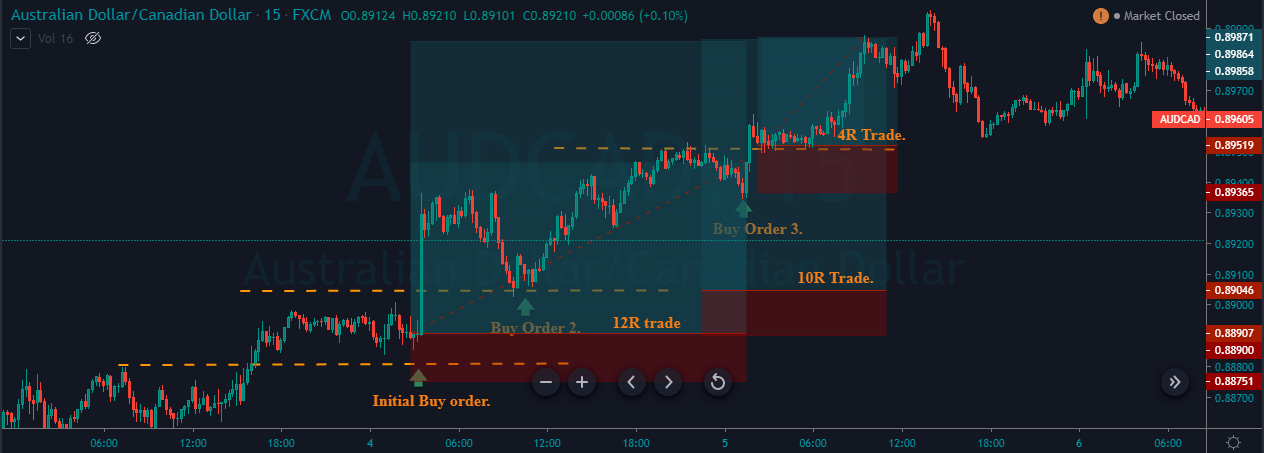
Now let us go back to that Buy and Hold and cash out along the way strategy where you can apply the plan. Forex traders already have their Money Management plan so they can set a Stop Loss if it is not a Buy and Hold Forever type. How deep the SL level will be is on the trader to determine, but have one in place. Have a Take Profit level too at some nice gain point, at least one, and then move your SL to breakeven when TP gets hit. This is all basic common sense and an example you should already know if you are a forex trader. In the Buy and Hold strategies, it is also applicable.

Since in this type you cash out along the way, you can put multiple TP levels and leave that little bit in the asset. That little bit can be saved for your potential “flyer” rally breaking the sky limits with the trailing stop so you do not miss those life-changing investments. It may not be amazing that just a part of your initial investment captured that rally but you can rest easy, you have a system that is making it all happen again. This basic plan will get you in the top 95-99% of investors, and it can even get better.

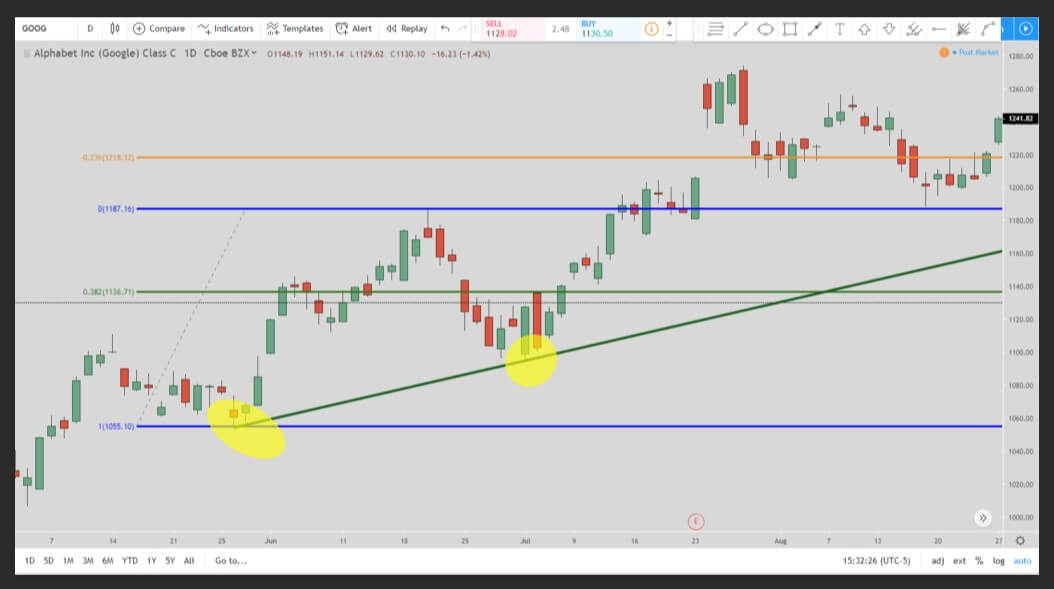
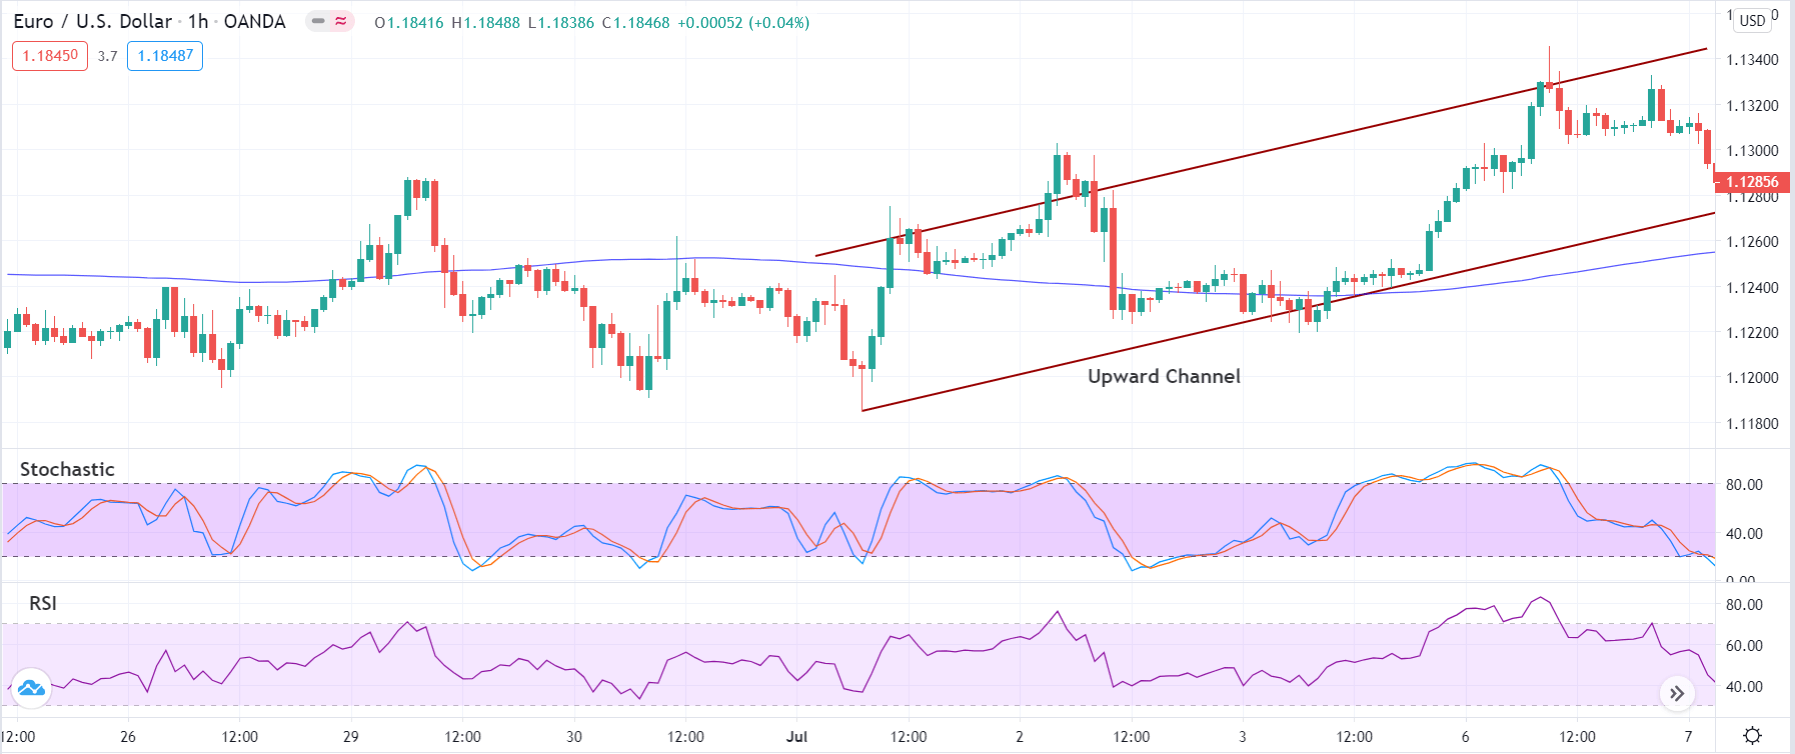
So we know we have great odds in our favor by having a plan, but nowadays we also have the ability to go short, not just long. We can do it on gold, commodities, ETFs, and many more assets. This almost double our odds, there is no need now to sit out the drops. Surprisingly, many people do not use this ability and there is no reason why forex traders should too. Further improvement of the forex trader odds is by selecting the assets that almost have no chance of dropping to zero or going so low they do not have a chance of recovery. These assets are stocks, some companies do not have chances of recovery, for example like Sears. Gold is an asset that will probably not going to drop to zero, Energy ETF baskets too. The final and great advantage forex traders have is their technical analysis system. With the well made and tested system forex traders have better odds than investors and even financial advisors.

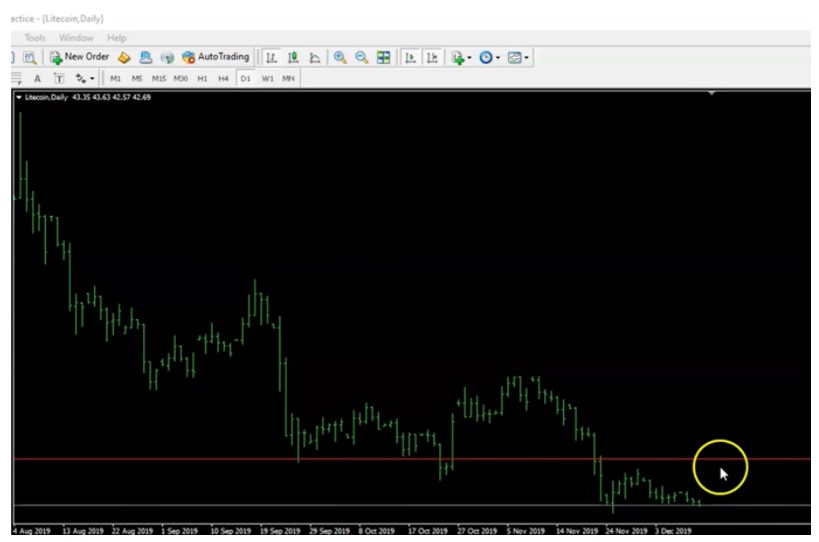
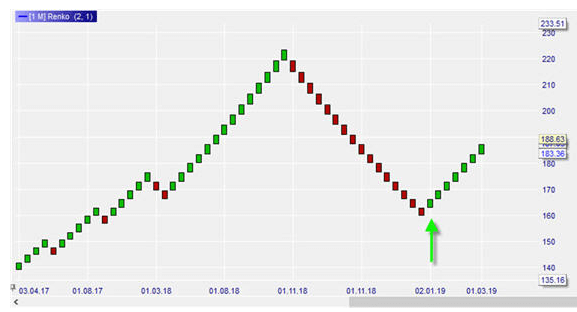
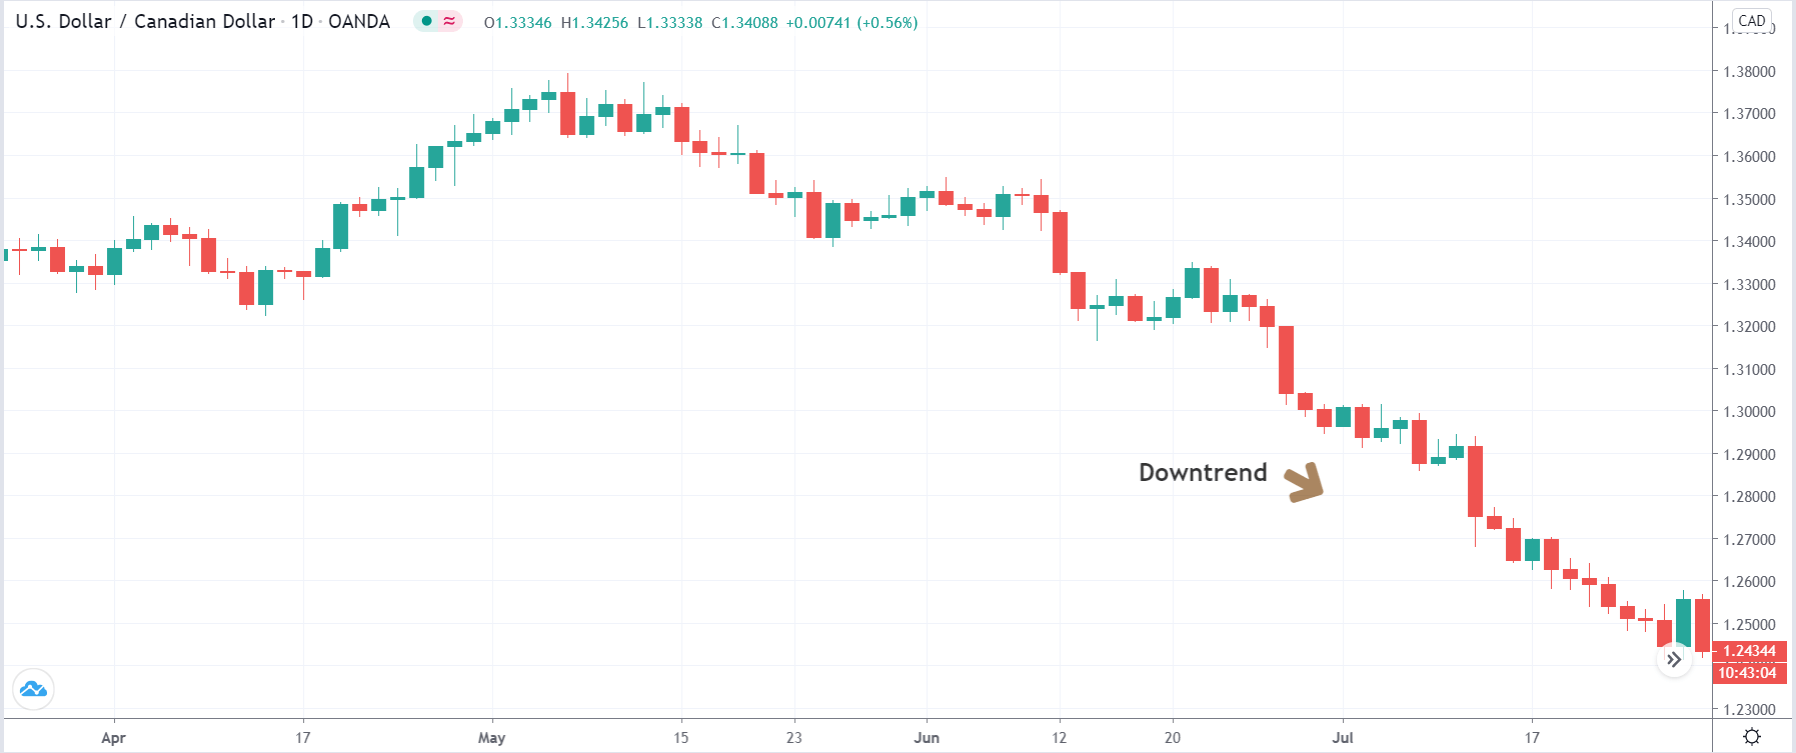
Now you need to decide do you want to Sell and Hold or Buy. There are many inverted ETFs that will allow you to short indexes. So are we in the seller’s market or the buyer’s market now? If you think we are in the cyclic bubble right now then you may go in the selling direction but know that you might be wrong. This means you should not go all-in on the short side. Also, the algorithm will tell when is the right time to make a trade. The timeframe used for trading is not optimal for long term investment so increasing to monthly is recommended.

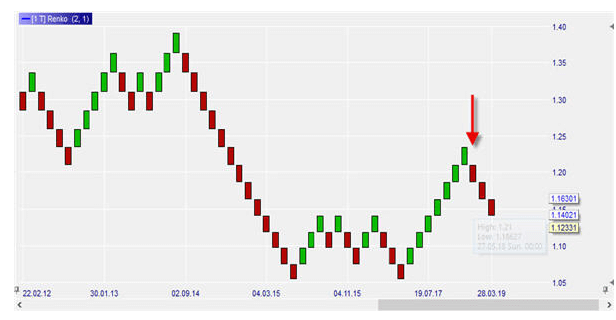
For that Long term Swing trading strategy, the weekly timeframe is the most optimal. Swing trading on this timeframe is not really considered Buy and Hold but it is for those who want to participate in the price action. If you have the system that works universally on every timeframe, then why not use it to squeeze more. Whatsmore, trading on a weekly will relieve you of the trouble if the market is in the sellers or buyers zone.
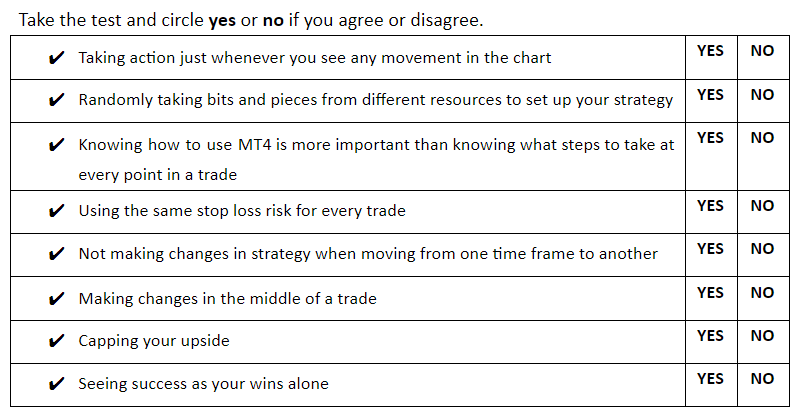
Categories
Forex Basic Strategies

How To Trade The ‘Higher High Failure’ Countertrend Strategy?

Introduction

There are millions of strategies out there in the market. Some work exceptionally well, while some fail miserably. Trading successfully is not about knowing several strategies, but about one strategy that works consistently. All professional traders are never in the hunt for trying out different strategies. They have expertise in a single strategy and know when to apply it and when not to.

Here, in this article, we shall be walking you through a simple yet extremely strategy that both day and positional traders can apply. Besides, we will enlighten you on the dos and don’ts of the strategy.

Understanding a Trend

The most evident state of the market is a trend. It is indeed the best state to trade as one can easily bet on the market’s direction. In technical terms, the trend is the state of the market, where the price makes higher-highs/higher-lows or lower-lows/lower-highs.

A trend alone can be of different types – based on the pattern. The above image of a trend is how an ideal trend looks like. However, the number of occurrences of this type of trend is very less. Apart from the ideal trending market, we can have other types of the same state.

Figure 1: In this type, the market breaks about the Support and Resistance (purple line), retraces through the line, and then makes another higher high.

Figure 2: Here, the market makes a HH by breaking about the S&R (purple line), pulls back insignificantly, away from the S&R, and makes a higher high.

Figure 3: The market made HH passing through the S&R, retraced a little, tried to make a higher high, and failed. Later, it retraced more than the previous time, and then successfully made a HH.

What is the ‘Higher High Failure’ Countertrend Strategy?

The “Higher High Failure” countertrend strategy is based on the third figure of the above image. It is named countertrend because the overall trend of the market is up, but the strategy is to take a short position.

According to the strategy, in an uptrend, if the market fails to make a higher high on the very first attempt, then one can prepare to go short on the security.

Logic

In a sequence of higher highs and higher lows, if the market fails to break above the recent HH, it is an indication that the trend is preparing for another push down before heading up. The failure also indicates that the buyers are not strong enough to push the market higher with one retracement. Since the buyers are slowing down, one can swing down from the seller before the market resumes its trend. Note that the length of this south wing depends on the strength difference of the buyers are sellers.

Trading the Higher High Failure Strategy

Consider the below chart of Euro / US Dollar on the 1H time frame. We can see that the market is in an uptrend making higher highs and higher lows.

The most recent higher high made by the market was 1.11834. The market then retraced to 1.1098, tried to make a new high from the previous one, but failed by leaving a wick on the top.

The failure to make a higher high indicates that the buyers are losing momentum, and as a result, the sellers could temporarily take over the market. In addition, the wick on the top at the resistance area signifies the strength of the sellers. Thus, right after the price shoots down at holds below the S&R (grey ray), one can go short on the pair.

Take Profit Placement

Since the buyers shot up from 1.10988 the previous, we can expect a reaction from the same level. Hence, 1.10988 would be the safest level to place the take profit level. If the sellers are strong in momentum, one can ride down until the S&R.

Stop Loss Placement

Stop-loss few pips above the wick can keep you away from getting stopped out. But it is risky to keep the stop loss right above the resistance level.

On the flip side, this strategy will work like a charm on a downtrend as well. For a downtrend, the strategy could be termed as a “Lower Low Failure” countertrend strategy. Let’s take an example of the same and understand how to trade a down-trending market.

In the below chart of GBP/CAD, we can see that the market is in a downtrend, making lower lows and lower highs. Level 1.70006 was the most recent LL. The market retraced to the S&R and tried to make a new LL but failed. During the failure to make a LL, a spinning top candle appeared, which was then followed by a bullish candle to close above the LL level. This confirms that the sellers are have temporarily faded out, and the buyers are going take over the market.

Take Profit Placement

Take profit can be placed at the price where the market tried to make a lower low previously. In this example, the TP would be at the S&R.

Stop Loss Placement

The safest stop loss for this strategy would be right below the price where it failed to make a LL.

Important Points to Note

  • The price should attempt to make a higher high and fail. The strategy cannot be considered for an equal high.
  • After the failure to make HH, the price should hold below the S&R level.
  • The strategy will not work if the price makes HH, holds, and then drops below the S&R.
  • Since it is countertrend trade, make sure to take profits at every hurdle.
  • The stop loss must be above the high of the higher high failure, NOT right at the resistance.

We hope you found the strategy interesting and useful. Do test it out in the live market and let us know the results in the comment section below. Cheers!

Categories
Forex Basic Strategies

Pro Scalping Technique By Combining Stochastic With Bollinger Bands

Introduction

Scalping is a trading strategy that helps traders to take advantage of minor price movements on lower timeframes. It is one of the quite popular ways of trading the Forex market. There are many successful scalpers who make a lot of money by scalping the minor price moves. To be a scalper, we must be emotionally intelligent and have the ability to make quick decisions.

Scalpers place anywhere from 0 to a few hundred trades in a single day. Ideally, smaller movements in price are easier to catch compared to the longer moves. Typically while day trading, if the win/loss ratio is less than 50 percent, traders still make money. On the other hand, in scalping, it is critical to win most of the trades. Otherwise, we will end up on the losing side.

Stochastic Oscillator

Stochastic is a wonderful indicator developed by George C. Lane in late 1950. This indicator doesn’t follow the price or volume like other popular indicators in the market.  Instead, it follows the speed and momentum of the changes that occur in price before the trend formation. Stochastic is a range bounded indicator, and it oscillates between the 0 and 100 levels.

Typically, a reading above 80-level is referred to as the overbought signal, and a reading below the 20-level indicates an oversold signal. The Stochastic indicator consists of two lines, where one reflects the actual value of the indicator for each session, and another reflects its three-day simple moving average. The intersection of these lines indicates the reversal in price action.

Bollinger Bands

Bollinger Bands is a technical indicator developed by John Bollinger in the 1980s. It is a leading indicator, and it consists of two bands and a centerline. Out of the two bands, one stays above the price action, and the other stays below. Both of these bands contract and expand depending on the market’s volatility. When price action hits the lower band, it indicates a buy trade, and when it hits the upper band, it indicates a sell trade.

The Strategy

The strategy we are going to discuss is one of the most basic but effective scalping strategies ever used in the market. The idea is to apply both indicators (Bollinger Band & Stochastic) on the price chart. When the price action hits the lower Bollinger band, and the Stochastic is at the oversold area, it is an indication for us to go long. Conversely, when the price action hits the upper Bollinger band and if the Stochastic is at the overbought area, we can go short.

In the chart below, we can see that our strategy has generated a few buy/sell signals in the EUR/AUD Forex pair. The price action was in an overall uptrend. When both of the indicators gave us the signal, we took both buy and sell entries accordingly. In the chart below, the buy trades have given us some good profits, but in the sell trades, the profit was comparatively less. Always remember that these things are quite common in scalping. If you are an aggressive scalper, trade both buy sell signals. But if you are a trader who prefers to scalp the market with the trend, follow the next strategy.

Scalping The Market By Following The Trend

Buy Example

The chart below represents an uptrend in the EUR/AUD Forex pair. As you can see, by following our strategy, this pair has given us three buy signals, and all the trades were quite healthy and have performed well in the market. If you scalp the market by following the trend, it is easy to make big gains. For scalping, it is required to put smaller stops. Hence, always go for 4 to 5 pip stop-loss and 10 to 15 pip target. You can also exit your positions when the price hits the upper Bollinger band.

Sell Example

The below 3-minute chart of the GBP/JPY forex pair represents a couple of sell trades. As you can see, all the sell trades in this pair performed very well. We can also observe that every time the price action prints a brand new lower low. We took all the five selling trades on a single trading day, an all of them hit the take-profit range. So if we scalp the market by following the trend, it will be quite easy to make some profits from the market. The red arrows on the Stochastic and Bollinger Band indicators represent the sell signals.

Scalping The Ranges

Just like the trends, it is easy to scalp the ranges as well. In fact, the ranges are even easier to scalp than the trend because the support and resistance lines of the range offer extra signals for us. For ranges, all you need to do is to hit the sell when price action hits the top of the range and hit buy when prices hit the range bottom. If you add the Bollinger Bands and Stochastic indicator, the signals generated by the market will be stronger.

The chart below indicates a couple of buy/sell signals in the GBP/JPY 3-minute Forex chart. As you can see, we have gone long when prices hit the bottom of the range, combined with our strategy. The same applies to the sell-side. We have gone short when the price action hits the top of the range while respecting our strategy rules.

Conclusion

Scalping trading involves entering a trade for a shorter period of time to take advantage of small price fluctuations. When you enter a trade, it is advisable to risk lesser money and place as many trades as you can. We must have control over our inner greed and aim for smaller targets. In the beginning, it will be difficult for you to scalp the market as the smaller timeframes move way faster. You need to train your eyes a bit to understand the lower timeframes properly. Always try to scalp with a bigger trading account because the trading commissions can quickly eat up the smaller accounts.

Categories
Forex Course

114. How To Trade Bearish & Bullish Pennant Patterns

Introduction

The Pennant is both a bullish and bearish continuation pattern that is used by technical analysts across the globe. This pattern can easily be identified on the price chart and is typically used for trading the upcoming price movements. In an ongoing trend, when the instrument experiences a significant upward or downward movement, followed by a brief consolidation, the Pennant pattern is formed.

Pennant Pattern’s Key Characteristics

A Flagpole The Pennant pattern always begins with a flagpole, and that is the initial strong move.

Breakout Level – Two breakouts should occur in this pattern. The first one will be at the end of the flagpole, and the second one should be after the consolidation period.

The Pennant Itself A triangular pattern is formed when the market consolidates between the flagpole and the breakout, and we call that a Pennant.

How To Trade The Pennant Pattern?

The Pennant is a relatively simple and easy-to-spot pattern on the price charts. We will find this pattern on all the timeframes, and the strategies that we are going to discuss will work on any timeframe you trade. In the below examples, we have used 15 minutes, Daily, and Weekly charts to prove the same. All you need to do is to train your eyes well to spot the pattern. Once we master this pattern, we can easily increase the probability of our winning trades.

Trading The Bullish Pennant Pattern

Example 1

In the below EUR/GBP chart, we have identified the formation of a Bullish Pennant Pattern.

We must always look to take long or short positions depending on the breakout in the Pennant chart pattern. If we find a bullish Pennant pattern, we must wait for the price action to break out in the north direction to take a buy trade.

In the below chart, you can see that when have placed a buy order after the price action broke the Pennant’s upper trend line. The take-profit should be placed at the higher timeframe’s resistance area, whereas the stop-loss order should be below the lower trend line. The best part about trading this pattern is that it offers a good risk to reward ratio, and most of the trades hit the targets within a few hours.

Example 2

In the below AUD/NZD chart, we have found another Bullish Pennant pattern.

Here, we can see the market has started a new downtrend, and we have placed a buy order right after the price broke the upper trend line. We can see our trade hitting the TP within a few hours. If we find this pattern in active trading hours, or when any trading session is about to begin, it is advisable to take bigger trades because opening trading hour breakouts have higher chances of succeeding.

Trading The Bearish Pennant Pattern

In the image below, you can see that we have identified a Bearish Pennant pattern on the GBP/NZD pair.

In the below chart, we can see that a brand new downtrend has just begun. The first leg of the pattern (flagpole) was quite strong. When the price action broke below the lower trend line, it is an indication for us to go short in this pair. The take-profit is as placed as same as the size of the flagpole, and stop-loss was just above the pattern formation.

That’s about Bullish and Bearish Pennant pattern and how to trade them along with appropriate risk management. Following money management principles is as crucial as entering the market at the right time. If you have any questions, let us know in the comments below. Cheers!

[wp_quiz id=”72786″]
Categories
Forex Basic Strategies

Pairing The ‘Gravestone Doji’ Pattern With Significant Resistance Levels

Introduction

Gravestone Doji is a bearish reversal candlestick pattern that occurs at the top of an uptrend. This pattern helps the traders to visually see where the significant resistance level is located on the price chart. The most important aspect of the Gravestone Doji pattern is its long upper shadow. The candlestick’s open, close, and low are all the same in this pattern.

The psychology behind the long upper shadow is this – In an ongoing uptrend, when the price action hits the significant resistance line, buyers exit their positions, and the price action is smacked down by the sellers. In short, the appearance of this pattern represents the losing momentum of the buyers and essentially indicates a bearish reversal in the market.

Most of the traders place their trades as soon as this pattern appears on the price chart. But that’s definitely not the right approach. Instead, we must wait for the next candle to close for the confirmation and only then take the trades. The opposite of the Gravestone Doji is the Dragonfly Doji, which appears at the bottom of a downtrend or the major support area. The below image represents the Gravestone Doji Pattern.

Trading Strategies – Gravestone Doji Pattern   

The Gravestone Doji pattern indicates that the buying trend is ending, and the market is reversing to the selling side. However, this doesn’t hold true all the time. We will be finding this pattern quite often in all the types of market conditions, and if we start trading every time we find them, we will end up on the losing side. We always need to ask our self the reason why this pattern appears in certain conditions. Is it going to reverse the market or not?

Pairing the pattern with a significant resistance level

If you find this pattern at the bottom of the range, do not trade it. But if the price action prints this pattern at the top of a range, it can be considered a sign for us to go short. Similarly, find the trending markets and look for a major resistance level where the price could possibly react. So when the price action prints a Gravestone Doji at the major resistance level, it’s a strong sign for us to go short.

In the below USD/CHF Forex chart, we can see that the price action has printed the Gravestone Doji pattern at the significant resistance level. We should be going short as soon as the Doji candle closes.

In the below image, we can see that we took a sell entry when the market printed the Gravestone Doji pattern. We have placed the stop-loss just above the resistance level. It is safer to put the stop-loss above the pattern or at the resistance line because if the price goes above the pattern, the pattern gets invalidated. We know that the Gravestone pattern indicates a market reversal, and most of the time, these reversals travel quite far. That is the reason why we go for deeper Take Profits.

In the above chart, we can see that we had exited our full positions when strong buyers showed up. This indicates that the sellers are losing their momentum, and there is no logic to continue holding our positions.

Gravestone Doji + Stochastic Oscillator

The strategy that we shared above is for aggressive traders who like to take risks. However, if you are A type of trader who needs more confirmation to pull the trigger, we suggest you follow this strategy to trade this pattern. Most of the conservative traders do have a fear in their minds that one single candle does not have the potential to reverse the market. And it is completely okay to think like that. The truth is that sometimes even a single candle can move the market, and sometimes it doesn’t. Ultimately it is your money management system that makes all the difference.

But to filter out some poor signals and to get an additional confirmation, it is advisable to use the Stochastic oscillator to confirm the probability of our trading signal. Stochastic is a range-bound indicator that oscillates between the 0 & 100 levels. When the Stochastic goes above the 70 level, it means that the market is in an overbought condition, and we can expect a change in the trend. Likewise, when it goes below the 30 levels, it means that the market is oversold are we can expect a reversal anytime soon.

The Stochastic indicator also shows the bearish and bullish divergence, which helps the traders in trading the upcoming reversals. The divergence is when the market moves in one direction, but the indicator is signaling a different direction. Now we believe that you understand the basics of trading with the Stochastic indicator. Now let’s dive into the strategy.

The strategy here we are using is simple and straight forward. First of all, identify the Gravestone Doji pattern at a significant resistance level in an uptrend. Then, apply the Stochastic indicator to the price chart and check if the indicator is at the overbought area, indicating a downside reversal. If yes, go short and place the Stop-Loss just above the pattern.

The GBP/CAD chart below indicates the appearance of the Gravestone Doji pattern in an uptrend. When the price is approaching the upper resistance level, it got smacked down immediately, and the market ended up printing the pattern. The next six candles tried very hard to break the pattern & resistance line, but nothing worked, and the price ended up rolling down. We can also observe the Stochastic indicator was at the overbought area, which is a confirmation sign for us to go short.

We have entered for a sell when both the conditions are met, and placed the Stop-Loss just above the pattern. For the Take-Profit, we choose to go for deeper targets. When the selling trend started to struggle, the Stochastic indicator was at the oversold selling conditions. At that point, we have closed our full positions for obvious reasons.

Conclusion

The trades taken based on the Gravestone Doji pattern are pretty reliable. But do not make the mistake of identifying the pattern everywhere on the price chart. The psychology behind this pattern says that the bulls drove the price to a peak point, and the sellers are comfortable in reversing the market. For booking profits, you can expect an equal move to that of a previous trend. If you are an intraday trader, make sure to exit your positions at any significant level. Although this pattern appears on all the timeframes, the reliability is higher on higher timeframes to that of lower timeframes.

We hope you find this article informative. Try trading this pattern on a demo account and master it before applying the above-mentioned strategies on the live market. Cheers.

Categories
Forex Basic Strategies

Trading The ‘London Session’ Like A Professional Technical Trader

Introduction

In total, there are five major trading sessions in the Forex market, and we have already discussed the New York Breakout Strategy. In this article, let’s learn the best way to trade the Forex London session.   The London session is one of the biggest market movers because a lot of trading volume for instrument trading occurs in this session. The volume of the instrument essentially means the total amount of money that moves the market in any particular session.

Most of the financial centers and major banks start their day around the London session. These banks and institutions try to accommodate their clients in this session alone. This is one of the reasons why the price action is quite volatile and aggressive in this session. In other words, for retail traders, the London session is a prime window to make huge profits from the market. Because of the higher the volatility, the more the trading opportunities.

In this article, we will be sharing some of the proven techniques that can you can use to trade the London Session. The key to finding success while trading the London session is to be extremely disciplined. It is crucial to follow the rules of the strategy and do the required analysis before the London opening. If we miss our entries at the time of the London opening, we can’t expect a second chance to get back with the trend.

London session opens at 8 AM GMT. If you are not aware of the exact time when the London sessions open, you can make use of the Forex Time Zone Converter to accurately find the opening of this session in your local time.

London Session – Breakout Trading Strategy

We have backtested the strategies that have been mentioned below. The results revealed that most of the time, these strategies provide trading opportunities during the first three hours of the London session. Sometimes, the volatility picks up 30 minutes before the opening of the London suggest. But we always recommend you activate your trades only after the opening of the London session.

  1. Find out any currency pair which is in a strong uptrend.
  2. Price action must hold below the resistance line if the market is ranging before the opening of the London session.
  3. Wait for the breakout to happen in the London session.
  4. Let the price action hold above the breakout to confirm if the breakout is valid.
  5. Take a buy entry.
  6. Place the stop-loss below the breakout line.
  7. Take-profit can be placed at the next resistance area.

The same is the opposite in a down-trending market and when we are willing to go short.

Identifying The Currency Pair

The below AUD/CHF Forex pair represents an up-trending market.

Confirming The Breakout

We can see a breakout happening at the opening of the London session. This indicates that the big players are now ready to move the market. The price action held above the breakout line, indicating that the breakout is real. Going long at this point will be a good idea.

Entry, Stop-Loss & Take-Profit

In the below image, you can see that we have taken a buy position right after the breakout in the London session. The stop-loss is placed just below the recent low, and we chose the higher timeframe’s major resistance area to place our take-profit. A lot of traders believe that if they use this strategy to trade the London session, they must close their positions on the very same day. But that’s a wrong perception as we should be deciding that depending on the market conditions. It is logical to hold your positions until the price reaches our desired take-profit area.

London Breakout + MACD Indicator

In this strategy, we have used the MACD indicator to trade London breakouts. MACD is a celebrity indicator which is popular among most of the professional traders. MACD stands for Moving Average Convergence and Divergence. This indicator consists of two lines; the first one is the MACD line, and another one is known as the second line. MACD is a trend following indicator which is used to identify the overbought and oversold market conditions.

The strategy here is to wait for the breakout to happen right after the opening of the London session. At the time of breakout, check if the MACD indicator is at the oversold area. If yes, it is a clear indication for us to go long. If the MACD is above the zero lines, it is even a greater sign as it indicates that the ongoing trend is strong. Anticipating bullish moves from this point will be a good idea.

The below price chart represents the AUD/CAD Forex pair, and we can see the market is in an uptrend.

In the below image, it is clear that the MACD lines crossed over precisely when the breakout happened at the London opening. This is a clear indication for us to look out for buy opportunities in this currency pair.

We went long right after the breakout in the London session as it was confirmed by the MACD crossover.  We have placed the stop-loss just below the resistance line. We can set the stop-loss order according to our trading style. If you are a confirmation trader, wait for the things to be in your favor to make an entry and use a wider stop-loss. If you are an aggressive trader, the stops below the recent candle are good enough.

If you are a conservative trader, the stops we placed in the below example is good enough. We always suggest you close your positions at the next resistance area. You can follow that process for this strategy as well. Here in this example, we tried to be a bit creative and closed our positions when the MACD indicator gave us an opposite signal. When the MACD indicates that the market is in an overbought condition, it means that the buyers are exhausted now, and it’s time for us to go short. You can see the bearish moment in the market right after we have booked our entire profits.

Conclusion

Both of the strategies mentioned above are simple and easy to use to trade the London market. If you are a beginner, we suggest you practice them first on a demo account. London breakout often gives reasonable risk to reward trades, and most of the trade results can be seen within a few hours. Make sure to follow all the rules of the above strategies to have the edge over the market. All the very best.

Categories
Forex Course

87. Using Ichimoku Cloud To Identify Trading Signals In The Forex Market

Introduction

The Ichimoku Cloud is a Japanese charting method and a trading system developed by Mr. Goichi Hosoda. This indicator consists of many different lines embedded in the price chart. Hence it might look complicated at first and might even make novice traders unforgettable reading the charts. But with enough experience, we can grab all the information presented by the indicator. The indicator consists of five Moving Averages and a cloud formed by two of those averages. The default settings of the indicator are 9, 26, and 52, and these settings are configurable according to the trader preference.

Components of the Ichimoku Cloud

This indicator consists of five lines in total, as discussed. They are a Red Line (Tenken Sen), Blue Line (Kijun Sen), Green Line (Chinoku Span), and Two Orange lines that make the cloud (Senkou Span A and B). Each line of the indicator is a moving average, so we can also look at the Ichimoku cloud indicator as a five moving average indicator.

The Basic Interpretations of the Ichimoku Cloud

When the price is above the cloud, it means the market is in a bullish trend. Contrarily, when the price is below the cloud, it means the market is in a bearish trend. When the price action is in the middle of the trend, it means that the market is in a consolidation phase.

Below is how a Forex price chart looks when the Ichimoku cloud is plotted on it.

Ichimoku Cloud Trading Strategy – Buy

First of all, the price action must be above the cloud as it indicates that the market is in an uptrend. When the Tenken Sen (Red Line) crosses the Kijun Sen (Blue line) from below, it indicates a bullish signal, and we can go long.

Buy Example 1

The image below represents a buying trade in the CAD/JPY Forex pair. We can see that the cloud goes below the price action, and it indicates that the trend is up. Soon after Tenken Sen (Red Line) crosses the Kijun Sen (blue line) below the price action, we know that the pullback is exhausted, and buyers are ready to resume the uptrend.

Buy Example 2

The image below belongs to the Weekly chart of the USD/CHF Forex pair. In Dec 2000, the Ichimoku indicator generated a clear buy signal when the cloud was below the price action, and the crossover of both the lines shows that it’s a perfect moment to go long in this pair.

Ichimoku Cloud Trading Strategy – Sell

The price action must be below the cloud as it indicates that the market is in a downtrend. Go short when the Tenken Sen (Red Line) crosses the Kijun Sen (Blue line) from above as it indicates a sell signal.

Sell Example 1

The below example is from the daily chart. It doesn’t matter which timeframe we trade; this strategy works well on all the timeframes. In the below image, at first, the market was in the consolidation phase. When the cloud goes above the price action, it’s a sign for us to prepare to go short soon in this pair. When the Tenken Sen (Red Line) crosses the Kijun Sen (Blue Line), it indicated that the sellers are now ready to print a new lower low.

Sell Example 2

If you are an investor or a higher timeframe trader, the below example is for you. The Red arrows and the encircled area indicate that the price action is below the cloud. Also, the Tenken Sen (Red Line) crosses the Kijun Sen (Blue line), indicating a sell signal.

The example below we took was from 2016, and the price action continuously goes down for the complete year. We should be patient enough and have control over our emotions to ride longer moves. We have placed the stop-loss above the crossover of two lines and booked the profits when the cloud goes below the price action.

That’s about Ichimoku Cloud and relative trading strategies. There are many other ways through which the signals can be generated using this indicator, but the ones discussed above are the most basic yet reliable ones. Cheers.

[wp_quiz id=”67661″]
Categories
Forex Basic Strategies

Scaling Positions Using The Pyramid Trading Strategy

Introduction

You would have heard most of the successful traders and market gurus say ‘let your winning trades run.’ That is very true, but do you know how to do that? You would have probably asked this to yourself many times. In today’s article, let’s understand a strategy that helps you in turning your small trades to big ones using a strategy called Pyramiding.

This Forex Pyramid Strategy helps you in increasing the chances of making consistent returns as a Forex trader. Using this strategy, we can scale our winning position and make the most of the trend. This strategy cannot be used in every market situation. If you do that, it will be the most destructive thing you do to your trading account.

Pyramiding our trades work very well in trending market conditions only. To make consistent returns from the market, we need to buy or sell strategically to add to an existing position. Always remember that when we are right, we must be really right, and when we are wrong, we must cut our trades immediately. The concept of this strategy can be applied to both long and short positions.

We can get a basic idea of the pyramid strategy from the below image. Here, we can see the price action printing brand new higher highs and lower highs continuously. The market is clearly breaking the resistance line and taking that line as a support. Note that the price action must break the resistance line with strong power. The price should also show the sign of holding at the support line.

The key to successful Pyramiding is to have a proper risk to reward ratio in place. That means our risk should never be greater than the reward. So if our target is 50 pips, our stop-loss must not be greater than the 25 pips.

Rules to Trade the Pyramid Strategy

🏁 Pick a market that is in a strong uptrend and wait for the price action to break the significant resistance area. Let the price test that resistance line as support.

🏁 Go long when the market gives you a buy signal. You can even look out for the appearance of any bullish candlestick patterns like Engulfing, Dragonfly, or a Bullish pin bar, etc.

🏁 Let that trade run because the market is in a strong uptrend.

🏁 Then wait for the price to break through the second resistance line and retest it as strong support.

🏁 Notice if the price is holding at the support line, and if it prints any buying candlestick pattern, go long again by extending your buy position. Make sure to trail your stop-loss after taking the second position.

🏁 Repeat the same, and do not forget to place your trailing stop-loss orders just below the entry points.

The same is vice-versa when the market is in a downtrend and when we are going short. By following this, we have built a good amount of buying position with minimum risk involved. Also, as discussed, the key to successful Pyramiding is to maintain proper risk to reward in each of the trades. As a thumb rule, our risk must never be greater than half the potential reward.

Trading The Pyramid Strategy

Market Identification - Strong Uptrend or Downtrend.

The below price chart represents the AUD/CAD Forex pair, which is in a strong uptrend.

To understand the strategy better, let’s consider a $10,000 trading account. In this particular pair, we decided to buy two mini lots on a retest of each of the levels. The take-profit for each trade is varied as per the market conditions, but the stop-loss for each new position should not be more than 15 pips.

Market Entries

In the below chart, we can see the market broke through a resistance level. We have decided to buy 20,000 units right after the price took the broken resistance line as support. In a few hours, we have observed the price action blasting to the north and broke a new resistance level. The price again started to retest the level as new support.

At this point, we decided to buy 20,000 more units. You can see that the buy order 2 in the below chart indicates the second trade, and we have trailed the stop-loss below the second position. We found the trend to be super strong still, so we let this trade to run for the deeper targets.

On the 5th of February, the price again broke through a new resistance level and retests as a support area. By seeing the uptrend’s strength, we have bought another 20,000 units and placed the trailing stop-loss order just below the third position.

We did a lot of buying up until this point and built 80,000 units in one single pair. So the real question by the end of the third position is how much of our money is at risk? Nothing. The worst-case scenario would be us making 10% profit by the end of the third position.

Final Trade Set-Up

In the above chart, we can see the final trade setup of all the three trades we took. By the end of all the three trades, we made a profit of 28 percent. The profits on each of the trades have compounded throughout the process, where the risk in each trade remains the same. Overall, we have generated 12R, 10R, and 6R in the first second and third trades, respectively.

Conclusion

Never forget that the pyramid strategy works very well only in the trending markets. Also, try to avoid using this strategy in volatile markets. Pyramiding is a great way to compound our profits in a winning trade. Knowing when to use and when not to use the pyramid strategy is the crux here. Hence it is advisable to read the different market situations on a demo account first before using this strategy on a live account.

Categories
Forex Basic Strategies

Identifying And Trading The Bullish & Bearish ‘Crab’ Pattern

Introduction

We have learned the importance of harmonic patterns in our recent Forex strategy articles. Also, we have understood how to identify and trade many of the famous harmonic patterns like Butterfly, Bat, Gartley, etc. In this article, let’s explore one last pattern in the harmonic group – the Crab pattern.

H.M Gartley introduced the Crab pattern in 2001, and Scott Carney added the respective Fib ratios to it. Just like the other harmonic patterns, the ‘Crab’ is also a reversal pattern that is used to identify when the trend of an asset is going to end and potentially reverse. There are both bullish and bearish Crab patterns, and they indicate bullish and bearish reversals in the market, respectively.

Each leg of the Crab pattern is denoted by a letter, and in total, there are five swing points – X, A, B, C, and D. Just like other harmonic patterns, there are different rules to trade the Crab pattern. Only trade this pattern and take positions if all of these rules get validated.

Crab Pattern Rules

XA – In its bearish version, the first leg of the pattern forms when the price of an underlying asset decline sharply from point X to point A. It can be any random bearish move. (vice-versa in the case of bullish)

AB – The AB leg is the counter-trend move to the previous leg and must retrace from the 38.2% to 61.8% of the distance covered by the first leg.

BC – Concerning the BC leg, price action changes its direction and goes down to 38.2% or 88.6% Fibs ratio of the AB leg.

CD – The CD move is the last and most important leg of the Crab pattern. So for printing this leg, the price action again changes its direction and goes to counter-trend to XA. The CD leg reverses between the 161.8% of the XA leg.

To identify the Crab pattern, one must follow all the above rules. Take a long or short position at point D as this is where the Crab pattern completes. Below is the pictographic representation of bullish and bearish crab patterns.

Crab Pattern – Trading Strategies 

Trading The Bullish Crab Pattern

The Crab pattern is quite popular in the market, so the respective tool with embedded Fib ratios is widely available in most of the trading platforms. The images we are using in this article are taken from the TradingView tool. If you are also someone who uses TradingView software, you can find this pattern’s charting tool on a toolbar on the left side.

So, first of all, select the Crab pattern charting tool and follow all the above rules to identify the pattern. Keep in mind that the Fibonacci ratios are incredibly crucial to trade the Crab pattern. If you recognize the pattern on a price chart and if you find the Fibs ratios not matching with the pattern rules, it means that the pattern is invalid. So do not trade that pattern.

Identifying The Pattern

The below image is a four-hour chart of the GBP/USD Forex pair. Overall the market was in a downtrend, but when all the rules of the Crab pattern are met, price action changes direction. As you can see below, XA is any random bullish move. The price action then retraces to 61.8% of the AB leg. Furthermore, the price action goes up again and retraces close to the 38.2% Fib level of the AB leg.

At this stage, price action confirms the three moves of the pattern following all the rules. In the end, the last move of the pattern clears that the Crab pattern was genuine. This move of the pattern is the longest one, and it has reached the 161.8% Fib level of the AB leg.

Entry, Stop-Loss & Take-Profit

As the price action confirms the pattern, we have immediately entered for a buy. If you are a conservative trader, make sure to wait for a couple of bullish confirmation candles to enter the trade.

We have four targets (X, B, C, A) to place the take-profit order in the crab pattern. In the beginning, we planned to book full profit at point A, but when the price crosses point B, the market turned sideways. So we have booked half of our profit at point B and then closed our full positions at point A.

We have seen most of the traders placing their stop-loss way below point D. However, that’s a wrong way to do it because they are risking more because of this simple logic – If the price action breaks point D, it automatically invalidates the pattern. Makes sense? In the above image, we can see that we have placed the stop-loss just below the D point, and overall, it was an 8R trade.

Trading The Bearish Crab Pattern

The below Daily chart represents the EUR/USD Forex pair. We have identified the bearish Crab pattern and plotted the Fib ratios on to the chart. As you can see, the market was in an uptrend. The first leg, which is XA, can be considered as a random bearish move. The AB bullish move reached close to the 38.2% of the XA leg. The third leg, BC, goes in the counter direction and retraces to the 88.6% Fib level of the AB move. The last leg is crucial because our decision making depends on this move alone. We can see the last candle reaching close to the 161.8% level of the AB leg, and this confirms the appearance of the bearish Crab pattern.

Entry, Stop-Loss & Take-Profit

We immediately went short in this Forex pair as soon as the final leg of the pattern closed. For some traders, it might be challenging to take a trade on the face of strong buyers. But when the market follows all the rules of the pattern, you can confidently pull the gun. Furthermore, the bearish candles increase the chance of trade working in our favor. Conservative traders can wait for these confirmations and then take the trade. In the end, price rolls over, and prints a brand new lower low.

We have followed the same rules of risk management as we have done with a bullish Crab pattern. However, we were being optimistic and placed the take-profit order at the higher timeframe’s major resistance area. If the market had started moving sideways, we would have booked our profits either at B or C or A. Stop-loss is placed just above point D, as discussed before.

Conclusion

The Crab patterns appear less frequently compared to other harmonic patterns in the market. But when it does, it often provides a high risk to reward ratio trades. If you are new to this pattern, you need a bit of experience and skill set to identify and trade this pattern on the price chart. Once you master this pattern, new trading opportunities will emerge, which can exponentially grow your trading account. In the end, trade the bearish Crab only when it appears in an uptrend, and trade the bullish Crab only when it appears in a downtrend. Only then the odds of your trades performing increase.

We hope you find this educational article informative. If you have any queries, please let us know in the comments below. Cheers.

Categories
Forex Basic Strategies

Identifying & Trading The Bullish & Bearish Gartley Pattern

Introduction

We have discussed three of the most used Harmonic patterns in the previous strategy articles, and they are AB=CD, Butterfly, and Bat patterns. In today’s article, let’s learn how to trade one of the oldest Harmonic patterns – The Gartley. Trading harmonic patterns is one of the most challenging ways to trade but equally rewarding. There are traders across the world who highly believe in these patterns because of their accuracy in identifying trading signals, and the high RRR trades they offer.

The Gartley is one of the most commonly used harmonic patterns as it works very well on all the timeframes. IT is also one such pattern that frequently appears on the price charts. H.M Gartley introduced this pattern in his book ‘Profits in the Stock Market’ in the year 1935.

This pattern is also known as the Gartley 222 pattern because H.M Gartley introduced this pattern in the 222nd page of his book. There are both bearish and bullish Gartley patterns, and they appear depending on the underlying trend of the market. The Gartley pattern is made up of 5 pivot points; let’s see what these points are in the below section.

5 Pivot Points of The Garley Pattern

Just like other harmonic patterns, H.M Gartley used five letters to distinguish the five separate moves and impulses of the Gartley pattern.

  • The letter X represents the start of the trend.
  • The letter A represents the end of the trend.
  • The letter B represents the first pullback of the trend.
  • The letter C represents the pullback of the pullback.
  • The letter D represents the target of the letter C.

Gartley Pattern Rules

‘X-A’ – This is the very first move of the pattern. The wave XA doesn’t fit any criteria, so it is nothing but a bullish or bearish move in the market.

‘A-B’ – The Second move AB should approximately be at the 61.8% level of the first XA move. So if the XA move is bearish, the AB move should reverse the price action and reach the 61.8% Fib retracement level of the XA.

‘B-C’ – The goal of the BC move is to reverse the AB move. Also, the BC move should end either at 88.6% or 38.2% Fibonacci retracement level of XA.

‘C-D’ – The CD move is the reversal of the BC move. So if the BC move is 38.2% of the AB, CD move should respond at 127.2% level of BC. If BC move is at the 88.6% level of the AB move, the CD move should be at the 161.8% Fib extension level of BC.

‘A-D’ – This is the last but most crucial move of the Gartley pattern. Once the CD move is over, the next step is to measure the AD move. The Last AD move will show us the validity of the Gartley Pattern on the price chart. The pattern is said to be valid if this move takes a retracement approximately at the 78.6% Fib level of the XA move.

Below is the pictographic representation of the Gartley Pattern

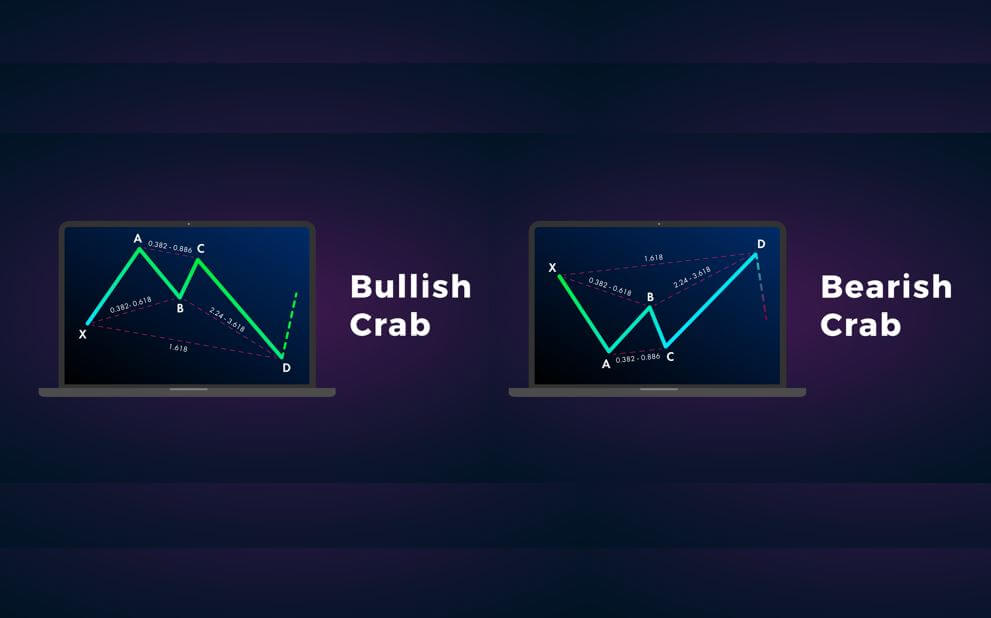
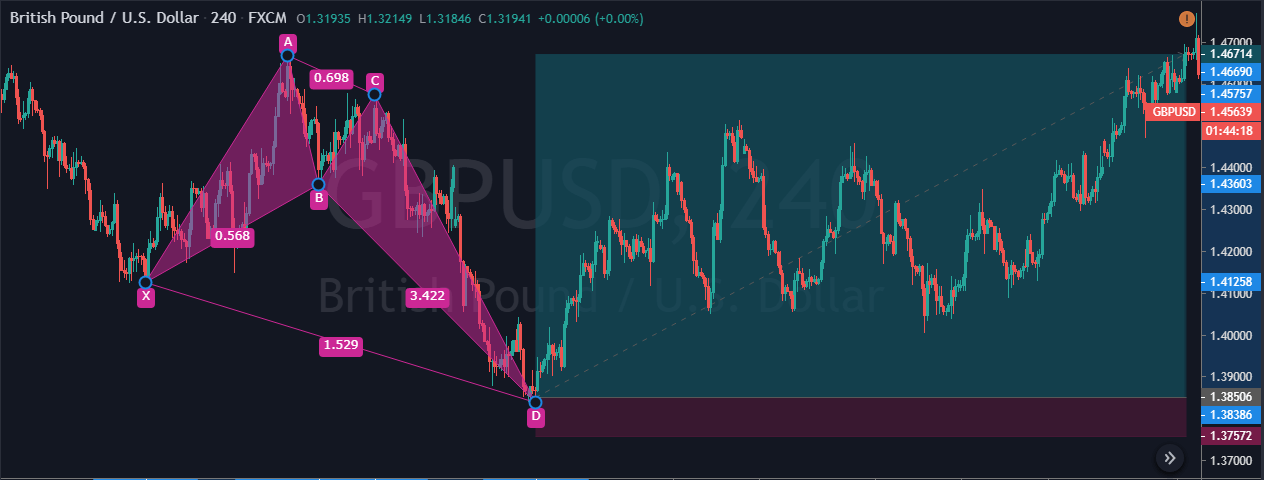
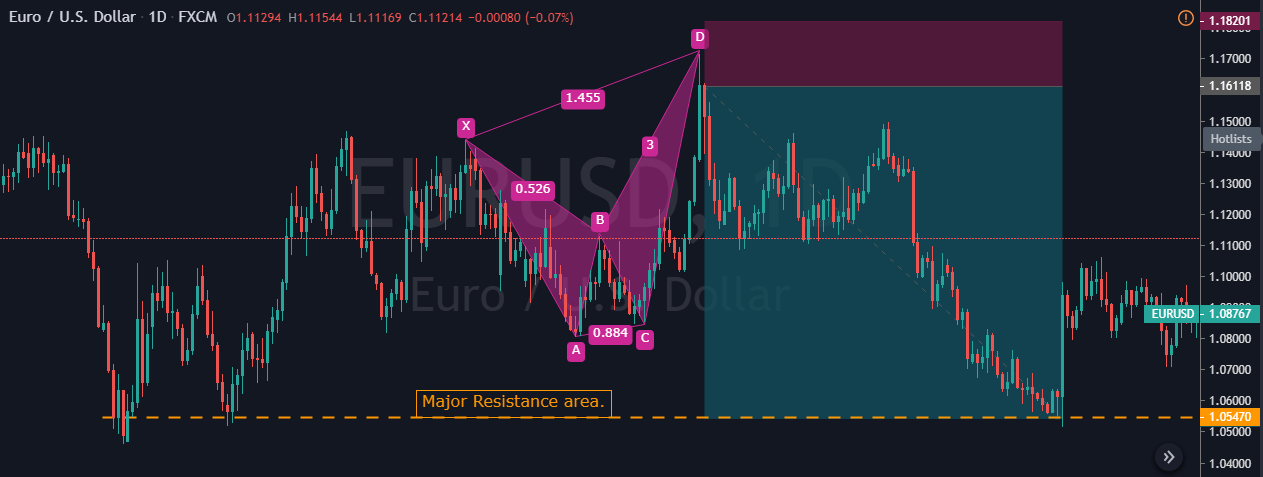
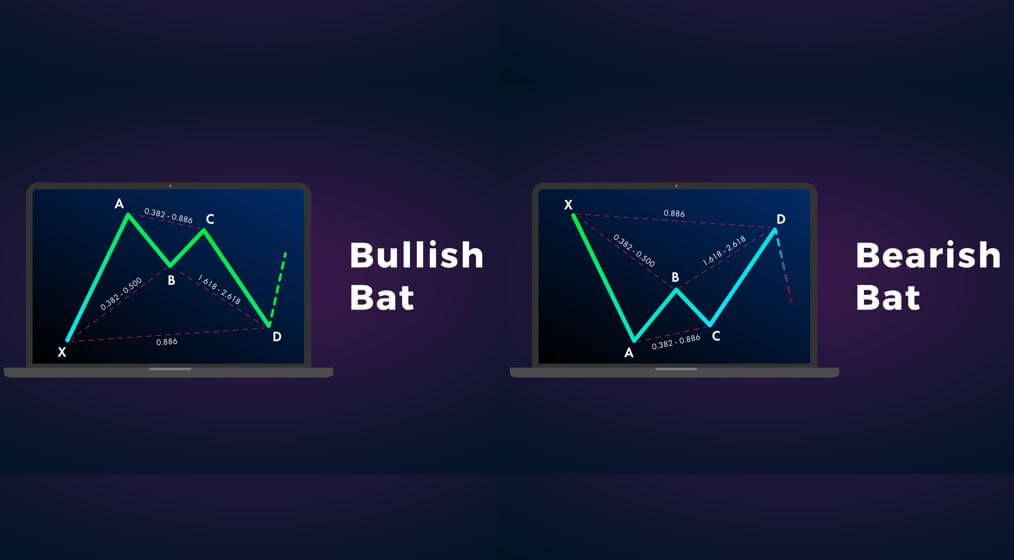
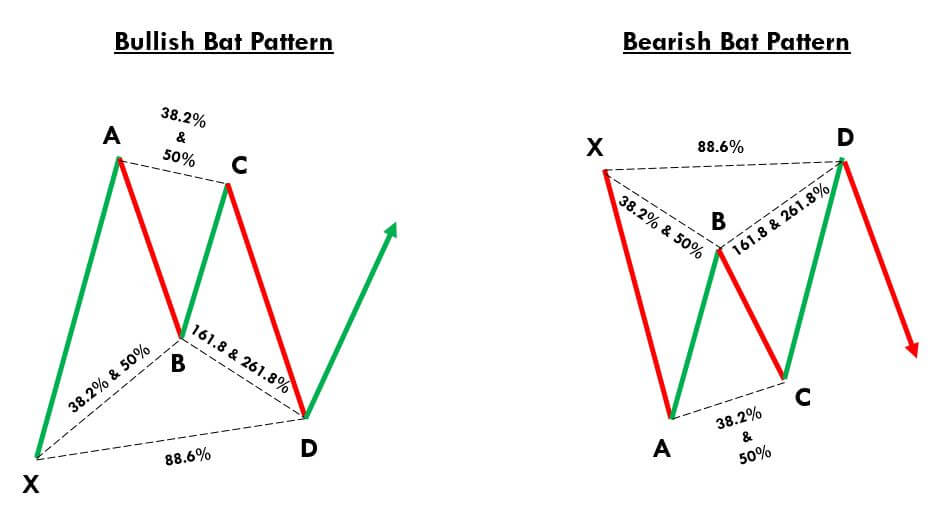
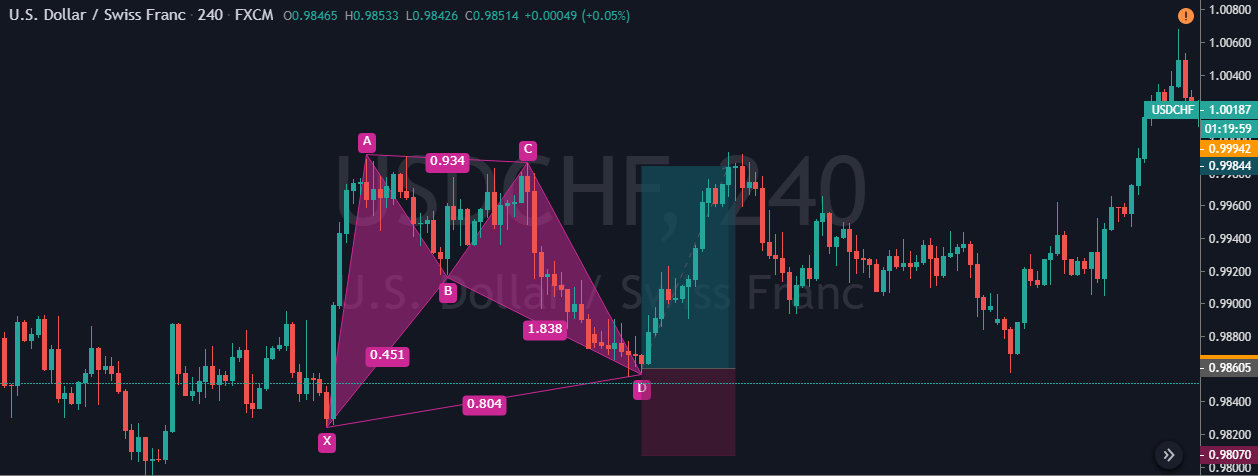
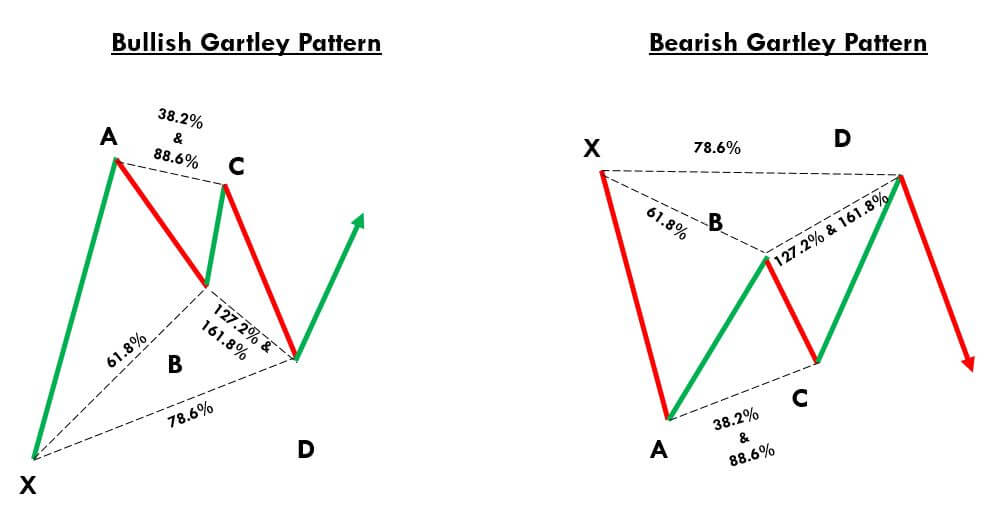
 Gartley Pattern Trading Strategy 

Trading The Bullish Gartley Pattern

In the below NZD/USD weekly chart, we can see that the market is in a clear uptrend. We have then found the swing high and swing low, which is marked by the point X & Point A. We then have four swing-high & swing-low points on the price chart that binds together to form the Gartley harmonic pattern.

Always remember that every swing high and low must validate the Fibs ratios of the Gartley pattern. These levels can be approximate as we can never trade the market if we keep waiting for the perfect set-up. There are indicators out there where the Fibonacci levels are present in them by default. We generally use TradingView, and in this charting software, the below-used indicator can be found in the toolbox, which is present on the left-hand side.

Please refer to the marked region in the chart below. The first XA leg is formed just like a random bullish move in the market. The second AB move is a bearish retracement, and it is at the 61.8% Fib level of the XA move. Furthermore, the BC is a bullish move again, and it follows the 88.6% Fib level of the AB move. The CD leg is the last bearish move, and it is respecting the 161.8% Fib level of BC.

Now we have identified the bullish Gartley pattern on the price chart. We can take our long positions as soon as the CD move ends at the 161.8% level. The next and most crucial step of our strategy is to find the potential placement of our stop-loss. The ideal region to place the stop-loss is just below point X. If the price action breaks the point X, it automatically invalidates the Gartley pattern.

However, stop-loss placement depends on what kind of trader you are. Some aggressive traders place stop-losses just below the entry while some use wider stops. We suggest you follow the rules of the strategy and use point X as an ideal stop-loss placement.

B, C & A points can be considered as ideal areas for taking your profits. We suggest you go for higher targets in the case of the formation of a perfect Gartley pattern. Overall, placing a ‘take-profit‘ order depends on your previous trading experience also. Because, if you come across any ideal candlestick patterns in your favor while your trade is performing, you can extend your profits. We can also combine this pattern with other reliable technical indicators to load more positions in our trades.

Trading The Bearish Gartley Pattern

Below is the EUR/GBP four-hour chart in which we have identified the bearish Gartley pattern. In the highlighted region, we can see the formation of the bearish XA leg like a random bearish move. The second leg is AB – a bullish retracement stopping at the 61.8% level of the XA move. Furthermore, the BC move is bearish again, and it respects the 88.6% Fibs level of the AB move. CD is the final bullish move, and it is respecting the 161.8% Fibs level of BC.

As soon as the price action completes the CD move, we can be assured that the Gartley pattern is formed on our price chart. We can also see the formation of a Red confirmation candle indicating us to go short in this Forex pair. We have taken our short positions at point D and placed our stop-loss just above point X.

We have three targets in total, and they are points B, C, and A. Within a few hours, the price action hits the B point, which was our first target. Moreover, the price pulled back at point C, but we were safe in our trade as our stop-loss was placed above point X. Our final target was at point A, which is achieved within four days.

Conclusion

The Gartley pattern is wholly based on mathematical formulas and Fibonacci ratios. Remember to take the trades only when all the mentioned Fib levels are respected. If you have no experience with harmonic patterns, you must master this pattern on a demo account first and then use them on the live markets. We are saying this because it requires a lot of patience and practice to identify and trade these patterns.

We hope you understood how to identify and trade the Gartley Harmonic Pattern. If you have any questions, let us know in the comments below. Cheers!

Categories
Forex Basic Strategies

Trading The Bullish & Bearish Bat Pattern Like A Pro

Introduction

We have learned the importance of Harmonic patterns in our previous articles. We also understood a couple of interesting harmonic patterns – The Butterfly & AB=CD. In this article, let’s understand what a ‘Bat’ pattern is, and how to make money trading this pattern. The Bat pattern is a part of the Harmonic group, and ‘Scott Carney’ discovered this pattern in the year 2001. Out of all the patterns present in the harmonic group, Bat pattern has the highest accuracy. This pattern can be extremely profitable when traded correctly.

It works very well on all the timeframes but try not to trade it in smaller timeframes because the price in these timeframes tends to reverse quickly. The Bat pattern comes in both bullish and bearish variations and is made up of five swing points X, A, B, C, and D. In a downtrend, the appearance of a bullish Bat pattern indicates a bullish reversal. In an uptrend, the appearance of a bearish Bat pattern indicates a bearish reversal.

One of the critical characteristics of the Bat pattern is the power, speed, and strength of the reversal that occurs after the appearance of this pattern on the price chart. Fibonacci ratios are the core strength of any harmonic pattern, and thanks to the advanced technology for providing the Fibs ratios to the Bat pattern to increase its accuracy.

Bat Pattern Rules

Just like most of the harmonic patterns, the Bat pattern is a four-leg reversal pattern that follows specific Fib ratios. A proper Bat pattern needs to fulfill the below criteria.

‘X-A’ – In its bullish form, the first XA move of the Bat pattern could be any random upward move on the price chart.

‘A-B’ – For a Bat pattern to get validated, the AB leg’s minimum retracement should be 38.2% of XA leg or maximum of 50% Fib levels. Scott Carney suggests that the retracement at 50% Fibs levels increase the accuracy of the signal generated.

‘B-C’ – The BC move can retrace up to a minimum of 38.2% Fib level of AB and a maximum of 88.6%.

‘C-D’ – CD is the last move that confirms the Bat pattern. This move should be at 88.6% Fibs retracement of XA leg, or it should be between 161.8% or 261.8% Fibs extension of the AB leg.

For a bearish Bat pattern, point X should be at a significant high. Conversely, for a bullish Bat pattern, point X should be at a significant low.

Below is the pictographic representation of the Bat Harmonic Chart Pattern.

Bat Pattern Trading Strategy

Trading The Bullish Bat Pattern

In the below USD/CHF four hours chart, we can see the formation of a bullish Bat pattern. These days, on most of the trading platforms, we can find all the harmonic tools which are combined with Fib levels. These tools get extremely handy when we need to quickly confirm the pattern. We use TradingView charts, and the harmonic pattern tool can be found in the left-side toolbar.

Coming to the strategy, our starting point X was at 0.9840 from where the move has started. The price action started to counter the trend from 0.9984. Let’s consider this as our point A, and the XA is nothing but a random bullish move in the market. Now we located our first swing high, so the next step is to count the market wave movement. The AB move retraces at 38.2% of the XA move, and the BC move goes up again and retraces at 88.6% of AB. Furthermore, the market prints the last move of the pattern, which is at 88.6% level of the XA move. So now we have got all the four touch patterns for a bullish Bat pattern on the price chart.

While back-testing, we found the market blasting to the north whenever the CD move finishes at 88.6% level. This is the reason why we took the buy entry as soon as the price-action completes the CD move. Overall it was an excellent risk-reward ratio trade. Also, when the CD move touches the 88.6% Fib level, it always provides a decent risk-reward ratio. The stop-loss is placed below the ‘X,’ and take-profit can either be placed at A or C points.

Trading The Bearish Bat Pattern

Both the bearish and bullish Bat patterns have the same rules. The only difference is that it appears inversely. So in this strategy, let’s trade the bearish Bat pattern with at most accuracy.

In the below NZD/USD daily chart, we have identified a bearish Bat pattern. The very first move has started from point X and ends at point A. This can be considered as a random bearish move. The price action has then reversed back and retraced at 38.2% level of the XA move forming the AB move. The market then goes into the counter direction and forms a BC leg, which is also retraced at 38.2% Fib level of the AB leg. The last leg was the CD move, and it finished close to the 88.6% Fibs level.

These swing highs and lows confirm the formation of a bearish Bat pattern on the price chart. So when the price action prints a bearish confirmation candle, we went short in this pair. Scott Carney described the points B, C and A as the first, second, and third target respectively. We can book profit at any of these points, or we can hold for deeper targets depending on the market situation.

In this particular trade, we didn’t book profits at B or C after seeing the momentum of the price. We were sure that the price could easily reach the last target. The price action did hold at point C for a longer time, which indicates that this trade might not work. Any armature trader would have panicked and closed their trades at breakeven.

But, as mentioned, whenever an ‘almost perfect’ Bat pattern is formed, the trade will definitely work. We must be patient and confident enough to stick to the strategy. Stop-loss placement is crucial, and one thumb rule while trading harmonic patterns is to place the stop-loss just below point X.

Conclusion

In short, harmonic patterns imply that the trends can be subdivided into smaller or larger waves using which the future price direction can be predicted. These harmonic patterns only work if the fibs ratios are aligned with the pattern. Some traders do not believe the authenticity of harmonic patterns, but we assure you that you can trade these patterns confidently. This ends the discussion on the Bat pattern. Remember that this pattern provides accurate entries as well as good RRR trades compared to other harmonic patterns. In the upcoming articles, let’s discuss Gartley and Crab patterns, which are equally important to learn.

We hope you find this article informative. In case of any questions, please let us know in the comments below. Cheers!

Categories
Forex Basic Strategies

Trading The Bullish & Bearish ‘Cup and Handle’ Pattern

Introduction

The patterns on the Forex charts occur when the price movement of an underlying asset is in the form of the shapes that we come across in daily life. These are visual patterns, and they provide a logical entry point along with appropriate stop-loss and take-profit order placements. The Cup and Handle is one such pattern; this is one of the oldest chart pattern identified by technical trading experts back in the late 20th century. This pattern is very reliable and very commonly used by traders across the world.

American trader and author ‘William J. O’ Neil’ defined the Cup and Handle pattern in his 1988 classic, “How to Make Money in Stocks.” This pattern occurs in all the types of the markets and is not confined to Forex or Stocks. We can also find this pattern in almost all of the timeframe. Most traders prefer trading this pattern on a higher timeframe. Having said that, this pattern produces reliable trading signals on the lower timeframes as well.

The Cup and Handle is a continuation pattern that occurs after the ongoing bearish or bullish trend. In an uptrend, when the price action reaches a peak point, if there is a price wave down, followed by a rally (approx. the same size of the wave down), this pattern is formed. It means that the price action has created a U-Shape or the Cup, and the Handle is for the confirmation and entering the trade. After the Cup, most of the time, price action turns sideways, or it drifts downwards that appear in the form of a handle on the price chart.

According to market situations, the Handle takes different forms. It prints in the form of a triangle, rectangle, or even congestion. The critical point for the Handle is that its extension shouldn’t be smaller than the Cup. The Handle should not even drop into the lower half of the Cup. For instance, if a cup forms between 0.1000 and 0.1100, the Handle must not go below 0.1050. Identifying the Cup and Handle pattern on the price charts is easy compared to the other patterns that we have discussed until now.

The Cup And Handle Pattern – Trading Strategy

Buy Example

The below image represents the formation of a Cup and Handle pattern on the EUR/USD 15 minute chart. The highlighted part in the below chart is the Handle, and we can see the Cup on to its left.


There are many different ways to enter a trade using this pattern. In this particular example, let’s learn the most common way, which is the breakout method. A lot of advanced traders prefer trading the breakouts as they are reliable and work pretty well with the Cup and Handle pattern as well.

In the above chart, we can see that we had entered the market by placing a buy order when the price broke the primary resistance line. Now we can see why breakout trading is very reliable while trading this pattern. Our take-profit order was at the major resistance area, and stop-loss was just below the Handle. Here, we have seen how to trade this pattern for intraday trading. However, if you are a swing trader who plans to hold your position for more extended targets, please check out the next example.

Sell Example

In the below NZD/CAD 15 min Forex chart, we can observe the formation of an inverted Cup and Handle pattern.

Right after the formation of the Cup, the price moved in sideways and resulted in a handle-like structure. After struggling a bit, the price broke the support line and made a new lower low. We have taken the entry in this pair after the appearance of a bearish confirmation candle. Right after our entry, we can see the market dropping down and printing a new low.

As a basic rule, the stop-loss placement was just above the Handle, and we ride more extended targets in this pair. We closed all of our positions when the market had a hard time print a new lower low. If you are a trader who likes to ride deeper targets, close your position when you see a consolidation. The reason is that a consolidation phase implies that both the buyers and sellers are strong. So at that point, it is not easy for the price to print a brand new lower low.

Limitations Of The Cup and Handle Pattern

Everything strategy or a pattern will have some limitations to it, and the Cup and Handle pattern is no exception. Market experts believe that this pattern is unreliable to trade in an illiquid market. The depth of the Cup plays a significant role in the strategy to perform. If the depth of the Cup is more, it might generate false trading signals.

This pattern can be found quite often on a lower timeframe. Most of the time, on lower timeframes, the Cup forms without the Handle. So make sure to pair this pattern with other reliable indicators or price action techniques to filter out the false signals.

Bottom Line

William O’Neil spent 20 years to broaden his views towards various patterns and ways to trade them. The Cup and Handle pattern is one of the results of all that fantastic experience. His broader view allowed him to shift his attention from the classical trading patterns to wonderful patterns like these. Remember that you need to be at least a little better than the other traders out there to ace the market.

Hence it is important to have a different point of view that millions of traditional retail traders out there. The problem with the setup is that most of the traders use a similar approach to exit their positions. The way we showed you to close the positions when the market turns into consolidation is one such creative idea that we have to follow to have an edge. All the best!

Categories
Forex Basic Strategies

Identifying & Trading The Bull Trap Pattern In The Forex Market

Introduction

A Bull Trap is one of the unique patterns that can be found in the Forex market. This pattern is comprised of two highs were the second high is failing to hold higher, and as a result, prices push to the new low. Unlike most of the patterns, a Bull Trap pattern generates false buying signals and indicate us to be cautious when we identify this pattern on the price charts. Hence it is also known as a whipsaw pattern.

The up-move that happens trick the buyers & investors into making bullish trades as they look identical to a buy signal. But the signal is not real, and they end up generating losses on long positions. Traders must seek confirmation after the breakout so that they can filter out these false buying signals and escape the Bull Trap. Bear Trap is the opposite of the Bull Trap pattern, which occurs when sellers fail to hold the prices below the break down level.

Psychology Behind The Bull Trap Pattern

The markets will be in a downtrend printing brand new lower lows & lower highs continuously. The price action then hits the major resistance level and starts pulling back. When the pullback begins to struggle, some of the aggressive traders and investors tend to take their long positions. Then, suddenly, one strong candle breaks the resistance line with power.

At that stage of the market, emotions are on a peak point, so as a result, most of the traders take buy entries believing the breakout. The market then prints one red candle, and the price action respects the resistance level and starts to hold below the resistance level. At this point, most of the trader will be hoping for the market to go up, but the prices roll into the sell-side.

How Does The Bull Trap Occur?

Example 1

As we can see in the below 15-minute EUR/JPY Forex chart, price action hits the resistance line twice, but both the times it failed to break the line. However, the third-time, price action broke the major resistance line with power. This would have resulted in most of the traders taking their long positions. When the four small candles held above the resistance line, it gives extra confirmation to the traders to buy this currency pair, but that was just a trap by the sellers. After some time, the price action dropped back, and that would affect most of the traders’ emotions negatively.

This kind of situation is common, and sometimes novice traders tend to immediately jump to the opposite side. But for professional traders, their emotions never play a role in decision making. So never take the opposite trade if that is not a part of your plan. In the above chart, we shouldn’t be going short unless the second or third bearish candle is formed after the beginning of a downtrend.

Example 2

In the below EUR/GBP chart, the pair was in an overall downtrend. During the pullback phase, when price action reached the major resistance area, most of the amateur traders visually see that as a bullish market. Price action respects the resistance line twice, but on the 25th of Nov, when strong buyers broke the resistance line, it creates the illusion of a buy signal in this pair.

But the buyers failed to hold the price higher, and the very next candle pushed the price below the resistance line. When the price broke the resistance line, amateur traders activate their buy trades. Still, technical traders will always wait for the prices to hold above the resistance line and take the buy entry only after the confirmation. In this example, prices never held above the resistance line, so there was no trade buy trade for professional traders. On the other hand, inexperienced traders end up booking losses.

Trading The Bull Trap Pattern

In the above examples, we discussed how to identify the Bull Trap pattern. Now, let’s understand how to trade this pattern. In the below EUR/AUD Forex chart, the price action tried to break the resistance line twice, but both of the time buyers failed to perform. On the 3rd of Jan, buyers broke the resistance line with some strong power. After the break, inexperienced traders would have activated their buy positions. But always keep in mind that the breakout never confirms the buy entry. We should be keeping a close look at the price after the breakout and only trade once we get the confirmation.

As you can see in the above chart, after the breakout, many candles held above the resistance line. After watching close to fifteen candles, we can confirm that the resistance has turned to support. The hold after the breakout confirms that the sellers failed to take prices lower.

Entry, Stop-Loss & Take-Profit

When buyers held the prices above the resistance line for a while, it is a clear indication of a buy signal. So now we enter the market as soon as the confirmation is done. We have decided to go for a smaller stop-loss because the hold confirms that the sellers left the ground.

Our take-profit is at the higher timeframe resistance area. We can see the price dropping back right after our take-profit level as the price tested the resistance line. Interestingly, a bull trap pattern is formed again above our take-profit order. This is the ideal way to trade this pattern, and most of the professional traders follow the same. Patience is the key to trade the Forex market. If you are patient enough to follow all the rules of the game, you will win for sure.

Conclusion

Bull Trap occurs when the prices fail to hold above the breakout. It could happen for various reasons. Some of them are buyers not being interested in pushing the prices higher, or they might have been booking the profits. On the other hand, professional sellers might have jumped into the market to take sell trades. As a result, they end up dropping the prices below the resistance levels, which will eventually result in triggering the stop-loss orders of the trapped buyers.

The best way to identify the Bull Trap pattern is to analyze the momentum of the buyers in the Forex market. If the buyers fail to hold the prices above the breakout, do not take long positions and never let the emotions drive your decision making.

Categories
Forex Basic Strategies

Trading The ‘Symmetrical Triangle’ Chart Pattern Using SMA

Introduction

A Symmetrical Triangle is one of the most reliable chart patterns in the market. This pattern is characterized by converging two trend lines, which are drawn by connecting a series of peaks and troughs. The Symmetrical Triangle pattern is made up of price fluctuations where each swings high and swing low makes lower highs and higher lows. Essentially, the coiling movement of price action creates the structure of a Symmetrical Triangle. When the triangle is forming on the price chart, it indicates that neither the sellers nor the buyers are pushing the price far enough to create a clear uptrend or downtrend.

This pattern is also known as the ‘coil’ because, most of the time, it forms in a continuation phase. Symmetrical Triangle pattern consists of at least two lower highs and two lower lows. So when these points are connected, the lines converge, and the Symmetrical Triangle takes shape. A part of the trading community believes that if this pattern is formed in an uptrend, the price will break upward. Likewise, if the pattern forms in a downtrend, the price action will break downward. However, these are just assumptions and are not entirely true.

The reason for the formation of the Symmetrical Triangle on the price chart is because of the lack of volume and price movement in any underlying currency pair. This eventually results in the formation of a coiling pattern. Hence it is merely impossible to find out which side of the pattern will breakout.  The only way to trade this pattern is to let the breakout happen on any of the sides and take the trade only after confirmations.

Symmetrical Triangle Chart Pattern – Trading Strategies

Conventional Way – Buy Example

Step 1 - Identifying The Pattern

We can see the formation of a Symmetrical Triangle pattern in the below GBP/NZD Forex pair. We can observe the market coiling and not moving in any certain direction, which eventually resulted in this pattern.

Step 2 - Entry, Stop-Loss & Take-Profit

In the below chart, we had taken the entry when the price action broke the upper trend line. This pattern is pretty reliable but needs a lot of patience as the only way to trade is by stalking the charts. We can notice the market blasting to the north immediately after the breakout of the upper trend line. The stop-loss is placed just below the lower trend line, and the take-profit is placed at the higher timeframe’s resistance area.

Conventional Way – Sell Example

Step 1 - Identifying The Pattern

The formation of the Symmetrical Triangle pattern can be seen in the below AUD/JPY Forex pair. The market was in an overall downtrend, but from 28th – 30th January, it turned into a consolidation phase, which resulted in the formation of this pattern.

Step 2 - Entry, Stop-Loss & Take-Profit

However, on 30th Jan, the lower trend line was broken, indicating a sell signal in the AUD/JPY Forex pair. The entry can be right after the breakage of the lower trend line if you are an aggressive trader. But for conservative traders, it is recommended to watch for the bearish confirmation candles and then take the trade.

Here, we have gone for two targets. The first one was at the recent low, and the second target was a bit deeper, which is at the higher timeframe’s support area. If you are an intraday trader, then the TP1 is a good location for you to close your position. But if you are a swing trader, TP2 is the best match. Most of the time, the breakout trades do perform, and that is the reason for us to use the recent higher low as an appropriate stop-loss placement.

Symmetrical triangle + Simple Moving Average

In this strategy, we have paired the Symmetrical Triangle pattern with Simple Moving Average to identify accurate trading signals. SMA is a technical indicator used by almost every technical trader to identify the market trend. A smaller period average reacts more to the price action, whereas the larger period tends to respond less. If the SMA is below the price action, it means that the trend is up, and if it is above the price action, it indicates a bearish trend.

Step 1 - Identifying The Pattern & Plotting SMA On To The Price Chart

We can observe the formation of a Symmetrical triangle pattern on the EUR/NZD Forex chart.

Step 2 - Knowing What Not To Do

One of the most common ways of trading the Symmetrical Triangle and SMA is to let the price action go above or below the MA line to take an entry. But that approach is riskier, and let’s see why. In the below image, we have marked two circles where the MA generates both buy & sell signal. It is clear that the selling signal failed to perform, and the price action goes above the SMA. When the price broke the SMA, some traders might have taken buy entries, but that’s an immature way to trade this pattern. The reason for the formation of the Symmetrical Triangle is due to the lack of volume or price movement. So there is no way to know which side of this pattern will break.

Step 3 - Entry, Stop-Loss & Take-Profit

The correct way to trade the Symmetrical Triangle pattern is to use both of the trading tools in conjunction with each other. When the SMA goes below the price action, it confirms that the prices are more likely to break upside. When strong buyers break the Symmetrical Triangle with strong power, it’s a clear indication for us to go long. So we have entered the market right after the price broke above the upper trend line of the pattern.

If you are a confirmation trader, we recommend you wait for the price action to hold above the Symmetrical Triangle to take a ‘buy’ entry. For this particular strategy, we placed the stop-loss below the SMA, and take-profit was at the higher timeframe’s resistance area. After our entry, we can see the buyers blasting to the north, and we end up milking 100+ pips in this Forex pair.

Conclusion

The Symmetrical Triangle pattern is widely used among traders. The difficult part of trading this pattern is predicting the direction of the breakout. All we can do is to watch the charts until the breakout happens and anticipate the trade. The traditional way to book the profit is at the beginning of the triangle itself. However, we can use some other approaches such as higher timeframe’s S&R areas, supply-demand zones, or exiting the position when the market turns into a consolidation phase.

We hope you had a good read. Let us know if you have any questions in the comments below, and we would love to answer them. Happy Trading.