Categories
Forex Basic Strategies

Trading The Bullish & Bearish ‘Cup and Handle’ Pattern

Introduction

The patterns on the Forex charts occur when the price movement of an underlying asset is in the form of the shapes that we come across in daily life. These are visual patterns, and they provide a logical entry point along with appropriate stop-loss and take-profit order placements. The Cup and Handle is one such pattern; this is one of the oldest chart pattern identified by technical trading experts back in the late 20th century. This pattern is very reliable and very commonly used by traders across the world.

American trader and author ‘William J. O’ Neil’ defined the Cup and Handle pattern in his 1988 classic, “How to Make Money in Stocks.” This pattern occurs in all the types of the markets and is not confined to Forex or Stocks. We can also find this pattern in almost all of the timeframe. Most traders prefer trading this pattern on a higher timeframe. Having said that, this pattern produces reliable trading signals on the lower timeframes as well.

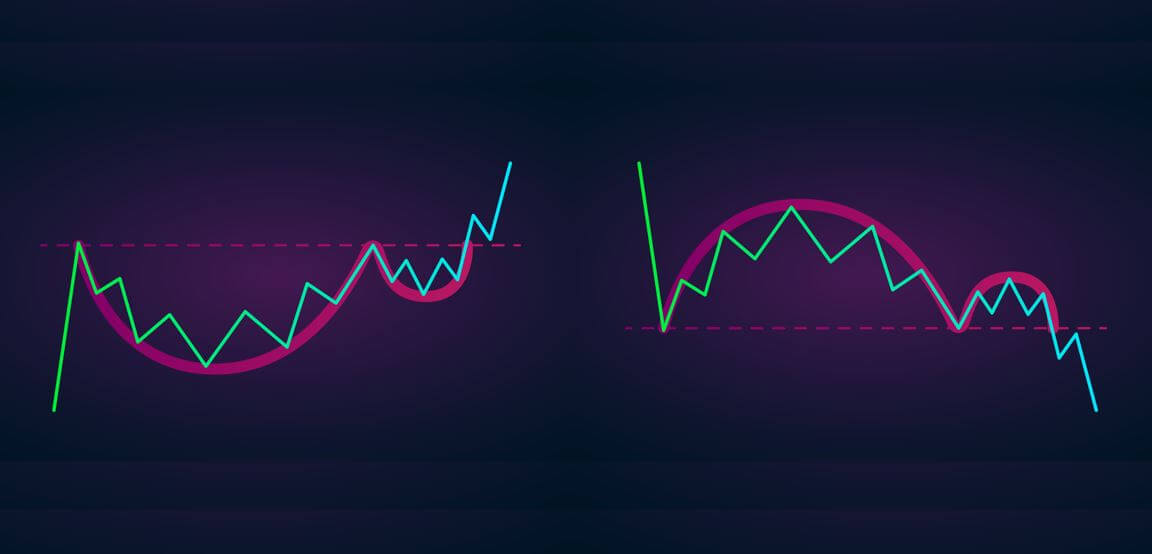
The Cup and Handle is a continuation pattern that occurs after the ongoing bearish or bullish trend. In an uptrend, when the price action reaches a peak point, if there is a price wave down, followed by a rally (approx. the same size of the wave down), this pattern is formed. It means that the price action has created a U-Shape or the Cup, and the Handle is for the confirmation and entering the trade. After the Cup, most of the time, price action turns sideways, or it drifts downwards that appear in the form of a handle on the price chart.

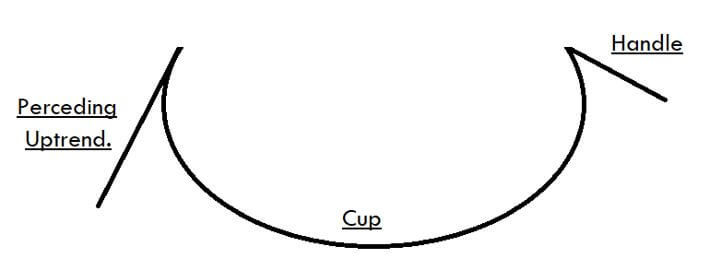
According to market situations, the Handle takes different forms. It prints in the form of a triangle, rectangle, or even congestion. The critical point for the Handle is that its extension shouldn’t be smaller than the Cup. The Handle should not even drop into the lower half of the Cup. For instance, if a cup forms between 0.1000 and 0.1100, the Handle must not go below 0.1050. Identifying the Cup and Handle pattern on the price charts is easy compared to the other patterns that we have discussed until now.

The Cup And Handle Pattern – Trading Strategy

Buy Example

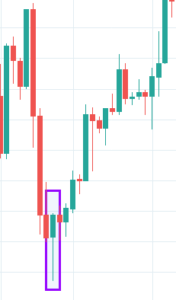
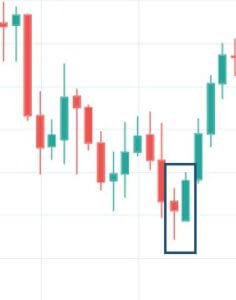
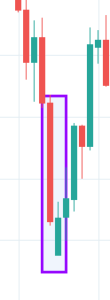
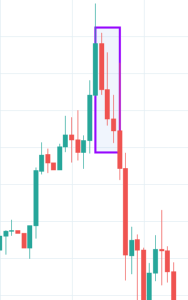
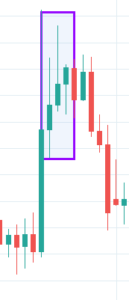
The below image represents the formation of a Cup and Handle pattern on the EUR/USD 15 minute chart. The highlighted part in the below chart is the Handle, and we can see the Cup on to its left.


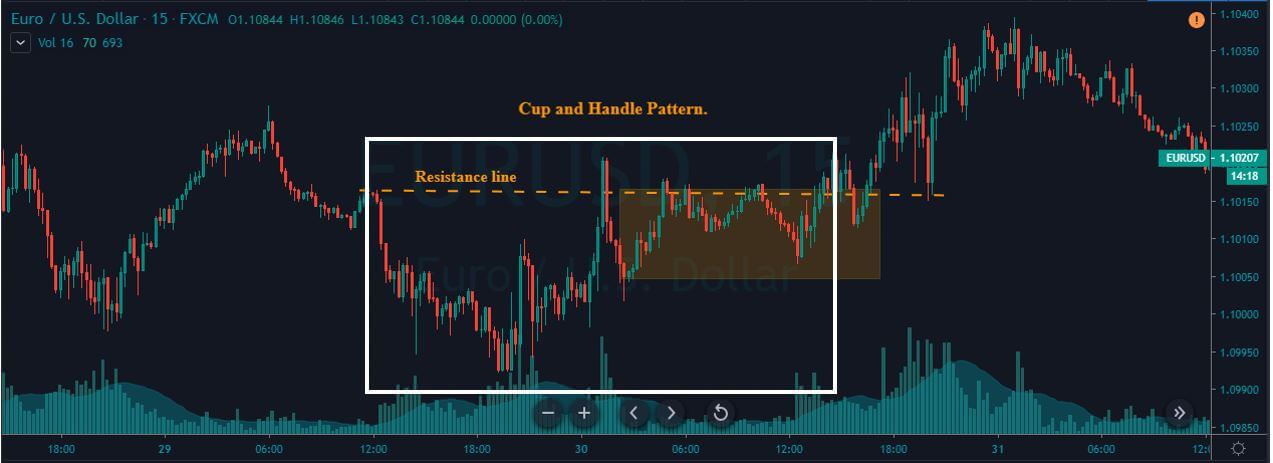
There are many different ways to enter a trade using this pattern. In this particular example, let’s learn the most common way, which is the breakout method. A lot of advanced traders prefer trading the breakouts as they are reliable and work pretty well with the Cup and Handle pattern as well.

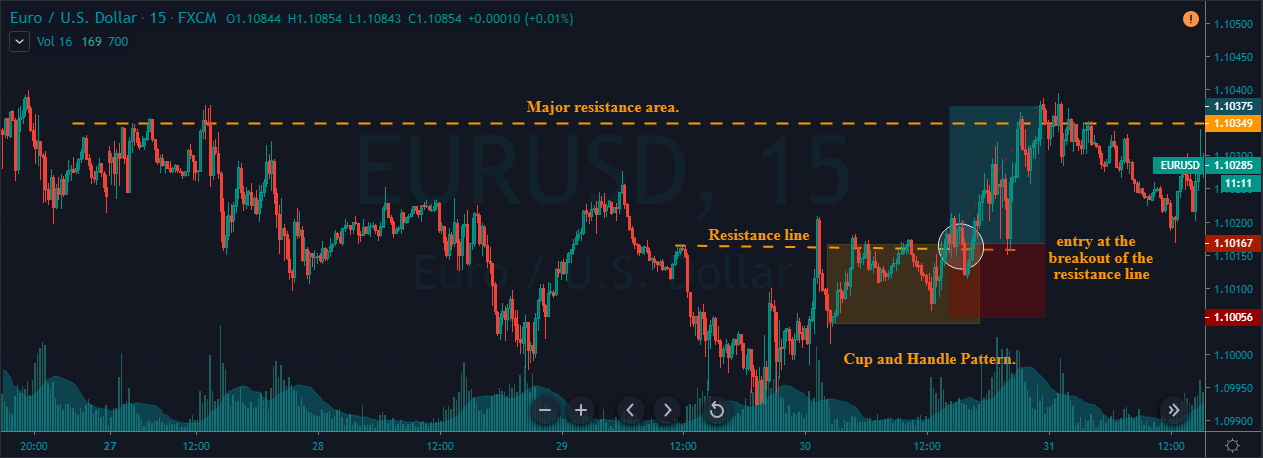
In the above chart, we can see that we had entered the market by placing a buy order when the price broke the primary resistance line. Now we can see why breakout trading is very reliable while trading this pattern. Our take-profit order was at the major resistance area, and stop-loss was just below the Handle. Here, we have seen how to trade this pattern for intraday trading. However, if you are a swing trader who plans to hold your position for more extended targets, please check out the next example.

Sell Example

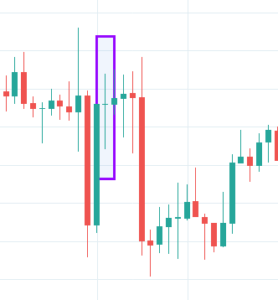
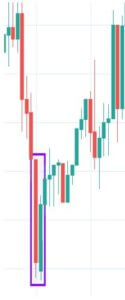
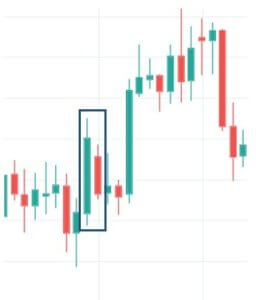
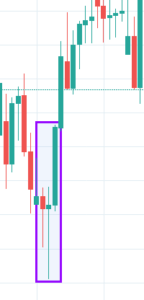
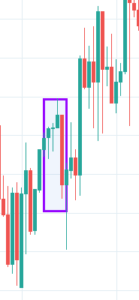
In the below NZD/CAD 15 min Forex chart, we can observe the formation of an inverted Cup and Handle pattern.

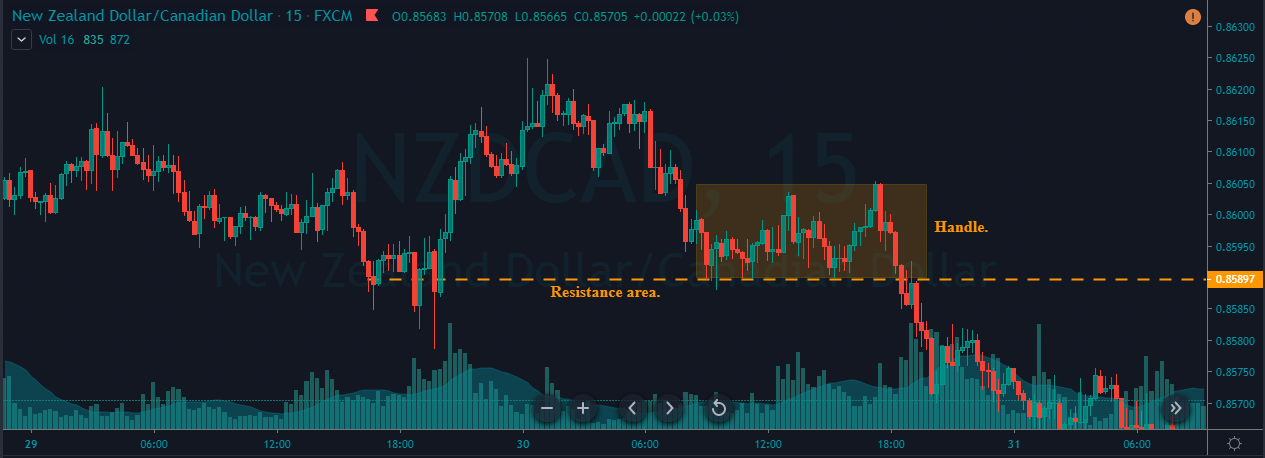
Right after the formation of the Cup, the price moved in sideways and resulted in a handle-like structure. After struggling a bit, the price broke the support line and made a new lower low. We have taken the entry in this pair after the appearance of a bearish confirmation candle. Right after our entry, we can see the market dropping down and printing a new low.

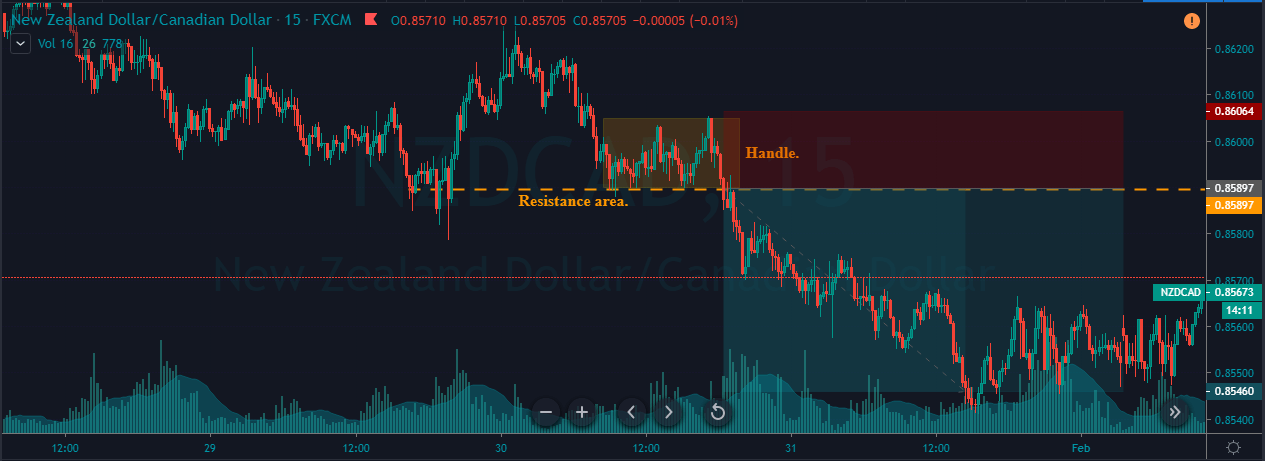
As a basic rule, the stop-loss placement was just above the Handle, and we ride more extended targets in this pair. We closed all of our positions when the market had a hard time print a new lower low. If you are a trader who likes to ride deeper targets, close your position when you see a consolidation. The reason is that a consolidation phase implies that both the buyers and sellers are strong. So at that point, it is not easy for the price to print a brand new lower low.

Limitations Of The Cup and Handle Pattern

Everything strategy or a pattern will have some limitations to it, and the Cup and Handle pattern is no exception. Market experts believe that this pattern is unreliable to trade in an illiquid market. The depth of the Cup plays a significant role in the strategy to perform. If the depth of the Cup is more, it might generate false trading signals.

This pattern can be found quite often on a lower timeframe. Most of the time, on lower timeframes, the Cup forms without the Handle. So make sure to pair this pattern with other reliable indicators or price action techniques to filter out the false signals.

Bottom Line

William O’Neil spent 20 years to broaden his views towards various patterns and ways to trade them. The Cup and Handle pattern is one of the results of all that fantastic experience. His broader view allowed him to shift his attention from the classical trading patterns to wonderful patterns like these. Remember that you need to be at least a little better than the other traders out there to ace the market.

Hence it is important to have a different point of view that millions of traditional retail traders out there. The problem with the setup is that most of the traders use a similar approach to exit their positions. The way we showed you to close the positions when the market turns into consolidation is one such creative idea that we have to follow to have an edge. All the best!

Categories
Forex Course

58. Exploring More Candlestick Patterns – Cheat Sheet!

Introduction

In the previous lessons, we have discussed many candlestick patterns out of which some were single, some were multi-candlestick patterns (Dual & Triple). But there are many more patterns that one needs to be aware of. Since it is not possible to cover each and every one of them, we have picked some of the most profitable and important patterns everyone should be aware of. So, this article basically acts as a cheat sheet for any reference. By referring to this guide, one can get the basic price-action structure of all these important patterns that are mentioned below.

Hammer Candlestick Pattern

It is a single candlestick pattern signaling a possible reversal to the upside. The Hammer is mostly seen after a prolonged downtrend. On the day this pattern is formed, the market will be inclined towards the sell-side. As the candle comes to a close, the market recovers and closes near the unchanged mark or maybe a bit higher.


That is a clear indication of the market reversal. We must take trades only after the appearance of a confirmation candle and not before. So we see a bullish candle on the charts immediately after the Hammer pattern, consider buying the currency pair.

Doji Candlestick Pattern

This pattern is formed from a single candle and is considered a neutral pattern. A Doji represents the equilibrium between demand and supply. The appearance of this pattern indicates a tug of war in which neither the bulls nor the bears are winning.


In the case of an uptrend, the bulls will be winning the battle, and the price goes higher, but after the appearance of Doji, the strength of the bulls is in doubt. The opposite is true in case of a downtrend. If we come across this pattern, we must wait for extra confirmation to take any action.

Piercing Candlestick Pattern

The Piercing Pattern is a two candle reversal pattern that implies a possible reversal from downtrend to an uptrend. This pattern is typically seen at the end of a downtrend. The second candle in the pattern must be bullish and should open below the low of the previous day and closing more than halfway into the previous day’s bearish candle.


We generally will have two options after noticing this pattern. Either we can buy the forex pair to benefit from the uptrend that is about to begin, or we can look at buying ‘options’ to reduce risk.

Engulfing Candlestick Pattern

It is two candle reversal pattern that is formed at the end of a downtrend or an uptrend. Bullish Engulfing Pattern is formed when a small ‘Red’ candlestick is followed by a large ‘Green’ candlestick that completely engulfs the previous day’s candle. For a Bearish Engulfing Pattern, the situation is vice-versa.


The shadows of the small candle should be preferably short, and the body of the large candle should overpower the entire previous day’s candle. When we come across a Bearish candlestick pattern, we must activate our sell trades and vice-versa.

Meeting Line Candlestick Pattern

This pattern is a two candle reversal pattern that occurs in a downtrend. The first candle must be a bearish candle followed by a second long bullish candle that gaps down and closes higher. It has the close at the same level as the close of the first candle.


This pattern only signals partial bullishness and buying strength, but not completely. Traders must look for other signs of reversal than just relying on the pattern stand-alone because just the Meeting Line pattern is not a clear confirmation for a complete reversal of the trend.

Harami Candlestick Pattern

It is a dual candlestick reversal pattern indicating the reversal of a bullish or bearish trend. In Bullish Harami pattern, the first candle is usually a Red candle with a large real body, and the second one is a small Green Candle. It’s opposite in the case of a bearish Harami pattern.        

Traders must look at the appearance of a bullish Harami pattern as a good sign of taking long positions in the market. Likewise, we must be shorting once we confirm the appearance of the bearish Harami Pattern.

Three Black Crows Candlestick Pattern

This pattern consists of three Red candles and predicts the reversal of an uptrend. It does not occur very frequently, but when it occurs, we can be sure that the market is going to reverse.


The first candle in this pattern is a long bearish candle that appears in a prevailing uptrend. The second and third are also approximately the same size and color, indicating that bears are firmly in control. This pattern is most useful for long-term traders, who take short positions and hold them for several weeks.

Abandoned Baby Candlestick Pattern

It is a three candle reversal pattern that occurs during a downtrend. The first candle in this pattern is a bearish one. The second candle is a Doji, which gaps down from the previous candle. The third candle is a long bullish candle and opens above the second candle.


We must take long positions only if the price breaks above the third bar in this pattern. Also, make sure to use a stop-limit order for additional risk management.

Deliberation Candlestick Pattern

The Deliberation is a three-line bearish reversal candlestick pattern that occurs during an uptrend. This pattern is comprised of three bullish candles. The first and second candles have significantly large bodies than the third one.


This pattern signals a bearish reversal of the current uptrend. The confirmation is usually a Red candle that overcomes the midpoint of the second candle’s body. We can take aggressive short positions in the currency pair right after we notice the confirmatory candle. This pattern is rarely seen on the price charts, but it does appear, it is highly rewarding.

Three Line Strike Candlestick Pattern

We have discussed single, dual, and triple candlestick patterns till now. Three Line Strike is the first four candlestick pattern, which signals the continuation of the current trend. This pattern can be found in both bullish and bearish markets, depending on the trend.

In an uptrend, the first, second, and third are bullish, and each candle needs to close above the previous candle. The fourth candle is bearish and closes below the open of the first candle. We can take long positions only after the trend is confirmed by technical indicators like RSI & MACD

Learning to recognize and interpret candlestick patterns is important for anyone who aspires to be a professional technical trader. Perfecting this skill will take time and practice. But once you master these patterns, you can trade with enough confidence as you will know how to read the market better.

That’s about candlestick patterns and how to trade them. In the upcoming lesson, we will see how to trade candlesticks using support and resistance levels. We hope you practice these patterns better and become a better trade. Kindly let us know if you have any questions in the comments below. Cheers.

[wp_quiz id=”61830″]
Categories
Forex Course

56. Learning The Triple Candlestick Patterns – Part 1 (Continuous)

Introduction

After acquiring a fair bit of knowledge about Single and Double candlesticks patterns, let’s now proceed and learn the Triple Candlestick Patterns. A Triple Candlestick Pattern, as the name clearly suggests, is formed by three candles. In the next couple of articles, we discuss two Continuation patterns and two Reversal patterns to understand how these patterns are formed. Also, most importantly, we will be learning how to trade these patterns as well. So in this article, we will be discussing the basic & well-known Continuous Triple Candlestick Patterns – Three White Soldiers and Falling Three Methods.

Three White Soldiers Candlestick Pattern

Three White Soldiers is a bullish triple candlestick pattern that predicts the reversal of the short term downtrend. The reversal of this short term trend leads to the continuation of the long term trend, and hence this pattern is classified as a continuation Pattern. This pattern consists of three long-bodied candles that open within the previous candle’s body and close above the previous candle’s high.

Below is how the Three White Soldiers candlestick pattern looks on the price chart

Criteria for the pattern

  1. The second and third candles should open within the body of the previous candle
  2. All three candles in the pattern should not have very long shadows.
  3. The continuation pattern is confirmed by other technical indicators such as the RSI and EMA.

Three White Soldiers pattern is used by traders for both entry and exit. Traders, who were short in the currency pair will look for exit and traders who were following the long term uptrend take a bullish position and enter the market.

Falling Three Methods

The Falling Three Methods is a major trend continuation pattern and is sometimes referred to as five candle patterns because of the confirmation candles at the first and fifth positions. These two long candles confirm the trend and its continuation. The sole of this pattern is the three counter-trend candlesticks in the middle. This pattern should never be considered as a reversal pattern; it is a clear trend continuation pattern.

Below is an image of how the pattern looks on the price chart

Criteria for the pattern

  1. The Falling Three Methods is a bearish continuation pattern with two long candlesticks in the direction of the main trend and three counter-trend candles in the middle of the two big bearish candles.
  2. The series of small-bodied candles should be of the same color. However, a bearish Doji as the third candle can also be considered.

This pattern is used by traders to initiate new short positions or add to an existing one. A trade is taken only after the fifth candle, which confirms that the trend is going to continue. There are also traders who use the 10-day moving average to confirm that the market is in a downtrend. While trading this pattern, one needs to make sure that this pattern is not at the key support level.

Conclusion

These are two famous triple candlestick trend continuation patterns. Make sure not to use these patterns stand-alone. They must be paired with other credible technical tools like indicators or chart patterns to confirm the authenticity of signals they generate. In the upcoming lesson, let’s look at some of the Reversal Triple Candlestick Patterns. Cheers!

[wp_quiz id=”61436″]
Categories
Forex Course

54. Learning The Dual Candlestick Patterns – Part 1 (Continuous)

Introduction

In the previous article, you were made familiar with different single candlesticks patterns that gave both continuous and reversal signals. In this article, we shall acquaint ourselves with the rest of the most popular double and triple candlestick patterns. In the following sections of the article, we will talk about the continuous double candlestick patterns – Tweezer Tops and Bottoms & Harami. Both of these candlestick patterns involve two candles, and they indicate signs of trend continuation in the market.

Tweezer Tops and Bottoms Candlestick Pattern

Tweezer patterns are double candlestick patterns that indicate a continuation of the current trend. But a broader context is needed to confirm the signal since Tweezers can occur frequently. A topping pattern occurs when the highs of two candlesticks occur at almost exactly the same level following a bullish candle. A bottoming pattern occurs when the lows of two candlesticks occur at almost exactly the same level following a decline in price.

The idea behind the topping and the bottoming pattern is that the first candle shows a strong move in the direction of the short term trend. While the second candle may be a pause or even a candle that completely reverses the previous day’s action. It means a short-term shift in momentum has occurred, and the price moved in the direction of the long term trend.

The image below shows how the pattern looks and explains the concept clearly.

Charts are taken from Tradingview

Pattern Confirmation Criteria

  • The first candle needs to have a large real body, i.e., the difference between open and close should be preferably big.
  • The second candle can be of any size. But if it is larger than the previous candle, the price can accelerate soon in the same direction.

Traders view this pattern as a potential sign of trend continuation and enter into a new position depending on the broader trend, with a minimum stop loss.

Harami Candlestick Pattern

Harami is a candlestick pattern that is formed by two candlesticks and indicates a continuation in the trend. Let’s discuss the Bullish Harami pattern to understand this concept better. A Bullish Harami Pattern essentially shows that the short term downtrend in an asset is coming to an end, and the market may continue its uptrend.

The pattern is formed by a long candlestick followed by a relatively smaller body. The second candle is completely contained within the vertical range of the previous body.

The chart below shows a Bullish Harami pattern. The few candles before the pattern indicate a short term downtrend in the currency, and the Green candle represents a slightly upward trend, which is wholly contained within the previous candle.

Charts are taken from Tradingview

Pattern Confirmation Criteria

  • It is necessary to have initial candles that indicate a clear short-term downtrend and that a bearish market is pushing the price lower.
  • The second candle needs to close near the middle of the previous candle, signaling a higher likelihood that a reversal of this downtrend will occur, and the price will move in the direction of the major uptrend.

Traders look at the appearance of the Bullish Harami pattern as a good sign of entering into a long position on an asset. This pattern is also combined with single candlestick patterns for confirmation signals. The opposite is the case for Bearish Candlestick Patterns.

While Tweezer Tops patterns are more flexible and easy to identify, Harami has a mandatory requirement of a ‘Doji’ (Candles with tiny body and long shadows) as the second candle. Both of these are trend continuation patterns with a high degree of accuracy. There are many more dual candlestick trend continuation patterns which you should be researching on your own. In the next lesson, we will be discussing double candlestick trend reversal patterns. Cheers!

[wp_quiz id=”60881″]