So far, the reversal formations we saw – the Piercing Pattern, the Dark Cloud Cover, and the Engulfing patterns, were strong reversal signals, showing that the bulls or bears had the control. The Harami is usually a less powerful signal.
The Harami is created when a short candle’s body is entirely contained inside the body of the preceding candle. The color of the second body of this pattern is unimportant, although the color of the first one follows the trend (black in downtrends and white in uptrends). The name “Harami” comes from the old Japanese word meaning “pregnant.” Japanese traders call the first candle, “the mother,” and the second one, “the baby.
The appearance of a Harami is indicative that the current trend has ended. According to Steve Nison, the Japanese say the presence of a Harami shows the market is losing its breath. They contend that, after a large healthy candle, the small inside candle shows uncertainty.
We have to say that if we look at the charts, harami-like formations appear often, but most of it was just pauses or pullbacks of the primary trend. Thus, although not good enough to call for a reversal of the trend, they could be potential signals to exit a trade or take partial profits.
Also, we have to remember that, since trading the Forex markets, and, also, intraday, there are no gaps available. This fact makes a harami quite similar to a Piercing pattern or a Dark cloud Cover if the body of the second candle surpasses half of the previous body.
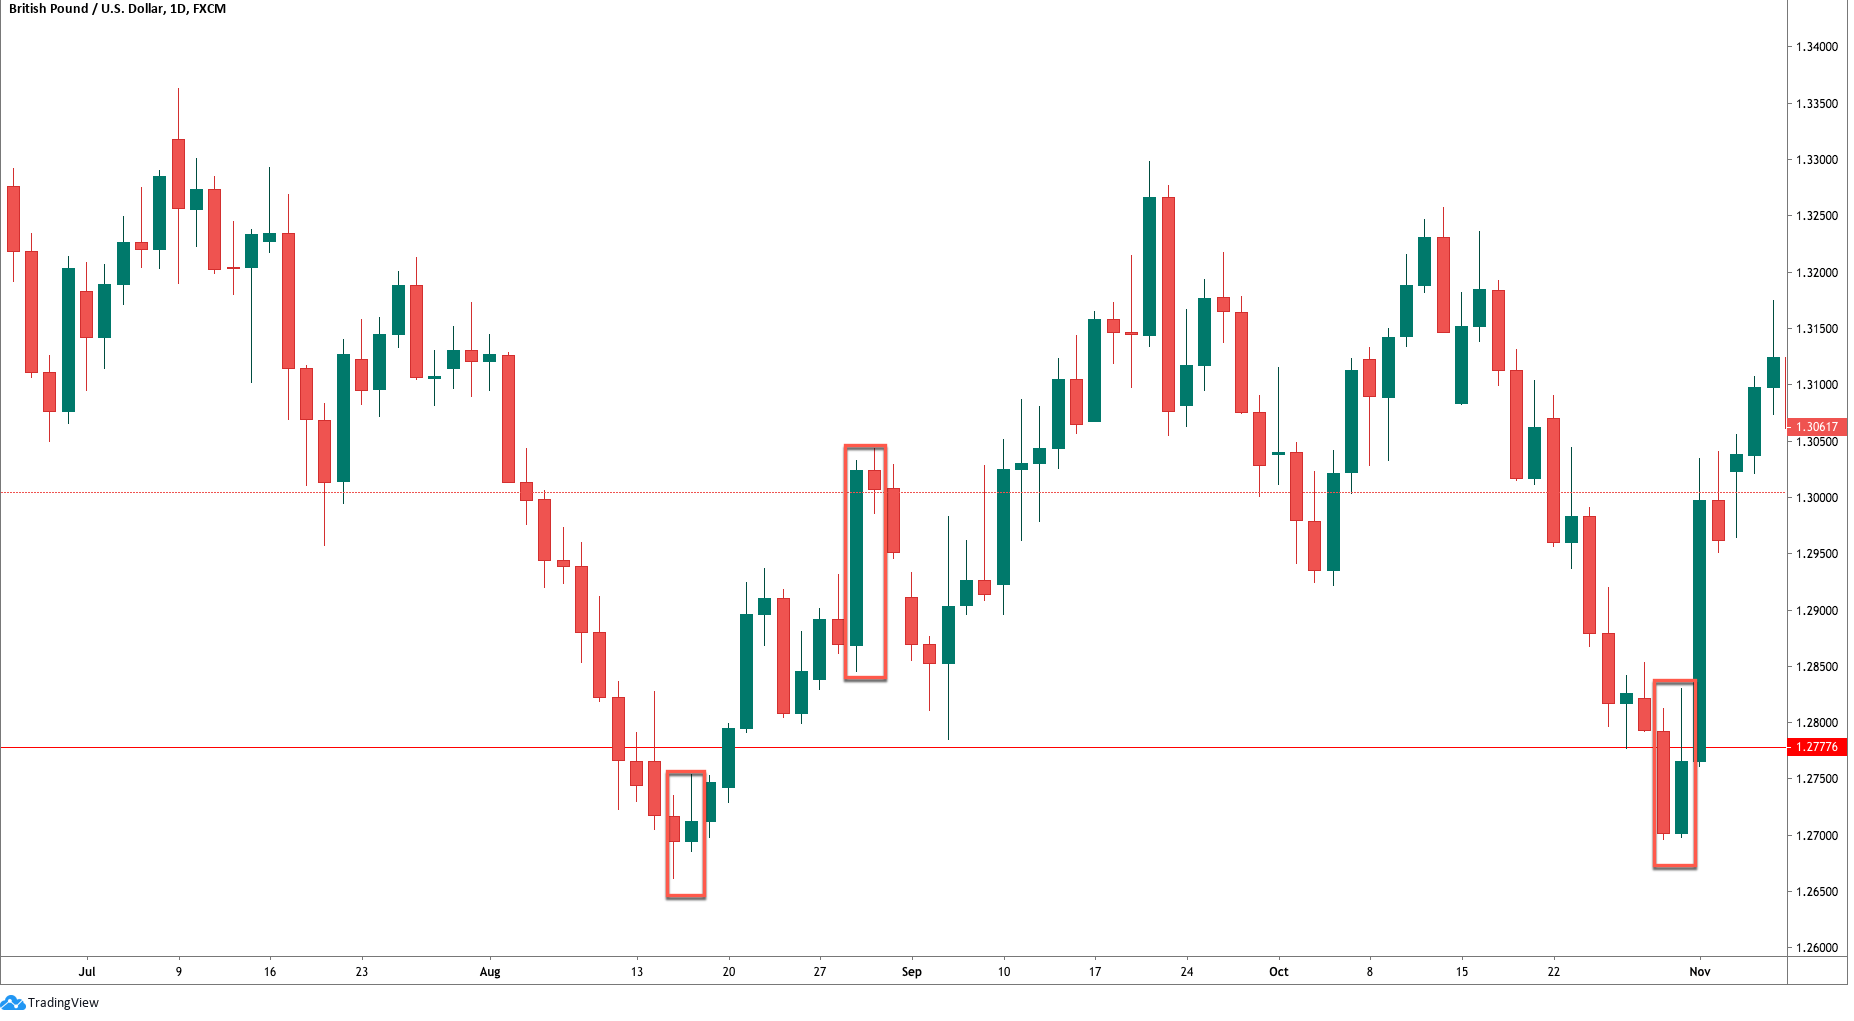
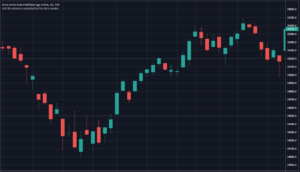
Chart 1 – Several Haramis in the Cable.
As we see in chart 1, haramis and engulfing patterns are alike, with the exception of the second one. What we can see is that be it harami or engulfing, the pattern is worth to pay attention to since most of the time signals the end of the previous leg.
Criteria for a Bullish Harami
- The body if the first candle is black (red) and the body of the second candle is white (green)
- There is evidence of a downtrend.
- The second candle opens higher or at the close of the first candle.
- Just the body needs to be inside the body of the first candle. That is unlike the inside day.
- A confirmation is needed for a reversal signal.
- The longer the black and white candles, the more powerful the signal
- The higher the white candle closes, the better.
Market Psychology of a Bullish Harami
After a selloff day, the next day, sellers don’t have the strength to push the prices further down. Concerned short-sellers start to take profits of just close the trade fuelling the purchases. The price finishes higher, and traders mark the double bottom as support. A strong day following the harami formation would convince the market participants that the trend has reversed.
Criteria for a Bearish Harami
- The body if the first candle is white (green) and the body of the second candle is black (red)
- There is evidence of an uptrend.
- The second candle opens lower or at the close of the first white candle.
- Just the body needs to be inside the body of the first candle. That is unlike the inside day.
- A confirmation is needed for a reversal signal.
- The longer the white and black candles, the more powerful the signal
- The lower the black candle closes, the better.
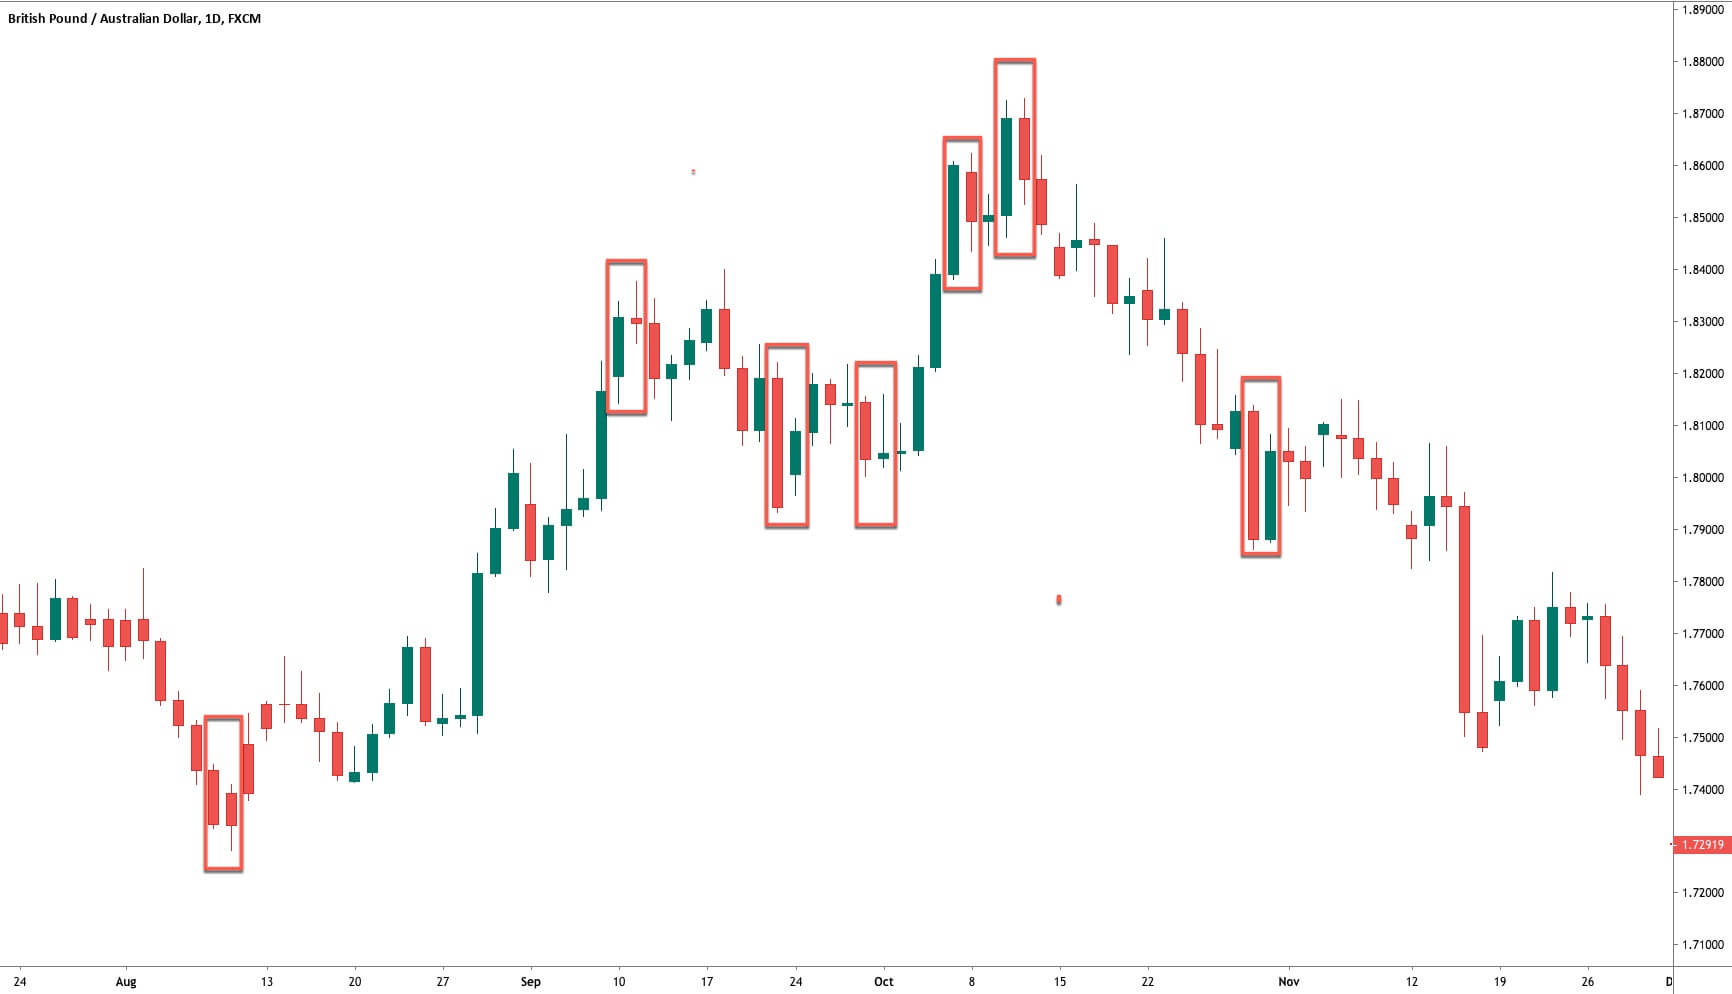
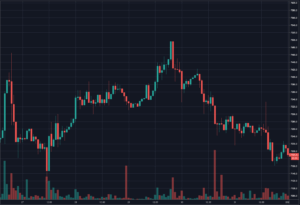
Chart 2- Several Haramis in the GBPAUD pair. Not all are successfully signaling a reversion of a trend
Market Psychology of a Bearish Harami
After a strong bullish trend, a long white candle emerges. In the next session, the longs cannot force more upsides. The asset began to drop, as concerned bulls are closing their positions to pocket their profits, and the day finished lower. Also, short-term traders mark the top of the white candle as a resistance level. A third day showing weakness is what is needed to convince everybody that the uptrend is over and a new leg down is starting.
References:
Profitable candlestick Patterns, Stephen Bigalow
The Candlestick Course: Steve Nison