Trend following strategies is the best method of trading according to research studies. Traders will pick a trading method that is the most comfortable or profitable to their living style and psychology. Therefore, your best method does not have to be trend following. On the other hand, most professional traders believe you can adapt trend following strategies to any trader personality type. It is just a matter of how well you improve your psychology part once money management and technicals are in place.
Trends are mostly not consistent and predictable so traders devise ways to have better odds in this environment. Trends can be parabolic, mild, and long, with pullbacks, low and high bases, or switches in momentum. Your trading system will need to have a mechanism to generate a signal to continue following the trend. This article will present one example of how you can implement a ruleset, indicator measurements, and algorithm to have a definitive decision when any of the above trend characteristics manifest. Your systems can take exact values although as every trader has different trading styles, you should adapt it to your preference.
Prop traders employ a set of indicators and elements to know when to enter a trade – at the best moment when a trend has started. That trend needs to have momentum. For this purpose, they measure volatility or volume. This trend is confirmed by confirmation indicators we wrote about, and money management tells us how much to risk according to the currency pair or other asset volatility. Other elements also have their roles so we catch the best probability trends once they emerge. But more often than not, our exit indicator can signal us to exit, only to find out the trend just had a pause a day or two, just two candles if we trade on a daily chart. Whatsmore, the trend continues for a week with great momentum.
Now, we can feel we missed out on a dramatic profit, but we have a rule set we do not deviate from. Continuation trades are also rule-based, and since trends are not consistent, continuation trades are common, so common they can even make the majority of the trades we make. Some prop firms take into account higher and lower time frames signals to pinpoint the best entry or exit. Yet, for continuation trades, it is enough to stay on one if it is a daily time frame, since higher time frames, weekly and monthly can have many significant events for a currency. A daily time frame is used in our algorithm example, including the previous articles.
In our MACD indicator article, we gave an example of how the MACD can be used for continuations. However, there are a few rule modifications once we have a trend below or above our baseline element. Additionally, other elements such as the volume filter, are completely ignored. Now you may think you spent so much time on finding and testing the volume indicator only to ignore it now is not a rule you want to implement. If you remember the article we talked about the lagging indicators, you will notice every volume or volatility indicator we know needs data to measure to have a conclusion if the price action is flattening out.
You may rely on chaos theory and look at the charts alone to determine if the market is going into the flat period before any volume indicator signals. These decisions are predictive, it is hard to backtest your decisions like this and they are prone to previous trade success and emotional state. If you use a volume indicator, continuation trades will likely be too late, you will enter a trade once a trend is in a pause or reversal moment. Consequently, we are eliminating the volume filter from our algorithm for continuation trades only. You can backtest this decision if you have better results without it. In our testing, it was always the case.
The Baseline is our ultimate major trend filter. It tells us where a higher scale momentum direction is. Using a baseline we filter one trade direction, short or long if the price is below or above the baseline at the end of the day trading session. Based on this rule, we enter only the trades in the same direction as the major trend momentum. Clearly, there is a higher probability a trend will push the price more in the same direction than turn around, even though reversals happen and cut a part of our profits from our trades or cause a loss if our take profit levels are not reached. This is what the baseline element is for when we talk about continuation trades.
In forex trading, it is easy to find certain market conditions that do not fall into our rule book. Such does not happen often if our plan is already developed and tested. However, there is a common condition that may confuse beginner traders if they follow our guides. It is a condition when the exit indicators call for an exit even though the trend confirmation indicators still show the trend is still going on. As mentioned above, we do not blindly ignore the exit indicator or blindly listen to the exit indicator. We create an additional continuation rule that says to enter a continuation only when the confirmation indicators show a new entry signal. This means they have to show a counter-trend signal before a continuation can happen once they generate a trend-following signal again.
If you have a confirmation indicator that also doubles as an exit indicator, then it has to show an exit before a new continuation signal, in this case, it is easier to find continuation trades as the signals are at the same moment. Yet, in most cases, exit indicators act before confirmators, so you need to watch for an alignment. Once you do some continuation trades, it becomes easy to follow the algorithm, even if it may look complicated.
Money management also needs to be adjusted for the continuation, not just the volume. You may notice the ATR money management is always in effect, for all trade types your algorithm shows. You will still use it as described in the previous articles and guides without exception. However, the part that does not include position sizing measures, is ignored. So not only do you ignore the volume for continuations, but also the 1xATR price level (values used in our example) that is past the baseline. Trends that continue are often way past the baseline, so the rule when we enter a trade that prohibits fast movers past the 1xATR range from our baseline does not make sense. Otherwise, we would never have the benefit of continuation trades that happen a lot.
Continuation trades do not have this ATR – baseline rule but it does not mean you should ignore the crisp money management position sizing setup we have described in a separate article. Only when the price cross-closes the baseline we apply the ATR range rule. So we define a trend in the continuation mode only when it never crosses the baseline again but the confirmation indicators show another signal to go.
Now we can present examples of how we manage these conditions with the simplified system according to some prop traders. Again it is all defined, we do not have to think if the trend is continuing or not, the system covers this situation, all we have to do is follow it. It is easy to backtest and forward test it too. Let’s take the MACD indicator we have used first as it has a few parts combined to generate signals – two moving averages intercrosses and a zero line cross. It is good as an example of a continuation trade idea. In the picture below we see AUDNZD daily chart with the MACD on default settings without the baseline or any other system element.
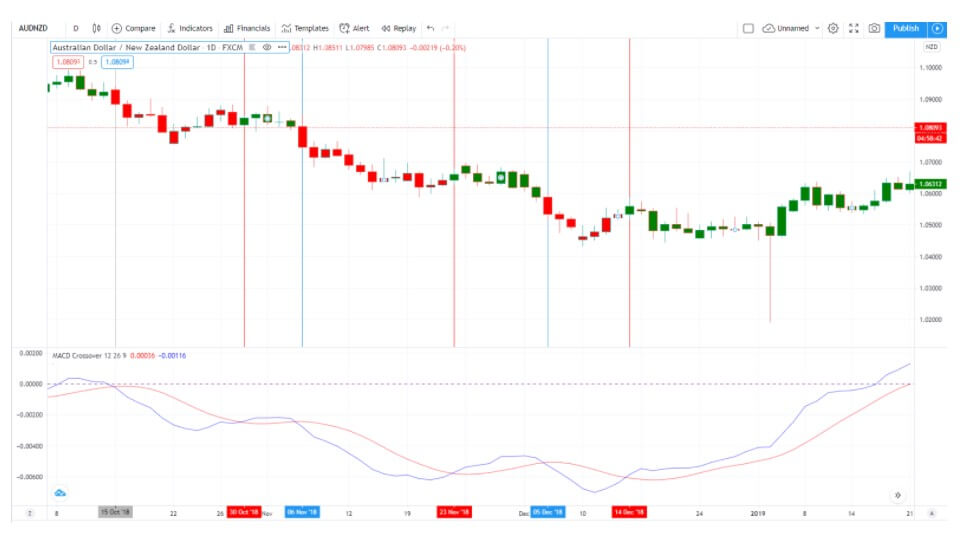
The zero-line of the MACD (gray dashed line) is like our baseline, a higher scale major trend gauge. Once both MACD moving averages cross it, this signals that a major trend is starting, the grey vertical line on the chart marks the moment. So this is a short signal, but we have a signal to exit once the faster, blue MACD MA crosses the red one. Both MAs are still below the zero-line telling us this is probably a small correction and we are still in the major downtrend. Soon, we had our first continuation trade, the faster blue MA crossed the red down again, marked by a blue vertical line. An exit signal was generated again and a new continuation until the major trend was over later when both MACD MAs crossed the zero-line at the far right end of the picture.
Some of the continuation signals might be a loss but these are losses we have to take. We do not account for the volume filters here so we have to be careful about these trades and maybe avoid taking them if the forex market overall is not moving much. Such conditions can be assessed with the mentioned $EVZ or VIX Index we wrote about before. Combined, continuation trades capture the biggest part of the major trend, but not all, this is the price we have to pay if we want to control the risks.
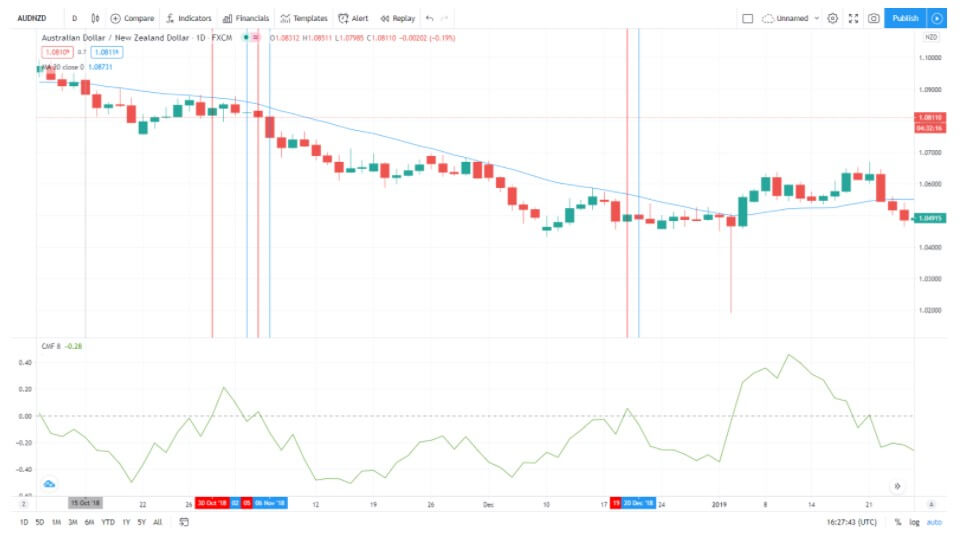
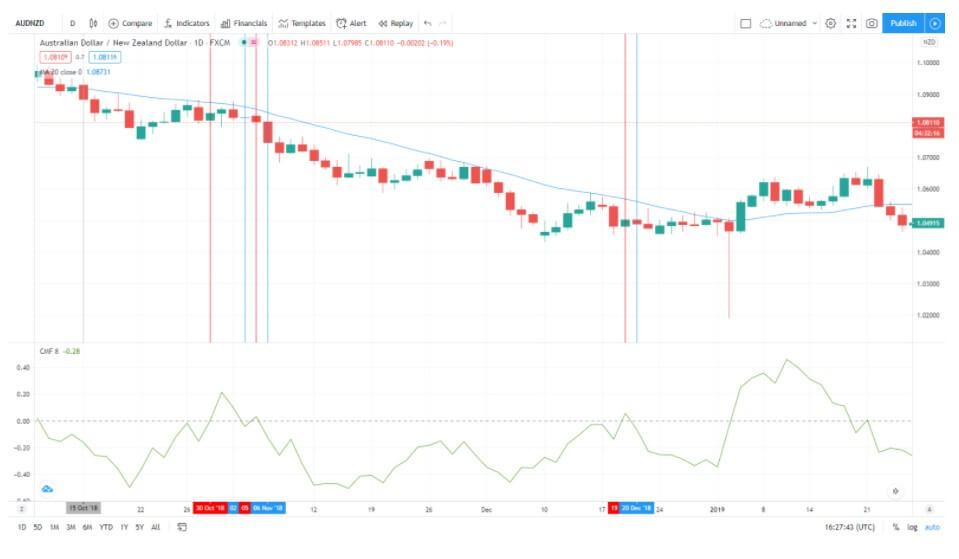
Now, let’s add a baseline and change the main confirmation indicator for the same chart. We are still not going to include other algorithm elements, such as the volume and exit indicators you should have included. For the sake of simplicity, we will use the Chaikin Money Flow indicator for entry and exits, set on the 8 periods. We also include the 20 SMA as the baseline. The Chaikin Money Flow also contains a zero-line, once the signal line crosses it down, it is a trade entry signal. Also, once the line crosses it up, we exit. As in the previous picture, the major trend started once it close-crossed our blue 20 SMA baseline, the moment marked with a gray vertical line. Chaikin Money Flow agreed and we entered the trend. Pay attention to the ATR entry rule here as well as the volume conditions your system should have. Chaikin Money Flow gave us a signal we need to exit for the first time, marked with a red vertical line. This was probably a winner trade if we put our take profit at the 1xATR level.
Three days later, Chaikin Money Flow gave us a short entry signal again, the price level closed below our baseline so this is officially a continuation trade, no ATR-baseline rules apply for trade entry, we do not look at our volume indicator, we just place our usual risk management (position size, take profit and stop-loss orders) according to the ATR levels. A candle later we have an exit signal with a small profit and then Chaikin Money Flow shows to enter once again without exit until a few weeks later. This captured more profits than the MACD even though we now used more sensitive indicator settings. Interestingly, we had another continuation trade that ended in profits until the price close crossed the baseline, marking an end to the major trend and our current trade.
Again, we have not included system elements you should have to cover the most important aspects of the forex market. The examples above are only to demonstrate how to handle trends that more often than not have inconsistent momentums. You should always test how your system performs, including all trade types – continuations, pullbacks, new trend entries, including trade exits, and the trading rulebook. As you may have noticed, reversals are not the trading type for trend-following methods. Hopefully, now you can have a complete system structure you can follow and come back to if you need clarification. Of course, you can add-on to the mentioned example and build your own structure while exploring the world of forex.