Categories
Forex Basic Strategies

Trading Reversals Using Bullish Reversal Candlestick Patterns

Hundreds and hundreds of trading tools make it super easy for the traders to trade the markets. There are candlestick patterns, indicators, price action trading. All of these things making trading are an easy game for the traders. In this article, we are using the reversal patterns and double moving average to successfully trade the counter trend situations. Below is the explanation of a couple of reversals candlesticks and the double moving average.

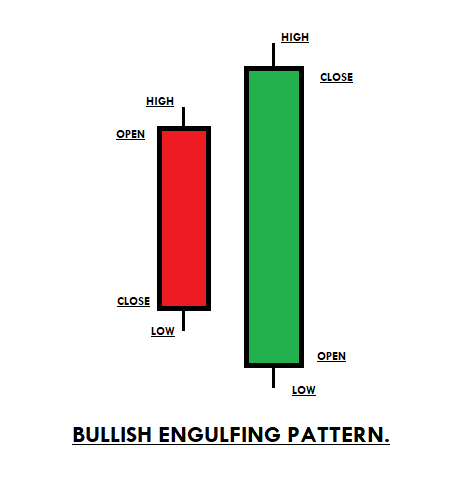
BULLISH ENGULFING PATTERN

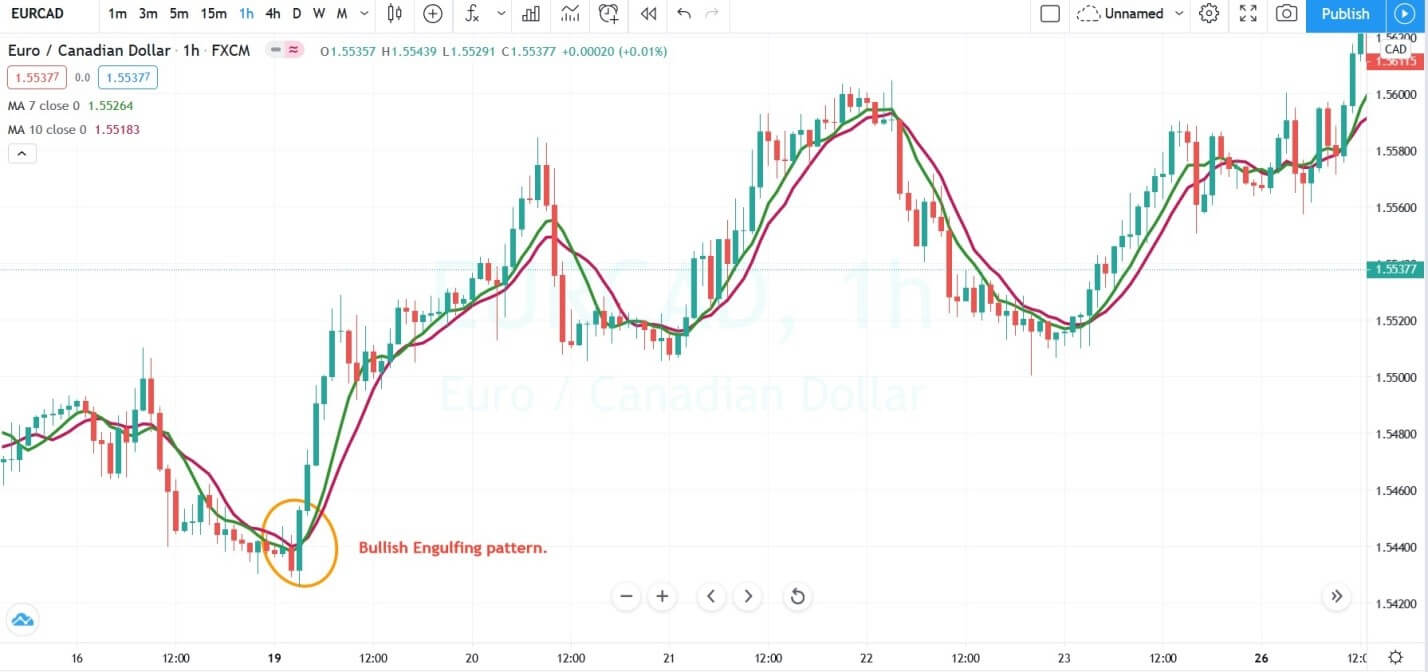
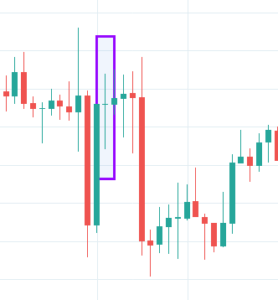
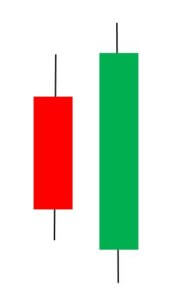
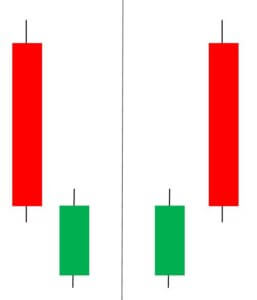
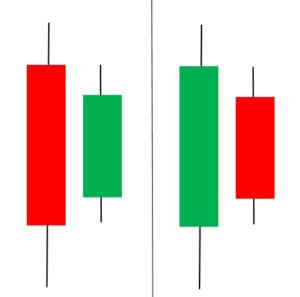
Bullish engulfing is a reversal pattern that appears at the end of the downtrend. The pattern consists of two candles, Red and Green. The first candle is red, which indicates the sellers are in control and the second candle completely engulfs the first candle, which shows that the buyers overtake the sellers.

HAMMER

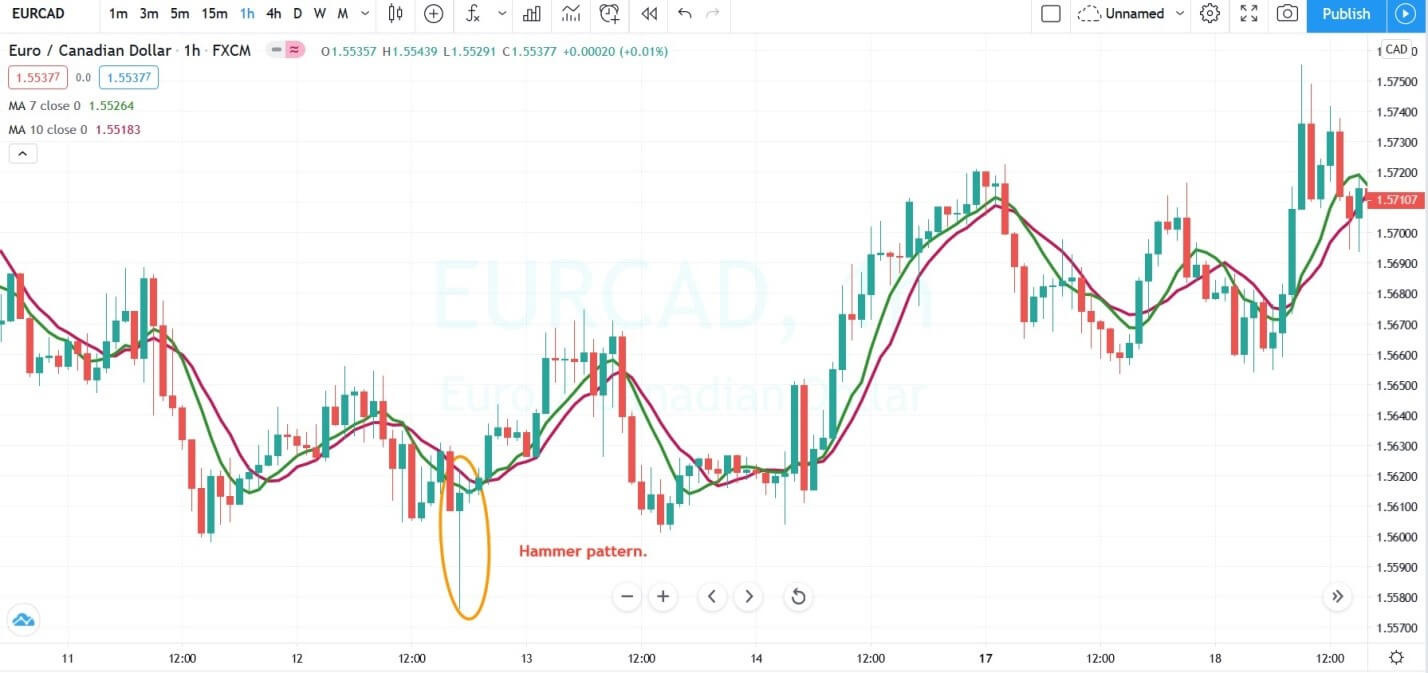
Hammer is a single candle reversal pattern, and it appears in a downtrend. The pattern forms a hammer-shaped candlestick, where the lower shadow is twice as big the size of the real body of the pattern. The boy of the candlestick represents the closing and opening price, and the lower shadow indicates the low of the candle.

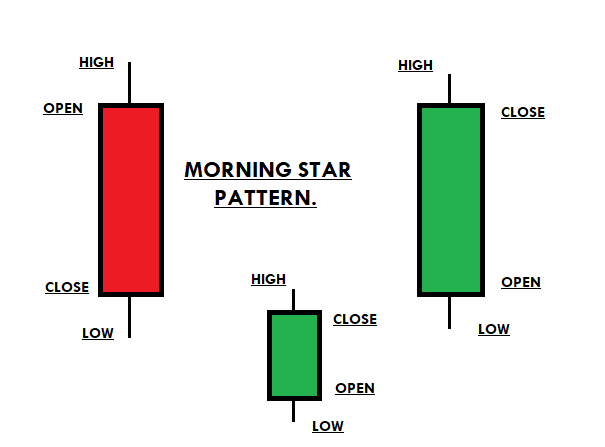
MORNING STAR

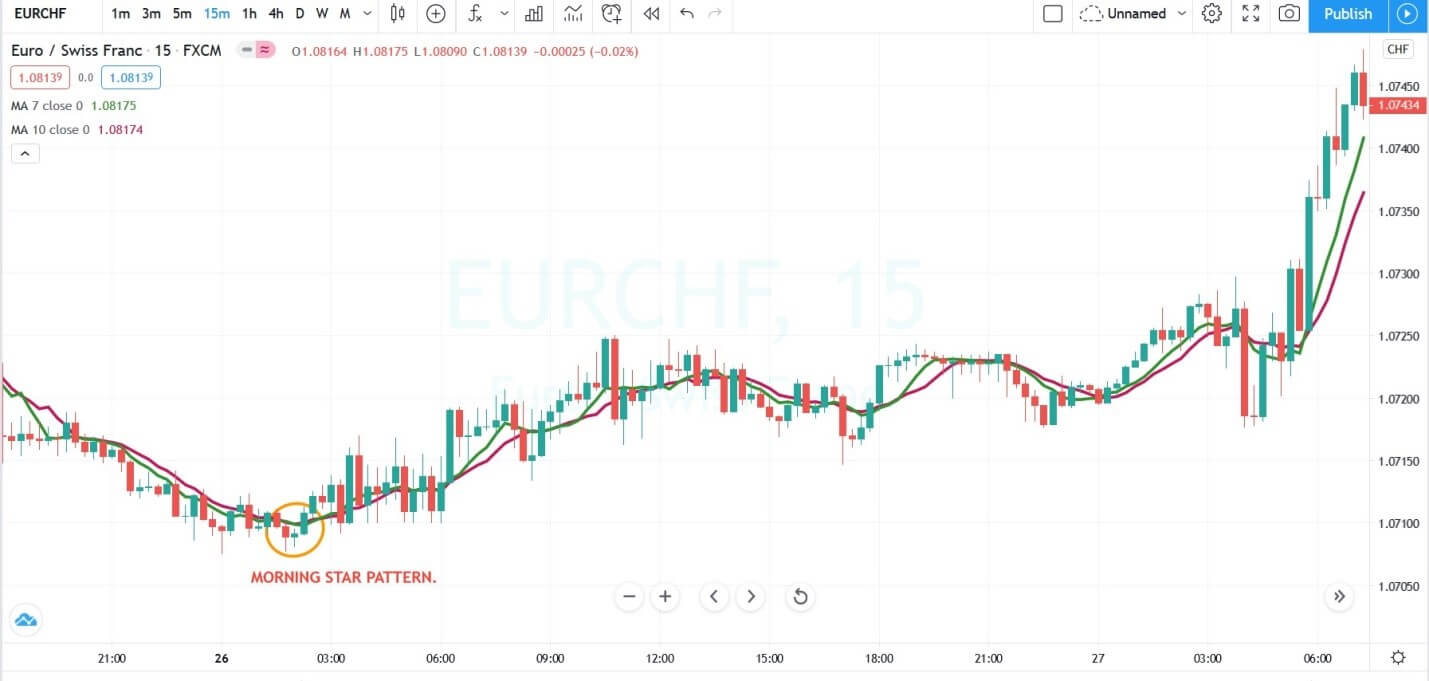
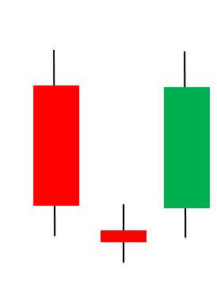
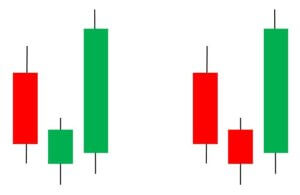
Morning star is a reversal three candle pattern appears in a downtrend. The first candle is red indicating the downtrend and the second candle opens gap down which means the sellers are in control and the third candle pushes the prices and closed near the opening of the first candle indicating the buyers stepping in and get ready for the brand new higher high.

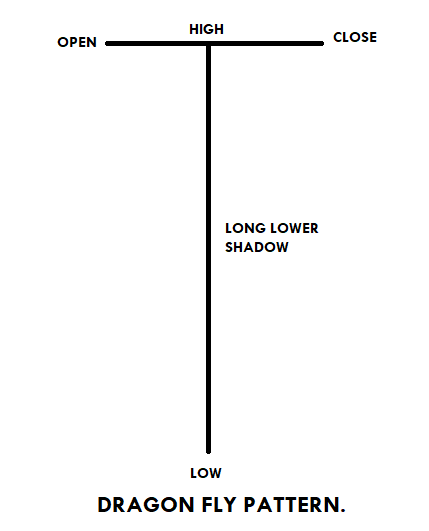
DRAGONFLY PATTERN

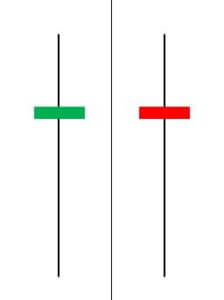
Dragonfly is a single candle pattern which shows the extreme strength of the buyers. The candle open, close and high is the same, indicating the buyers are ready for the brand new higher high. It has a long lower shadow with no upper body.

MOVING AVERAGES

Moving average is a trend following lagging indicator based on the past price. The indicator is used for identifying market trends. If it is pointing upward and below the price, it means the trend is up, and if it is above the price and pointing downward, it means the trend is down. All the type of traders uses moving averages, and there are infinite numbers of averages exists, which traders used according to the market circumstances. If you are a lower timeframe trader, then use the lower averages and if you are trading the higher timeframe or swing trader, then go for the bigger averages.

REVERSAL TRADING STRATEGIES

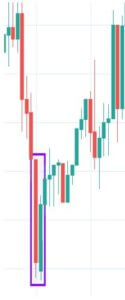
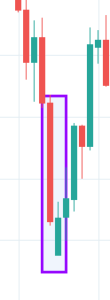
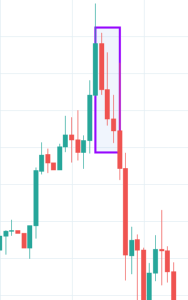
The image below represents the Bullish engulfing pattern in the EURCAD forex pair.

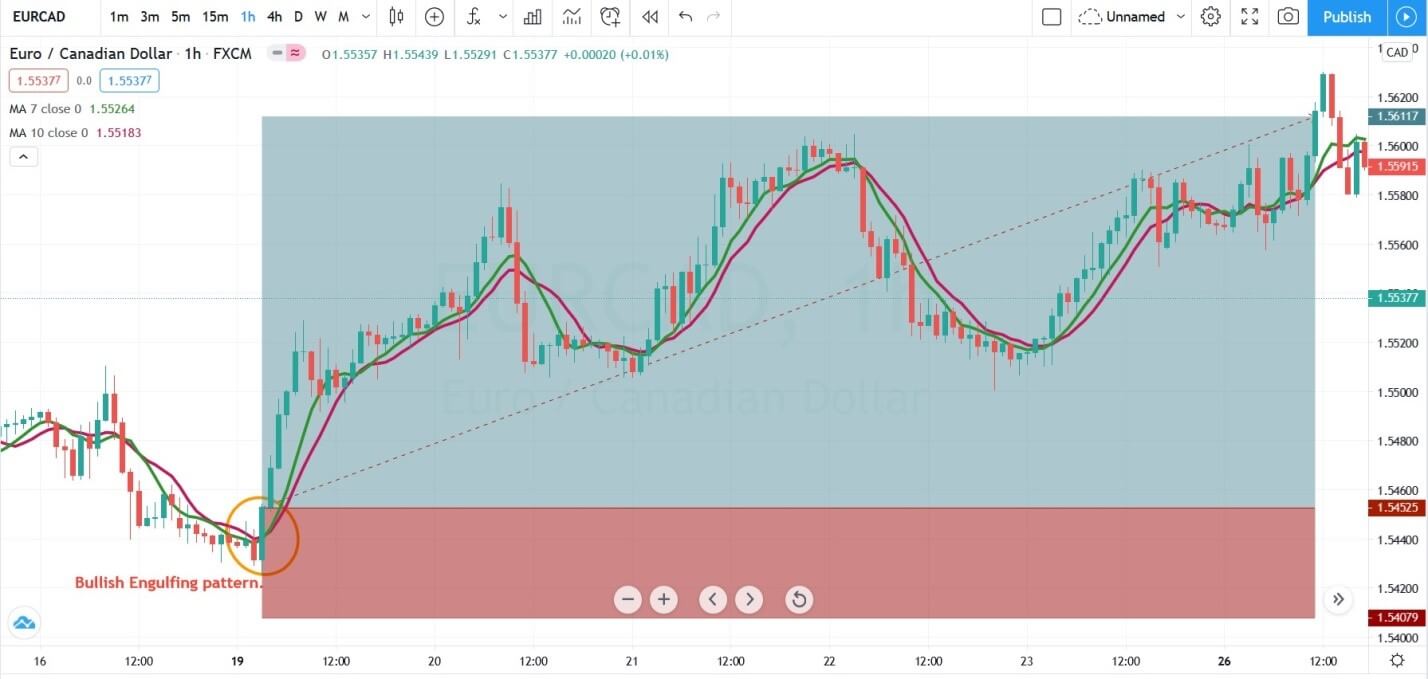
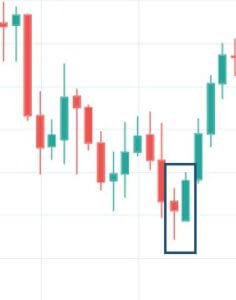
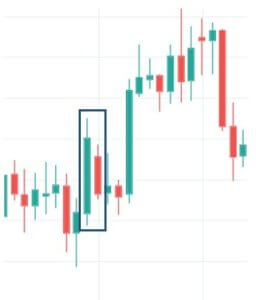
The image below represents the buying entry after the short term reversal in the EURCAD. When the second green candle completely engulfs the first red candle and closes above both of the moving averages, it was an indication to go long. We took the entry after the pattern completion and choose to go for a brand new higher high with stops below the entry.

TRADING THE HAMMER PATTERN

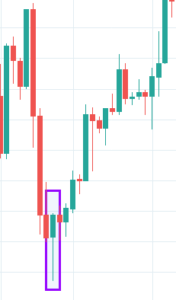
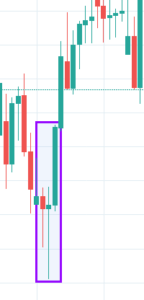
The image below represents the Hammer pattern in the EURCAD forex pair.

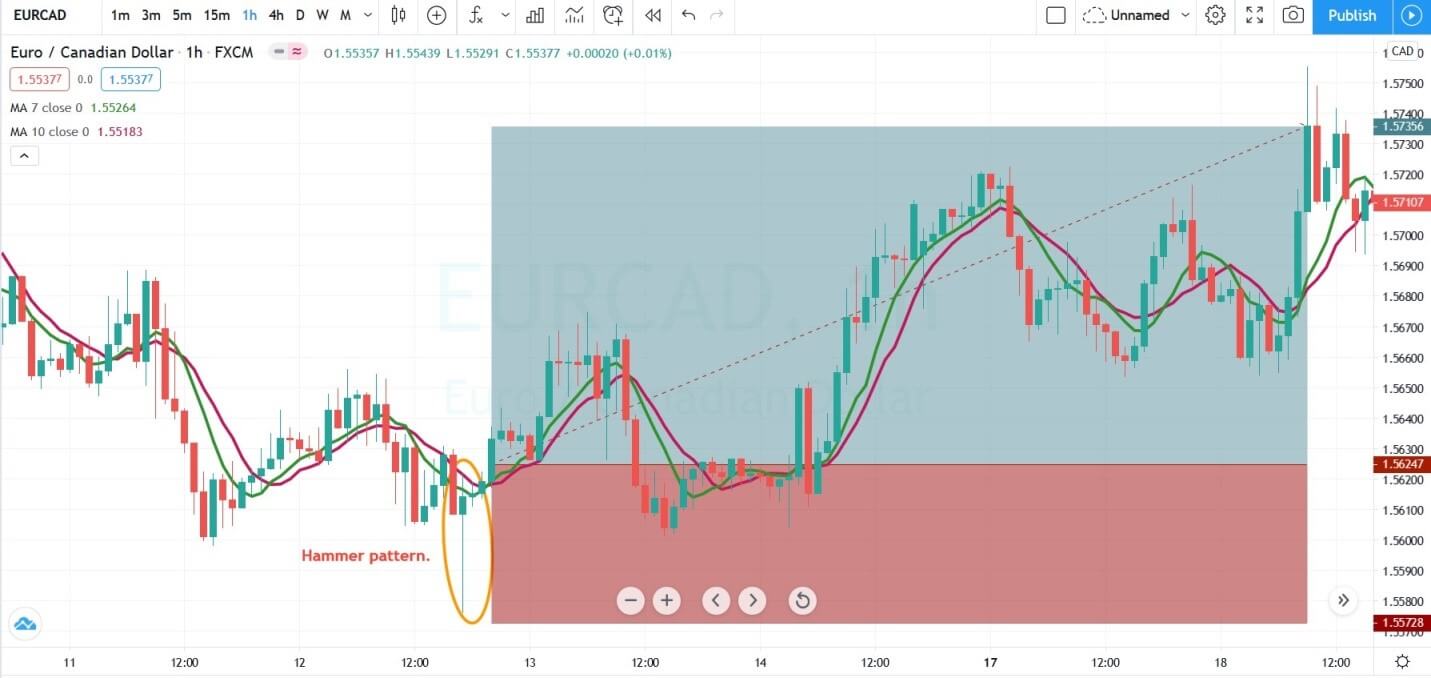
The image below represents the hammer pattern and our buying entry in the EURCAD as you can see the price action prints the hammer pattern, but it failed to go above the moving average. At this stage, some trader chooses not to trade the pattern just because half of the criteria aren’t met. This happened some tie in the market where one tool is saying something and another one is saying something. In these situations, it is advisable to have enough patience and let the second trading tool to align with the first one. In our trade after the three hours prices goes above the moving average, which indicated the buying momentum is back into the show. With the stops just below the pattern, we choose to milk the trend for the brand new higher high.

TRADING THE MORNING STAR PATTERN

The image below represents the Morning star pattern in the EURCHF forex pair.

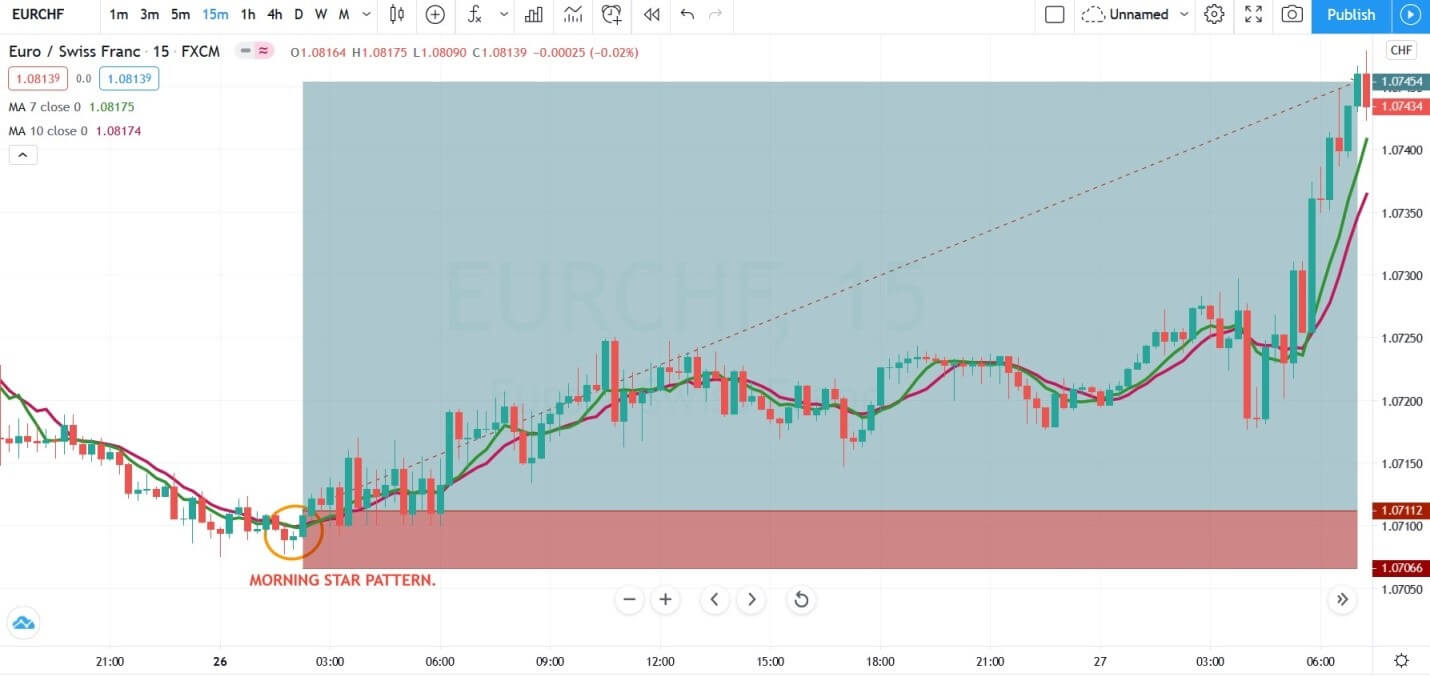
The image below represents our entry, exit, and stop-loss in the EURCHF forex pair. The market was in a downtrend, and when the prices prints the morning star pattern and both of the moving averages goes above the price, it means the market is printed at the bottom, and going long will be beneficial. We activated the buying entry after the pattern completion with the stops just below the entry, and for taking profit, the brand new higher high was a good area.

DRAGONFLY PATTERN

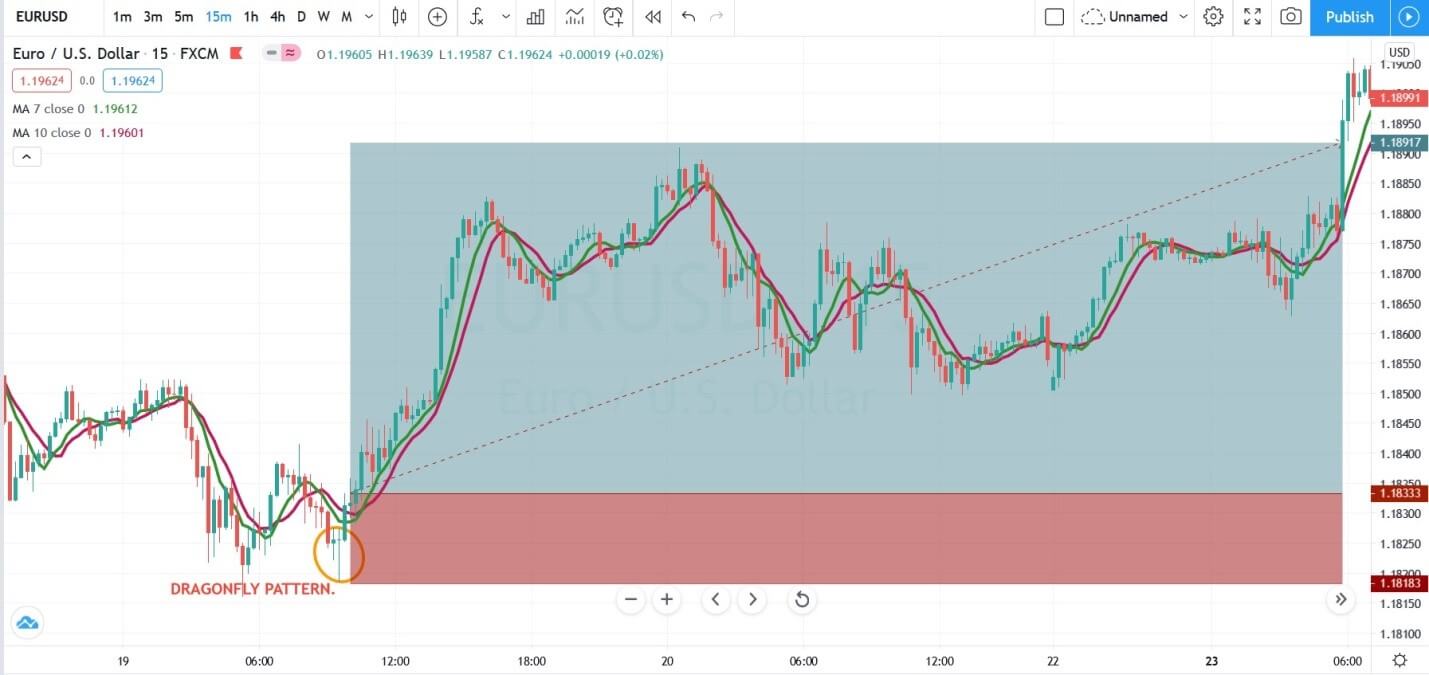
The image below represents the buying trade in the EURUSD forex pair.

As you can see in an ongoing downtrend when the market printed the dragonfly pattern, but it was below the moving average, which means we need to wait for another signal to line up to take the trade. Patience matters, if you take trade by having only one signal, then the chances of loss are very high. So wait let the things to settle, let both of the tools to align in one direction then only go. On this 15 minute chart when the moving average goes above the price action, we choose to go long with the stops below the entry.

CONCLUSION

In today’s world, we have a lot of tools which makes trading is an easy game. Do not try to use all the trading tools; instead, choose the one or two and master them on demo first then only choose another one. Here in this article, we discussed the four well-known candlestick patterns to trade the reversals. By pairing them with the moving average traders can time the market well. In these four trading strategies, two of them gave use the trades immediately, and two of them took some time to confirm the entry. Never be in a hurry to pull the trigger; it can produce disastrous effects. The major problem with the traders is that they always try to tell the market what to do next; instead, it is the market duty to tell us what to do next in the game, when to pull the trigger and when not.

Categories
Forex Basic Strategies

Trading the Forex Market Without Indicators and Still Profiting

Traders believe if they need to trade the forex market, they need to keep up with the – news, fundamental analysis, you must check the various reports, read the currency articles, and then finally use the technical analysis where all the type of indicators are available for you to master them then only start the trading. If you want to avoid these things, then there is another way for you. Price action trading is a simple and effective method you can use to trade the markets successfully. Here you don’t need to master the fundamentals or indicators, instead focus purely on what price action is saying.

Price action explains the market movements via the chart patterns, candlesticks, and by using the trend lines. The formations of the trading patterns are the direct result of how the collective traders thinking about particular situations, in short, the perceptions of the collective consciousness forming these patterns on the price chart. Each trading patterns have some meanings and traders who master these patterns use them for trading the market successfully.

PRICE ACTIONS TRADING TOOLS

DEFINING THE SUPPORT AND RESISTANCE LEVELS

The concepts of support and resistance are the highly discussed attributes of the technical analysis. Almost every trader around the globe knew about support and resistance trading. A support level tends to acts as a barrier to price action. It is a level where the price action can be expected to pause due to the demand. Most of the retailers use the support area to buy the asset. Support levels are mainly derived from the memories of the traders. For example, traders always check on the historical price data to find out the significant support levels. These are the levels from where the last time prices respond, and by using that level, they placed the buy orders with the expectations of the price reversals. The more closer the price action is to the support level, the bigger the demand will be. Always look for the significant support levels on the price charts to take trades; major support levels are where the higher timeframes gave reversals in the past.

On the other hand, resistance levels are useful to take the selling trades. The resistance level is also acting as a barrier to the uptrend. It is a level where all the traders take the selling trades in the past. The higher the timeframe is, the stronger the resistance area will be. The sixty-minute or four-hour chart doesn’t hold enough power to reverse the trend; it is the daily weekly resistance levels that can easily change the trend. If you are using the lower timeframe resistance levels, then use them for smaller trades, and if you desired to catch the full trend, then merely a higher timeframe is a good choice for you.

CHART PATTERNS

The price action traders use chart pattern trading. Over time professional traders find out the patterns on the price chart, which reflects the psychology of the buyers and sellers. These patterns become the most popular and leading way in the industry to trade the markets. All you need to do is to interpret these patterns very well to use them. Most traders made mistakes where they jump into the half-formed patterns and end up on the losing side. In the markets confirmations of the pattern is very crucial to make any trading decision.

FLAG PATTERN

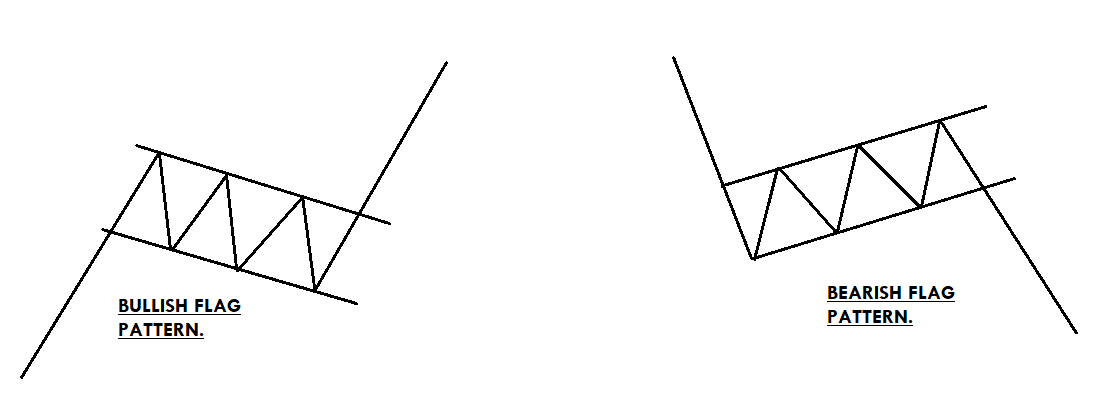
A flag is a technical chart pattern that appears in a strong uptrend. It is a continuation pattern that consists of a long pole and a downside flag. It is named because of the way it reminds the viewer of a flag or a flagpole. The pattern is used to take the trade with the trend, or it is useful to time your trades. In an ongoing trend, wait for the prices to pull back enough, after that draw the two lines above and below the price action to draw the pattern. The bottom of the pattern should not exceed the midpoint of the flagpole and wait for the breakout to take the trade. In buying trade, stops should be below the entry and go for a brand new higher high.

TRIANGLE PATTERN

There are so many different types of triangle patterns in the market. The patterns are formed by crossovers of the support and resistance lines. Below are a few triangle patterns we mentioned.

  1. Ascending Triangle (It consists of a static resistance and ascending support) – It is a continuation pattern that appears in an uptrend. The entry should be taken at the breakout of the resistance level.
  2. Descending Triangle (It consists of static support and descending resistance) – This one is also a continuation pattern that appears in a downtrend. The price action moves slowly inside the pattern because both of the parties hold equal power. In contrast, the breakout of the pattern indicates the sellers overtake the show.
  3. Symmetrical Triangle (The support and resistance of the pattern converge at the one point.) This pattern represents the period of consolidation before the price is forced to move in one direction. The breakout marks the starting of the uptrend, whereas the breakdown of the lower line is an indication to go short. So this pattern is also known as a falling and rising wedge pattern.
  4. Expanding Triangle (Both the support and resistance lines are moving away from each other) this one is a very tricky pattern because price action makes new high and new low in each wave. It is very hard to know the direction of the market when the prices move inside the pattern, so always wait for the breakout or breakdown to take the trade.

All of the triangle patterns are only useful to trade after the breakdown or breakout. The price inside the patterns gave no signal of which side they are going to break, so it is better to wait for the breakout to make any trading decision.

CANDLESTICK CHART PATTERNS

ENGULFING PATTERN

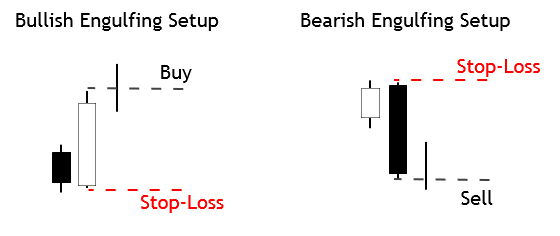
Engulfing is a reversal pattern; there are two types of engulfing patterns. The first is bullish engulfing and the second one is bearish engulfing. Engulfing pattern consists of two candles where the first candle overtakes by the second candle. The bullish engulfing pattern appears at the end of the downtrend; the first candle is red, which completely overtakes the second candle, which is green in colour. The bearish engulfing pattern appears in an uptrend; the first candle is green in colour followed by the red candle, which engulfs the first one. The bearish engulfing signals the bears take over the bulls and expect the new downtrend, whereas the bullish engulfing pattern indicates the bulls take over the bears and expect the beginning of the brand new higher highs. The stop-loss order must be below the pattern in an uptrend formation, and the stops for the downtrend formation must be above the pattern, for booking profits choose the higher timeframe major levels.

SHOOTING STAR AND MORNING STAR

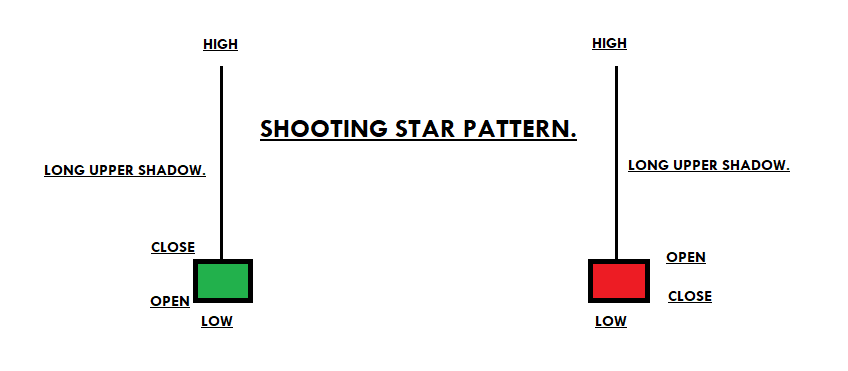
SHOOTING STAR

A shooting star is a bearish candlestick pattern that opens, advances throughout the day, and then closes near the open of the day. In short, it is a long upper shadow, the small body which indicates the selling trades. The pattern opens in an uptrend indicates the buyers are strong, goes higher but closes back at the opening price shows the sellers pressure.

MORNING STAR

A morning star is a three candlestick pattern that appears at the end of the downtrend. It is a reversal pattern that shows the buyers were first in control and the second candle was the fight between both parties and the third candle was green in colour which indicates the buyers won the battle and they are ready for the brand new higher high. Entry should be at the closing of the pattern and ride the uptrend until there are indications of another reversal.


DRAGONFLY PATTERN

Dragonfly is a bullish reversal pattern that indicates the beginning of an uptrend. The pattern consists of a long lower shadow, which means sellers tried to take the prices down, but the buyers came back and closed the prices the same as the opening price. The unique name “Dragon Fly” means the buyers are very aggressive, and now they are all set to print the brand new higher high. Traders should wait for the next candle to close above the lowest price of the previous candle to confirm the Dragonfly pattern. The stop loss should be below the candle, and for taking profit go for a brand new higher high. The pattern doesn’t occur frequently, but when it happens, it often ends up giving more significant buying trades.

FAKE BREAKOUT

A fake breakout happens when the price action breaks the major level and comes back again. When the fake breakout occurred, if you witness any candlestick pattern, then that’s a good sign for you to take the trade in the direction of the established trend.

CONCLUSION

Traders believe it’s not possible to trade the markets without the indicators. But it’s just another myth. There are so many different ways to trade the market, and using candlesticks, chart patterns, fake-outs are just another way. Every trader has its style of trading; some like to trade the indicators, some chart patterns, and another candlestick pattern. Choose whatever the way you want and trade the market. The above-explained ways are the leading technical tools; you can even pair the candlestick patterns with the chart formations to improve the odds in your favour. If you find the fake-out, the candlestick pattern then followed by chart pattern, then the trade even has a higher odds to perform. When the markets prints the guaranteed trades go big and always use the stop-loss orders.

Categories
Forex Basic Strategies

Trading The Forex Market Using ‘Price Action With Context’ Strategy

Introduction

Price action with context is a process to predict a currency pair’s movement by reading the chart. The key price driver of a currency pair is fundamental events, but we can predict the future movement based on the present and past activity of the chart.

Central banks and financial institutes drive the forex market. Therefore, when they make the price move, they left some signs of their activity. As a price action trader, we will read their activity and anticipate what they might do in the future.

What is Price Action?

Price action is a process to inquiry about a currency pair’s price development. The main aim of the price action trading is to understand buyers’ and sellers’ sentiment in the price and predict future movement based on these. The price action trading is based on the combination of several trading indicators and price behaviors. Therefore, you might have to use multiple trading tools as a price action weapon.

The price of a currency pair moves based on the sentiment of buyers’ and sellers’. Therefore, using price action is logical that can provide accurate trading signals. In the price action with context trading strategy, we will identify a market direction by reading the chart and then enter a trade from the correction to get the maximum return with a minimum risk.

What are Price Action Weapons?

There are many parts in the price action trading that a trader should know, like- candlestick, support and resistance, trend, market flow, event level, key Level, and market context.

Candlestick

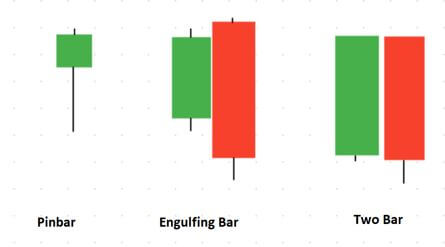
Candlestick represents the price movement of a currency pair for a specific timeframe. The four major parts of candlestick trading are- opening price, closing price, high price, and low price. Candlestick represents both continuation and reversal price direction based on the opening, closing, high and low. There are many candlestick patterns in the market, but in this trading strategy, we will focus on reversal candlesticks only.

Example of reversal candlestick – Pinbar, Engulfing Bar, and Two Bar, etc.

Support & Resistance

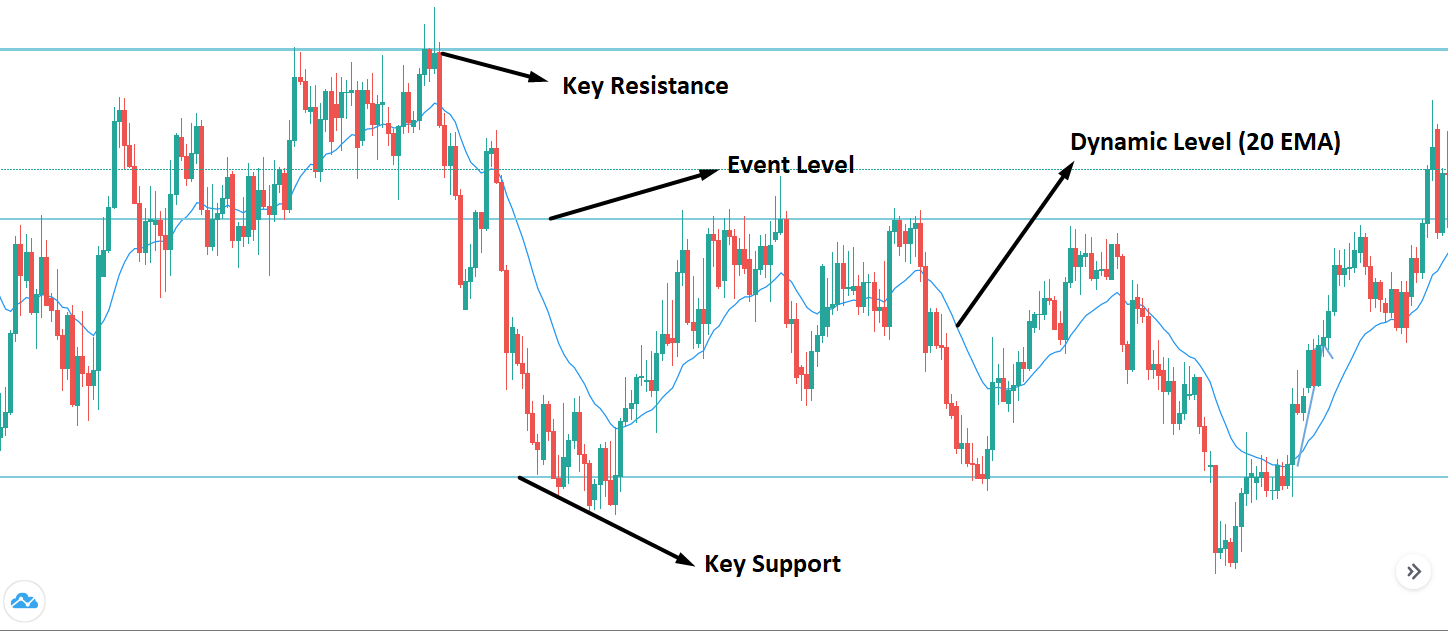
Support and resistance are a price zone from where the price is likely to change the direction. When the price is moving up, it will reverse as soon as it finds resistance. On the other hand, the price will stop moving down as soon as it finds a support level. There is more to know about the support and resistance in this trading strategy-

Event Level – Event level is a price zone that works as both support and resistance. It is the most important Level as both buyers and sellers put attention to it.

Key Level – key levels are a significant level in the daily or weekly timeframe to understand the price’s top and bottom.

Dynamic Level – Dynamic levels move with the price rather than a specific horizontal zone. In this trading strategy, we will use 20 Exponential Moving Average as the dynamic Level.

Market Context

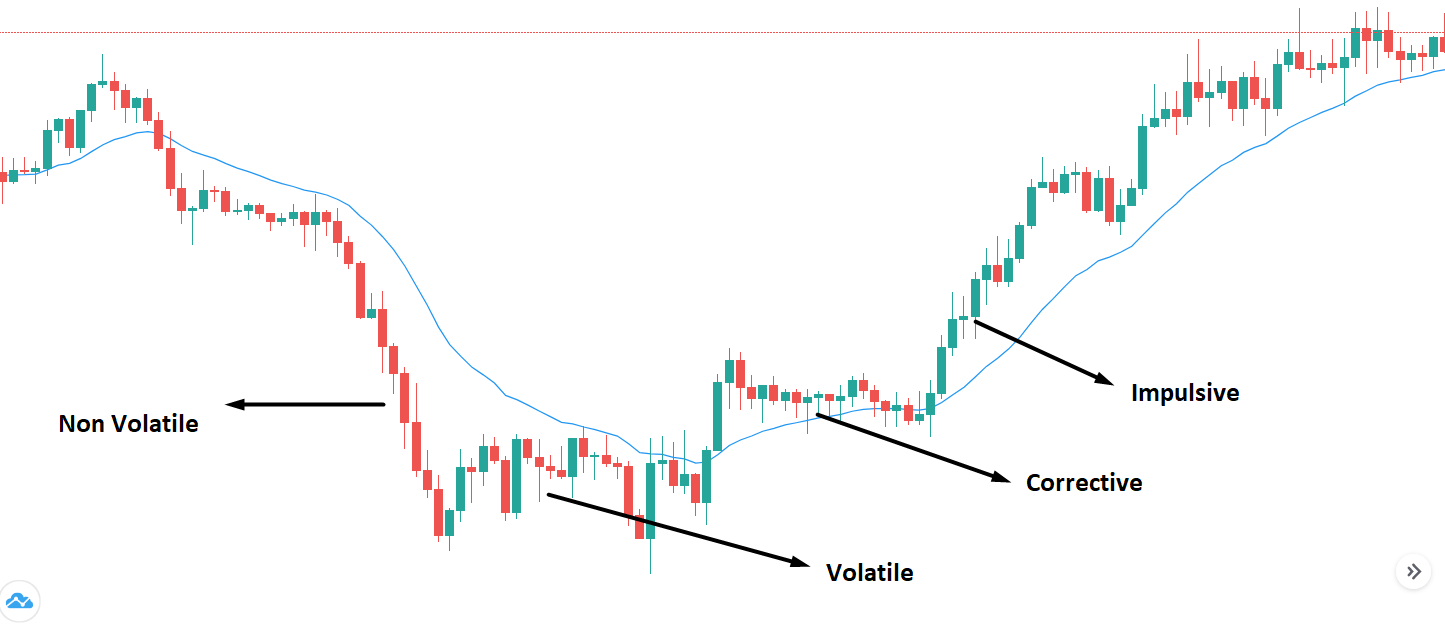
Market context is a process to identify the nature of a trend. It has four elements:

Impulsive – When the price aggressively creates new highs and lows, it is considered as an impulsive trend. It indicates that the price will continue the current trend.

Corrective – In a corrective market structure, price barely creates new higher highs or lower lows. It is an indication of market reversal.

Volatile Trend – In volatile trends, the market follows the corrective structure and indicates a market reversal.

Non Volatile Trend – Non-volatile trend appears with the impulsive market momentum when the price tries to continue the current movement.

Bullish Price Action Trade Setups

Find the market in an impulsive bullish pressure in H4 or daily timeframe. Identify the Key support level and consider buy trades only as soon as the price is trading above it.

Entry

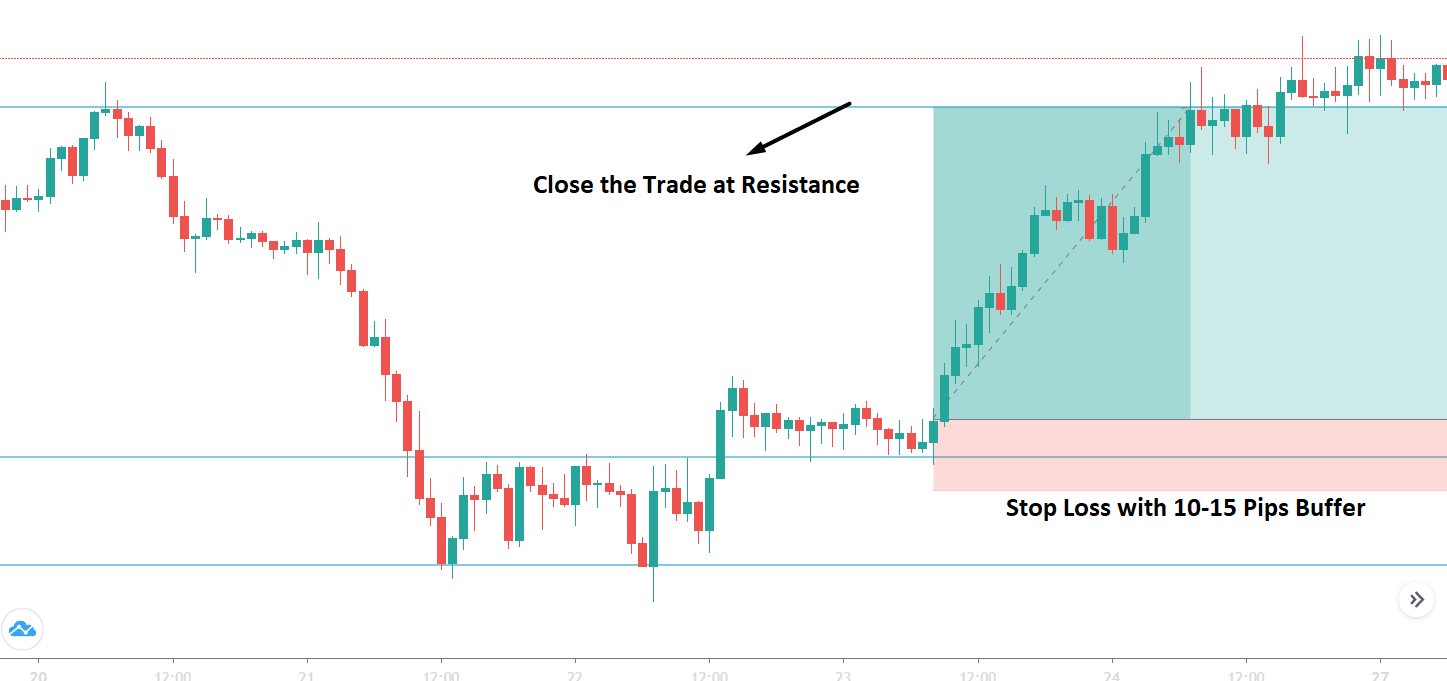
To enter the trade, you have to wait until the price comes down towards an event level with a corrective structure in 1 Hour timeframe. Enter the trade as soon as the price rejects and closes above the event level with a reversal candlestick.

Stop Loss

Put the stop loss below the recent swing low with 10-15 pips buffer. Here the buffer means you should put the stop loss 15 pips below the swing low.

Take Profit

The primary target of the take profit would be the next event level. However, if the bullish trend remains impulsive, you can extend the take profit. On the other hand, you can close earlier if the price barely creates new higher highs.

In the example below, we can see a visual representation of how to take the entry with stop loss and take profit level.

Bearish Price Action Trade Setups

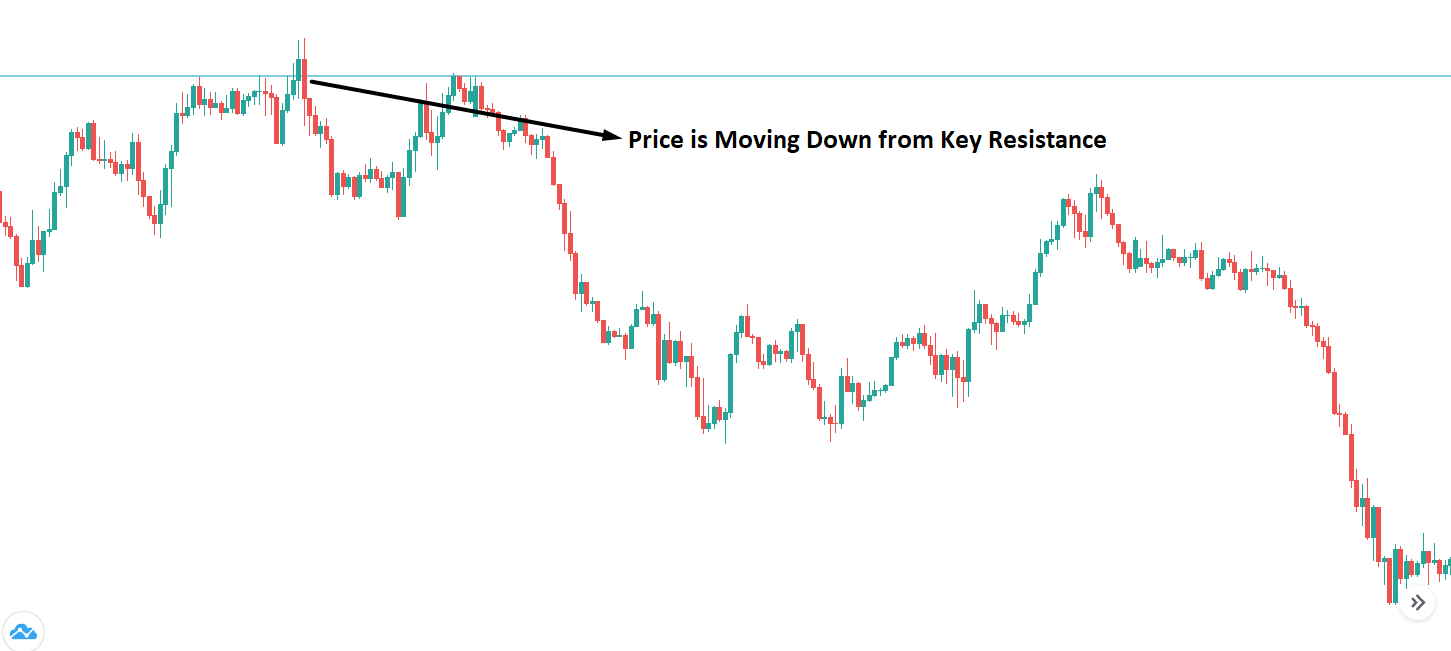
Find the market in an impulsive bearish pressure in H4 or daily timeframe. Identify the key resistance level and consider sell trades only as soon as the price is trading below it.

Entry

To enter the trade, you have to wait until the price comes down towards an event level with a corrective structure in 1 Hour timeframe. Enter the trade as soon as the price rejects and closes below the event level with a bullish reversal candlestick.

Stop Loss & Take Profit

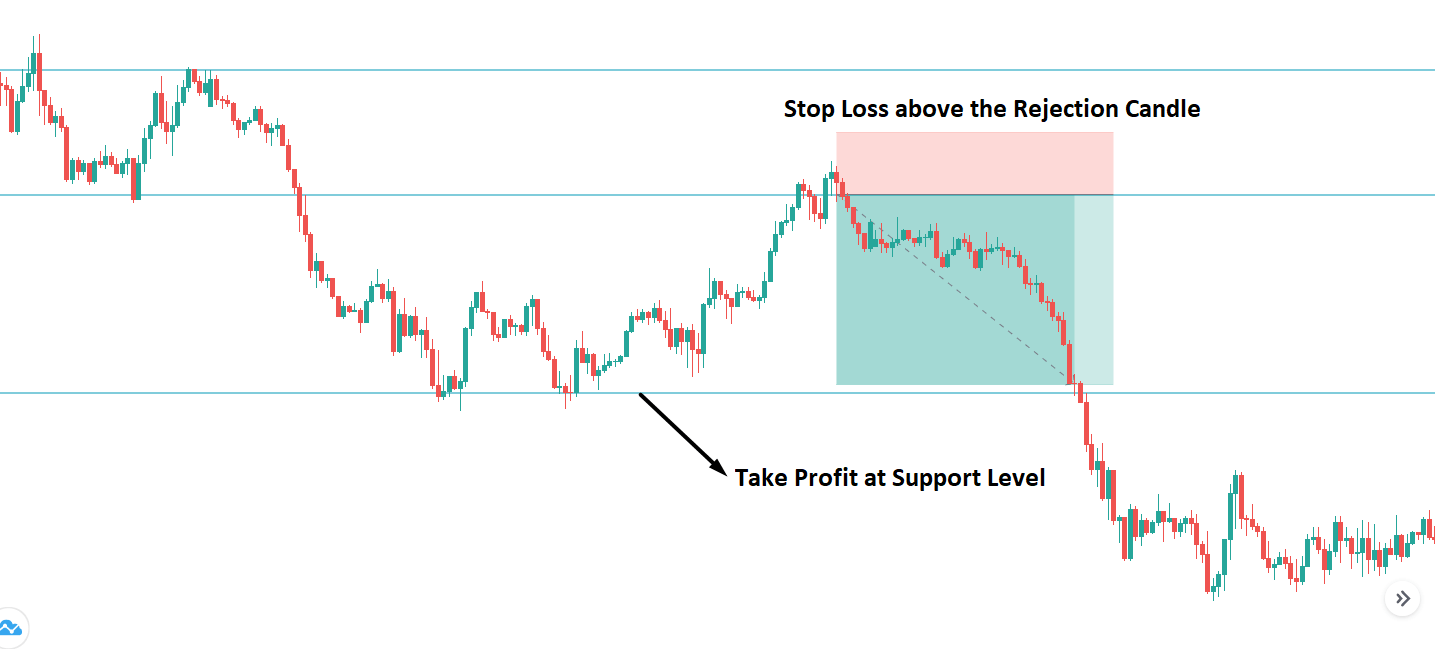
Put the stop loss above the recent swing high with 10-15 pips buffer. Here the buffer means you should put the stop loss 15 pips above the swing high.

The primary target of the take profit would be the next event level. However, if the bearish trend remains impulsive, you extend the take profit. On the other hand, you can close earlier if the price barely creates new Lower lows.

In the example below, we can see a visual representation of how to take the sell entry with stop loss and take profit level.

Final Thoughts – Trade Management Idea

In the above section, we have seen how to trade using the price action with context. In this trading strategy, buy and sell trades come after filtering out unusual market movements from the volatile market conditions.

However, no forex trading strategy in the world can guarantee a 100% profit, so your trades might go wrong even if you strictly followed all rules. If you want to grow your account with a consistent profit, you should follow strong trade management tools, as mentioned below:

  • Ensure that you are not taking over a 2% risk per trade of your trading balance.
  • Move your stop loss at breakeven as soon as the price creates a new higher high or lower low.
  • If you face a 3 or 4 consecutive losses, take a break and observe the market until it follows the trend accurately.
  • Make sure to keep your mind free from any bias while you are analyzing the market.

Overall, price action is the core element of trading that every trader should know. There are many trading strategies combining price action and other trading tools. The strategy we have seen above has a good history of providing profitable trades. Therefore, if you can implement it properly, you can consistently grow your trading account.

Categories
Candlestick patterns

Trading with Confidence Using Candlestick Patterns

Introduction

Previously, we had discussed how a group of different candlestick formations provides the necessary information to comprehend the market sentiment and evaluate the probability of a trend reversal, which could help traders in joining the start of the new trend. 

In this educational article, we’ll review how candlestick formations can be used to establish a trading strategy and which patterns could bring more confidence in the trading setups.

The Candlestick Patterns’ Usefulness

Candlestick patterns arise as a result of the price action at a determined range of time. Independently of the timeframe under visualization, e.g., weekly, daily, hourly, or even minute timeframe, the price never is a lagging indicator.  Furthermore, candlestick patterns tend to appear in every market and timeframe.

Trading Signals with Candlesticks Patterns

There exist a set of candlestick patterns that frequently appears in the financial markets across time, although the technical trader must consider the market context before consider if the candlestick represents a continuation or a reversion of the trend.

Hammer and Hanging Man

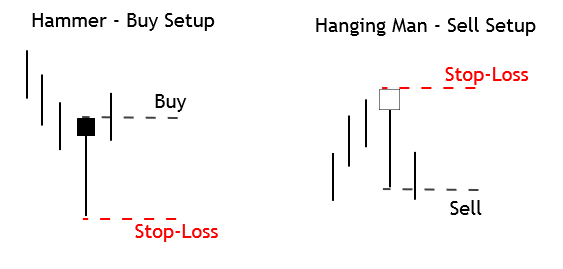
The hammer characterizes itself by presenting a large shadow and a small body located near the high of the day. When this pattern appears at the end of a bearish trend, it tends to be a bullish reversal signal.

When a hammer pattern shows up after a substantial descent, the technical trader may place a buy position on the next trading bar above the high of that hammer, placing its stop-loss below the low of the last day.

On the opposite side, the hanging man pattern arises when an uptrend ends. The sell setup will take place in the next session candle using the low of the hanging man candle as entry level, with a stop-loss above its high.

Engulfing Candlestick Pattern

The engulfing pattern is a formation constituted by two candles. The bullish engulfing pattern will occur at the end of a downtrend. During the trading session, the action takes place in a wide range. The price opens near the low of the day and closes near the high of the day, erasing the losses of previous trading session or sessions.

A bullish position will take place at the high of the previous day, with a stop-loss located below the low of the last trading session. A bearish position will occur at the low of the previous trading session, with a stop-loss order placed above the highest level of the engulfing candle.

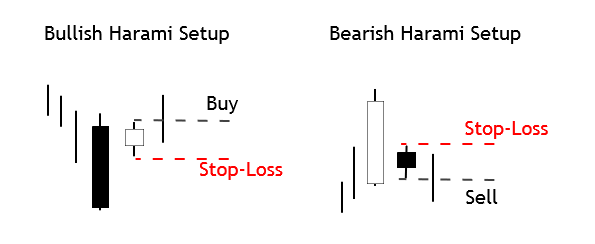
Harami Pattern

The harami pattern tends to indicate the change of the trend only when it appears at the end of a bull or bear leg. The Harami is the weakest form of a reversal pattern. 

A buy position will trigger if the price breaks and closes above the high of the day of the narrow range candle during the next trading session, the stop loss is to be placed below the low of the session in progress.

A sell position will occur if the price breaks and closes below the narrow range candle, and its stop-loss may be located above the highest level of the harami candle.

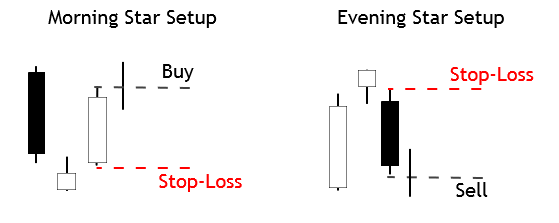
Morning Star and Evening Star Pattern

Both the morning star as the evening star pattern are formations that hold three candlesticks for its configuration.

The Morning star pattern is a bullish trend formation, which will activate a buy position above the high of the last trading session, with its stop-loss below the low of the previous day or candle.

The evening star pattern is a bearish formation, which will trigger a sell position below the third candle of the pattern, its stop-loss placed above the high of the last trading session.

Conclusions

In this educational article, we presented a group of candlestick patterns, which could increase the confidence in an entry setup. However, although the formation provides an entry-level and stop-loss, these formations don’t identify a profit target level. This context could not ensure the technical trader a risk to reward ratio at least one to one, reducing the profitability of any candlestick pattern.

To reduce this variability on the expected results, we remark the Fischer and Fischer conclusions; they unveil the advantage of the use of candlestick formations compared to bar charts, stating that candlesticks are easier to understand and most useful for short-term traders.

Finally, they conclude that the most reliable candlestick formations are the engulfing pattern, hammer, and hanging man. In this context, the technical trader should consider that before ramping up a trading strategy based on candlestick formations, it’s recommended to evaluate its performance, developing a statistical backtest before jumping in the real-market.

Suggested Readings

  • Fischer, R., Fischer J.; Candlesticks, Fibonacci, and Chart Patterns Trading Tools; John Wiley & Sons; 1st Edition (2003).
Categories
Forex Course Guides

Forex Course 3.0 – Complete Guide

Hello everyone,

Firstly, we want to thank you guys for following us throughout the course so well. We feel privileged that we are helping you guys in becoming better traders. Especially in Course 3.0, we have discussed some of the most crucial aspects of technical trading, which are essential for every aspiring technical trader to know. We have seen the quiz results for all the course articles that you guys have taken, and that gave us a gist of how well you’ll be following the topics discussed.

However, for the people who want to revisit a few topics, we would like to make their lives easier. So we are putting up a list of topics that we have discussed in this course. Also, this article will act as a quick revision guide for all the basics involved in Technical Analysis.

In this course, we have started by discussing the concept of Candlesticks and its fundamentals. Then we learned how to trade various candlestick patterns along with their importance. Introduction to Fibonacci trading has been done, and we also have paired the Fib levels with various indicators to generate accurate trading signals. We extended that discussion to Moving Averages and its types. Finally, we have learned the principles of indicator-based trading, where at least 10 of the most popular indicators have been discussed.

Below are the corresponding links for each of the topics that we have discussed in this course.

Candlestick Charts

Concept of CandlesticksIntroduction | Anatomy | Fundamentals

Trading Candlestick PatternsSingle Continuous | Single Reversal | Dual Continuous                                                   Dual Reversal | Triple Continuous | Triple Reversal

Deeper InsightCandlestick Patterns Cheat Sheet | Candlestick + S&R

Fibonacci Trading

Introduction | Entry Using Fib Levels | Challenges of using Fib levels | Fib + S&R Candlestick Patterns + Fib Levels | Fib + Trendlines | Fib for TP & Fib for SL | Summary

Moving Averages

Introduction | SMA | EMA | SMA vs. EMA | MAs to identify the trend | MA Crossover Strategy | MA + S&R | Summary 

Indicator-Based Trading

Introduction | Pros & Cons | Bollinger Bands | RSI | MACD | Donchain Channel | RVI | TSI | Stochastic | Ichimoku Cloud | Parabolic SAR | ADX | ATR 

With this, we have ended our Course 3.0, and soon we will be starting our Course 4.0, where we will be discussing some of the advanced topics in Technical Trading. So stay tuned and watch this space for more interesting and informative content. Cheers!

Categories
Forex Course

65. Combining Fibonacci Levels With Candlestick Patterns

Introduction

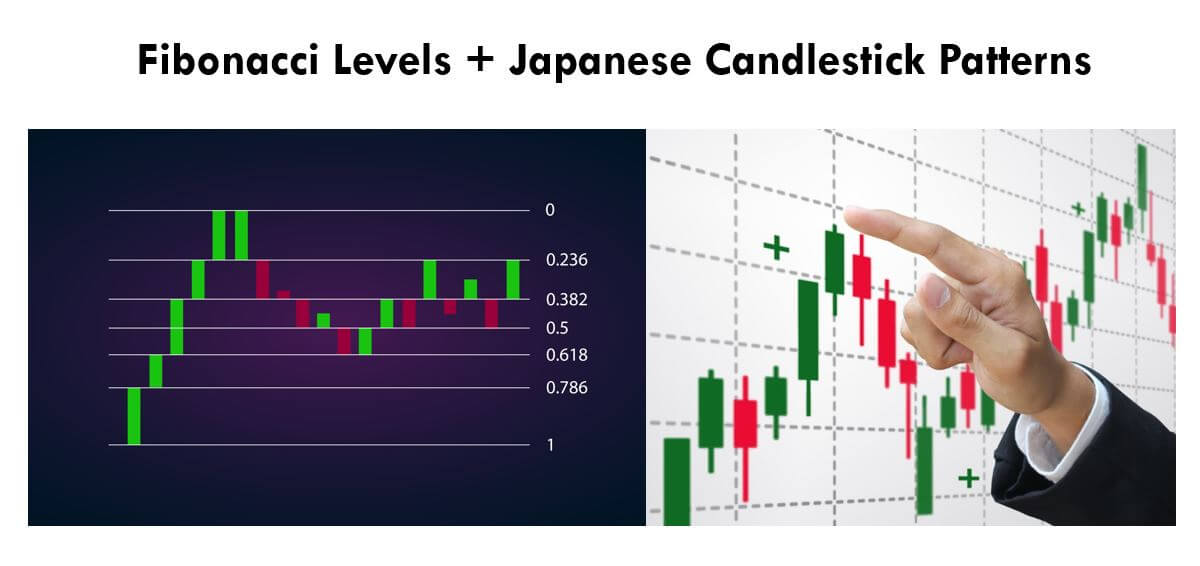
In the previous lessons, we understood how Fibonacci levels could be combined with trendlines to generate confirmation signals. After discussing many applications of the Fibonacci indicator, we are now ready to explore some complex strategies using these levels. In this lesson, we will be discussing how the Fibonacci levels can be used with Japanese candlestick patterns.

The candlestick patterns are an intrinsic part of trading, and we cannot ignore them. We have learned many candlestick patterns in the previous lessons, and you can find them starting from here. We have also learned that these patterns can not be used stand-alone, and we should be using any reliable indicators to confirm the signals generated by these patterns. So we will be using Fibonacci retracements to confirm the opportunities generated by the chart patterns.

For the explanation purpose, let’s discuss one of the most reliable candlestick patterns – Dark Cloud Cover. To know more about this pattern, you can refer to the second part of this article. We will be trading the market today by combining both Fibonacci levels and the Dark Cloud Cover pattern.

Strategy – Dark Cloud Cover Pattern + Fibonacci Levels 

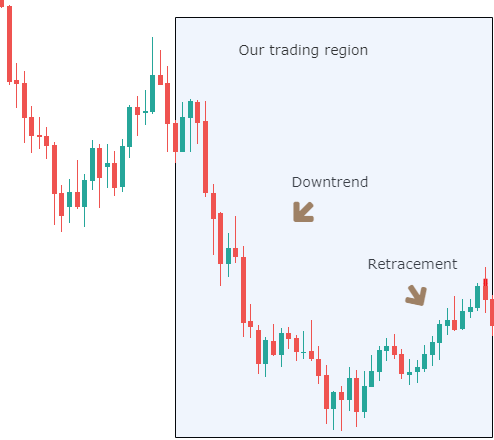
For explaining the strategy, we considered a downtrend, on which we will be plotting our Fibonacci indicator and later evaluate its retracement. The below chart shows the same with a trading region in which we will be identifying our swing high and swing low. We will also see if the retracement shown in the chart is going to react at the important Fib levels.

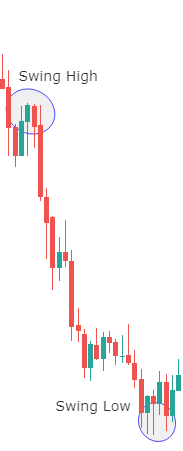
In the below chart, we can see the market has moved down quite swiftly from the swing high to swing low. This shows the strength of the underlying downtrend. Trading a retracement of a strong and big move on any side is always preferable. The next step is to plot the Fibonacci levels on the chart.

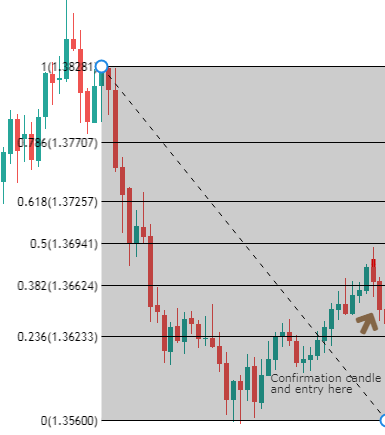
After the Fibonacci indicator is rightly plotted as shown in the below chart, let’s see what happens at the important Fibonacci levels, such as 50% or 61.8% level. In the chart below, we see that the last Red candle of the retracement exactly touches the 50% level and closes midway of the previous Green candle.

These two candles together remind us of one of the very well known candlestick patterns – The Dark Cloud Cover. More importantly, this pattern is formed exactly at the 50% Fib level. So if we get a confirmation to the downside, it could result in a perfect setup to go short on this pair.

In the above picture, we can clearly see the formation of a bearish confirmation candle. So we can confidently take short positions in the market by placing a stop-loss near the 61.8% level with a target below the recent low.

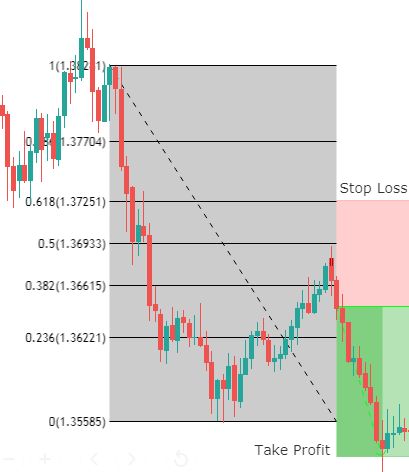
The above chart shows how the trade works in our favor by hitting our pre-determined ‘take profit.’ We can see that, right after the entry was made, the market moves so fast in the direction of the trend producing continuous red candles. This shows the accuracy of candlestick patterns when combined with indicators like Fibonacci. Since the market is still in a strong downtrend, aggressive traders can take profit at the second or third swing low of the trend, after crossing the initial ‘take-profit.

Conclusion

From the previous articles, we have seen how the Fibonacci tool can be used with support resistance levels, trendlines, and now even candlestick patterns. By this, we can be assured that the Fibonacci tool is potent and should never be underestimated. Instead, we recommend you to widen its usage in technical analysis to identify more accurate trading opportunities.

[wp_quiz id=”64541″]
Categories
Forex Course

58. Exploring More Candlestick Patterns – Cheat Sheet!

Introduction

In the previous lessons, we have discussed many candlestick patterns out of which some were single, some were multi-candlestick patterns (Dual & Triple). But there are many more patterns that one needs to be aware of. Since it is not possible to cover each and every one of them, we have picked some of the most profitable and important patterns everyone should be aware of. So, this article basically acts as a cheat sheet for any reference. By referring to this guide, one can get the basic price-action structure of all these important patterns that are mentioned below.

Hammer Candlestick Pattern

It is a single candlestick pattern signaling a possible reversal to the upside. The Hammer is mostly seen after a prolonged downtrend. On the day this pattern is formed, the market will be inclined towards the sell-side. As the candle comes to a close, the market recovers and closes near the unchanged mark or maybe a bit higher.


That is a clear indication of the market reversal. We must take trades only after the appearance of a confirmation candle and not before. So we see a bullish candle on the charts immediately after the Hammer pattern, consider buying the currency pair.

Doji Candlestick Pattern

This pattern is formed from a single candle and is considered a neutral pattern. A Doji represents the equilibrium between demand and supply. The appearance of this pattern indicates a tug of war in which neither the bulls nor the bears are winning.


In the case of an uptrend, the bulls will be winning the battle, and the price goes higher, but after the appearance of Doji, the strength of the bulls is in doubt. The opposite is true in case of a downtrend. If we come across this pattern, we must wait for extra confirmation to take any action.

Piercing Candlestick Pattern

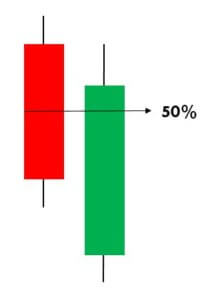
The Piercing Pattern is a two candle reversal pattern that implies a possible reversal from downtrend to an uptrend. This pattern is typically seen at the end of a downtrend. The second candle in the pattern must be bullish and should open below the low of the previous day and closing more than halfway into the previous day’s bearish candle.


We generally will have two options after noticing this pattern. Either we can buy the forex pair to benefit from the uptrend that is about to begin, or we can look at buying ‘options’ to reduce risk.

Engulfing Candlestick Pattern

It is two candle reversal pattern that is formed at the end of a downtrend or an uptrend. Bullish Engulfing Pattern is formed when a small ‘Red’ candlestick is followed by a large ‘Green’ candlestick that completely engulfs the previous day’s candle. For a Bearish Engulfing Pattern, the situation is vice-versa.


The shadows of the small candle should be preferably short, and the body of the large candle should overpower the entire previous day’s candle. When we come across a Bearish candlestick pattern, we must activate our sell trades and vice-versa.

Meeting Line Candlestick Pattern

This pattern is a two candle reversal pattern that occurs in a downtrend. The first candle must be a bearish candle followed by a second long bullish candle that gaps down and closes higher. It has the close at the same level as the close of the first candle.


This pattern only signals partial bullishness and buying strength, but not completely. Traders must look for other signs of reversal than just relying on the pattern stand-alone because just the Meeting Line pattern is not a clear confirmation for a complete reversal of the trend.

Harami Candlestick Pattern

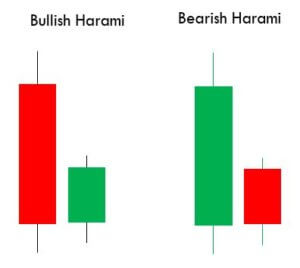
It is a dual candlestick reversal pattern indicating the reversal of a bullish or bearish trend. In Bullish Harami pattern, the first candle is usually a Red candle with a large real body, and the second one is a small Green Candle. It’s opposite in the case of a bearish Harami pattern.        

Traders must look at the appearance of a bullish Harami pattern as a good sign of taking long positions in the market. Likewise, we must be shorting once we confirm the appearance of the bearish Harami Pattern.

Three Black Crows Candlestick Pattern

This pattern consists of three Red candles and predicts the reversal of an uptrend. It does not occur very frequently, but when it occurs, we can be sure that the market is going to reverse.


The first candle in this pattern is a long bearish candle that appears in a prevailing uptrend. The second and third are also approximately the same size and color, indicating that bears are firmly in control. This pattern is most useful for long-term traders, who take short positions and hold them for several weeks.

Abandoned Baby Candlestick Pattern

It is a three candle reversal pattern that occurs during a downtrend. The first candle in this pattern is a bearish one. The second candle is a Doji, which gaps down from the previous candle. The third candle is a long bullish candle and opens above the second candle.


We must take long positions only if the price breaks above the third bar in this pattern. Also, make sure to use a stop-limit order for additional risk management.

Deliberation Candlestick Pattern

The Deliberation is a three-line bearish reversal candlestick pattern that occurs during an uptrend. This pattern is comprised of three bullish candles. The first and second candles have significantly large bodies than the third one.


This pattern signals a bearish reversal of the current uptrend. The confirmation is usually a Red candle that overcomes the midpoint of the second candle’s body. We can take aggressive short positions in the currency pair right after we notice the confirmatory candle. This pattern is rarely seen on the price charts, but it does appear, it is highly rewarding.

Three Line Strike Candlestick Pattern

We have discussed single, dual, and triple candlestick patterns till now. Three Line Strike is the first four candlestick pattern, which signals the continuation of the current trend. This pattern can be found in both bullish and bearish markets, depending on the trend.

In an uptrend, the first, second, and third are bullish, and each candle needs to close above the previous candle. The fourth candle is bearish and closes below the open of the first candle. We can take long positions only after the trend is confirmed by technical indicators like RSI & MACD

Learning to recognize and interpret candlestick patterns is important for anyone who aspires to be a professional technical trader. Perfecting this skill will take time and practice. But once you master these patterns, you can trade with enough confidence as you will know how to read the market better.

That’s about candlestick patterns and how to trade them. In the upcoming lesson, we will see how to trade candlesticks using support and resistance levels. We hope you practice these patterns better and become a better trade. Kindly let us know if you have any questions in the comments below. Cheers.

[wp_quiz id=”61830″]
Categories
Forex Course

57. Trading Triple Candlestick Patterns – Part 2 (Reversal)

Introduction

We have discussed some of the major triple candlestick continuous patterns in the previous articles. In this lesson, let’s talk about the triple candlestick reversal patterns. Morning Star and Three Inside Up patterns are very well known as they provide some of the most profitable signals. Let’s get right into the topic.

Morning Star Candlestick Pattern

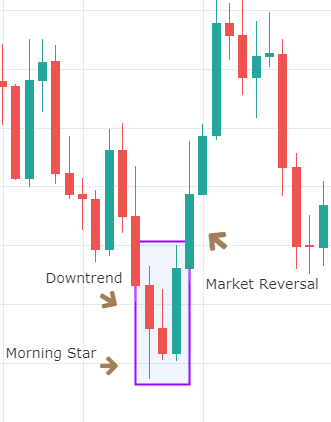
Morning Star is a bullish candlestick pattern consisting of three candles and is interpreted as a bull force. The pattern is formed following a downtrend and indicates the start of an uptrend, which is a complete reversal. After an occurrence of the Morning Star, traders seek reversal confirmation through additional technical indicators. The RSI is one such indicator which tells that the market has gone into an oversold condition and that a reversal can happen anytime.

Below is how a Morning Star Pattern looks like on a price chart

Criteria for the Morning Star pattern

  1. The first candle is a long bearish candle with little or no wicks.
  2. The second candle is a smaller bullish or bearish candle that captures the indecision state of the market, where the sellers start to lose control.
  3. The third and last candle is a long bullish candle that confirms the reversal and marks a new uptrend.

A trader must lookout for a bullish position in the Forex pair once they identify the Morning Star pattern on the charts. Another important factor for traders to consider is to pair this pattern with a volume indicator for additional confirmation.

Three Inside Up Candlestick Pattern

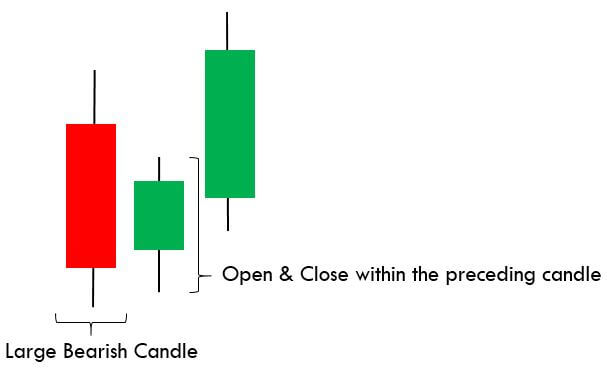
The Three Inside Up is also a triple candlestick reversal pattern. This pattern indicates the signs of the current trend losing momentum, and warns the market movement in the opposite direction. It is a bullish pattern that is composed of large bearish candle, a smaller candle contained within the previous candle, and then a bullish candle that closes above the second candle.

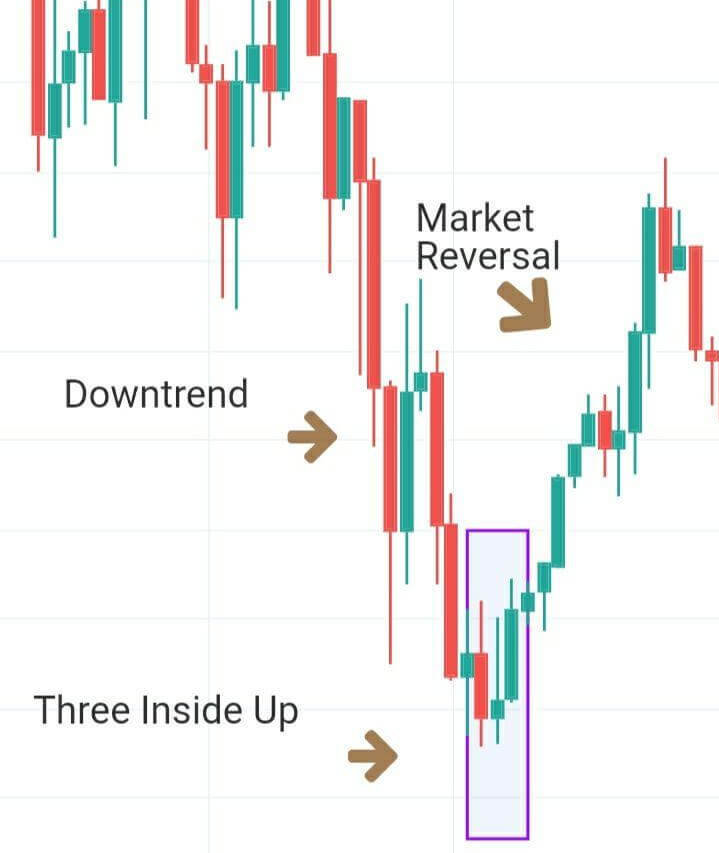
Below is the picture of how the Three Inside Up pattern would appear on a chart.

Criteria for the pattern

  1. The market should be in a downtrend with a large bearish first candle.
  2. The second candle should open and close within the real body of the first candle, which shows that sellers have stopped selling further.
  3. The third candle is a bullish candle that closes above the second candle, trapping all the short-sellers and attracting the bulls.

Traders must take long positions at the end of the third candle or on the following green candle, which provides additional confirmation. This pattern is not always reliable when used stand-alone. So there are chances that the trend could reverse once again quickly. So risk management should be in place before taking any trades. A stop-loss must be placed below the second candle, and it depends on how much risk the trader is willing to take.

Conclusion

The opposite of the Morning Star candlestick pattern is the Evening star. Even this is a reversal pattern, but it signals a reversal of an uptrend into a downtrend. Likewise, the opposite of the Three Inside Up pattern is the Three Inside Down pattern, which reverses an uptrend. Learn about more triple candlestick patterns and how to trade them. The more you research, the better trader you will be. Cheers.

[wp_quiz id=”61446″]
Categories
Forex Course

55. Learning The Dual Candlestick Patterns – Part 2 (Reversal)

Introduction

In the previous lesson, we learned Continuous Dual Candlestick Patterns by taking examples of the two most traded patterns. In this lesson, we will see how to generate trading signals using Dual Candlestick reversal patterns. We will mainly look at the two widely used dual candlestick patterns – Engulfing and Dark Cloud Cover patterns. As the names suggest, both of these patterns consist of two candlesticks, and when we see them on a price chart, we should be anticipating a trend reversal shortly.

Engulfing Candlestick Pattern 

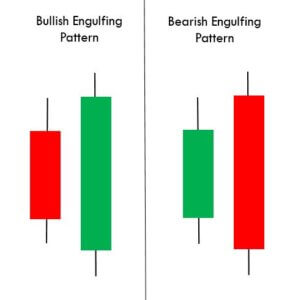
Engulfing is a two-candle trend reversal pattern. It got its name from the fact that the second candle completely engulfs the first candle, irrespective of its size. There are both Bullish Engulfing and Bearish Engulfing patterns. A Bullish Engulfing can be identified when a small (preferably) red candle of the downtrend is followed by a large green candle that overpowers the previous candle entirely. Vice-versa for a Bearish Engulfing Pattern.

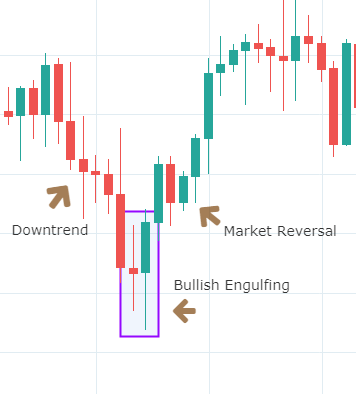
Below is the picture of how the Bullish Engulfing pattern looks like on a chart.

Criteria for the pattern

  • The body of the second candle should be at least twice the size of the first candle.
  • Even though it is a dual-candlestick pattern, Bullish Engulfing gives the best reversal signals when the bullish candle engulfs the bodies of four or more previous candlesticks.
  • It is better if the Engulfing candle does not have any upper wicks. This shows the buying interest among investors and increases the likelihood of Green candles in the following days.

The Bullish Engulfing Pattern is a powerful reversal pattern that has the potential to reverse the current downtrend and turn it into an uptrend. Hence, traders always look out for this pattern and take big positions in the market by adding to their ‘long’ positions.

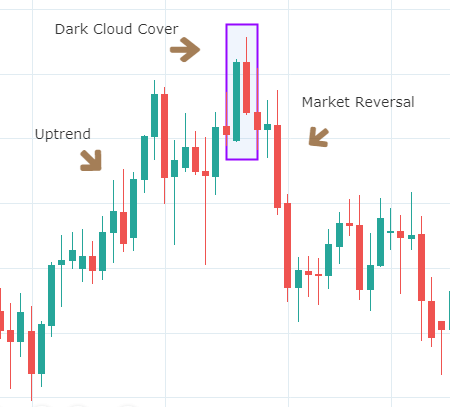
Dark Cloud Cover Candlestick pattern

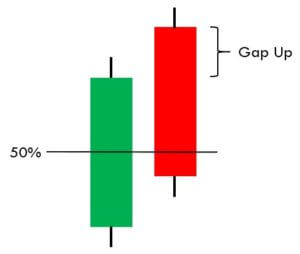
The Dark Cloud Cover pattern is a bearish reversal candlestick pattern that is formed from two candles. In this pattern, the Red candle opens above the close of the prior candle and then closes below the midpoint of the previous green candle.

This pattern implies that buyers are trying to push the price higher, but sellers finally take over and push the price sharply down. A shift in momentum causes the trend to reverse, and this marks the beginning of a new downtrend.

Below is an image of the Dark Cloud Cover pattern that makes a reversal of the trend.

Criteria for the pattern

  1. The first requirement is to have an uptrend that is clearly visible on any chart.
  2. The second candle should be a gap up that, by the end of the day, comes down and closes as a bearish candle.
  3. The bearish candle needs to close below the midpoint of the previous bullish candle.

Traders usually wait for confirmation before taking aggressive short positions in the underlying Forex pair. The confirmation is just another Red candle following the first Red candle. On the close of the third candle, traders sell the currency and exit on the following days as the price continues to decline. They place stop-loss just above the high of the bearish candle.

Conclusion

The Engulfing pattern is a bullish reversal pattern, which is one of the easiest patterns to identify and trade. Talking about the bearish reversal Dark Cloud Cover pattern, it has the potential to identify the lower lows and lower highs, which is very rewarding on the downside. This was about the Dual Candlestick reversal patterns. Please explore more patterns of this kind to increase your exposure. In the next lesson, we will talk about the triple candlestick patterns and their types. Cheers!

[wp_quiz id=”60890″]
Categories
Forex Course

54. Learning The Dual Candlestick Patterns – Part 1 (Continuous)

Introduction

In the previous article, you were made familiar with different single candlesticks patterns that gave both continuous and reversal signals. In this article, we shall acquaint ourselves with the rest of the most popular double and triple candlestick patterns. In the following sections of the article, we will talk about the continuous double candlestick patterns – Tweezer Tops and Bottoms & Harami. Both of these candlestick patterns involve two candles, and they indicate signs of trend continuation in the market.

Tweezer Tops and Bottoms Candlestick Pattern

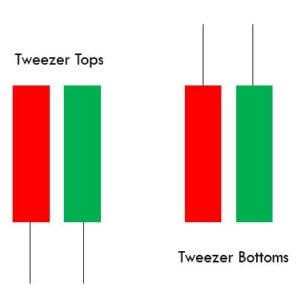
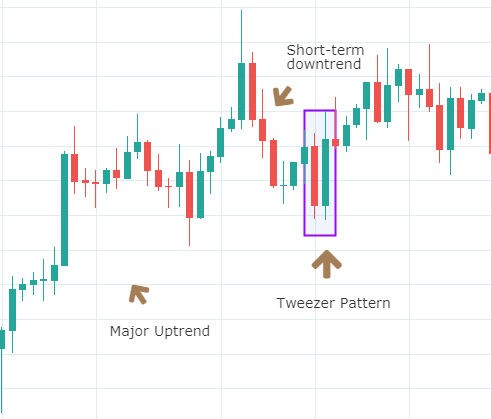
Tweezer patterns are double candlestick patterns that indicate a continuation of the current trend. But a broader context is needed to confirm the signal since Tweezers can occur frequently. A topping pattern occurs when the highs of two candlesticks occur at almost exactly the same level following a bullish candle. A bottoming pattern occurs when the lows of two candlesticks occur at almost exactly the same level following a decline in price.

The idea behind the topping and the bottoming pattern is that the first candle shows a strong move in the direction of the short term trend. While the second candle may be a pause or even a candle that completely reverses the previous day’s action. It means a short-term shift in momentum has occurred, and the price moved in the direction of the long term trend.

The image below shows how the pattern looks and explains the concept clearly.

Charts are taken from Tradingview

Pattern Confirmation Criteria

  • The first candle needs to have a large real body, i.e., the difference between open and close should be preferably big.
  • The second candle can be of any size. But if it is larger than the previous candle, the price can accelerate soon in the same direction.

Traders view this pattern as a potential sign of trend continuation and enter into a new position depending on the broader trend, with a minimum stop loss.

Harami Candlestick Pattern

Harami is a candlestick pattern that is formed by two candlesticks and indicates a continuation in the trend. Let’s discuss the Bullish Harami pattern to understand this concept better. A Bullish Harami Pattern essentially shows that the short term downtrend in an asset is coming to an end, and the market may continue its uptrend.

The pattern is formed by a long candlestick followed by a relatively smaller body. The second candle is completely contained within the vertical range of the previous body.

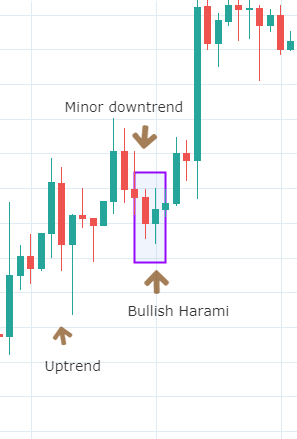
The chart below shows a Bullish Harami pattern. The few candles before the pattern indicate a short term downtrend in the currency, and the Green candle represents a slightly upward trend, which is wholly contained within the previous candle.

Charts are taken from Tradingview

Pattern Confirmation Criteria

  • It is necessary to have initial candles that indicate a clear short-term downtrend and that a bearish market is pushing the price lower.
  • The second candle needs to close near the middle of the previous candle, signaling a higher likelihood that a reversal of this downtrend will occur, and the price will move in the direction of the major uptrend.

Traders look at the appearance of the Bullish Harami pattern as a good sign of entering into a long position on an asset. This pattern is also combined with single candlestick patterns for confirmation signals. The opposite is the case for Bearish Candlestick Patterns.

While Tweezer Tops patterns are more flexible and easy to identify, Harami has a mandatory requirement of a ‘Doji’ (Candles with tiny body and long shadows) as the second candle. Both of these are trend continuation patterns with a high degree of accuracy. There are many more dual candlestick trend continuation patterns which you should be researching on your own. In the next lesson, we will be discussing double candlestick trend reversal patterns. Cheers!

[wp_quiz id=”60881″]
Categories
Candlestick patterns Forex Candlesticks

Candlestick Reversal Patterns V – The Morning Star and the Evening Star

The Morning Star and the Evening Star

The morning Star and the Evening Star formations are patterns made of three candlesticks. The original candlestick patterns were made on the Japanese rice futures trading and were created for daily timeframes. Thus, they could depict gaps from the previous close to the next open. The Star was a small real body – white or black – that was gaping away from a previous large body. The only place where that could occur in the Forex markets is during weekends. Thus, what is required to form a star in Forex is a small body, the smaller, the better, at the end of a large body, preferably with large shadows.

The Morning Star

The Morning Star is a three-candle formation at the bottom of a descending trend. In astronomy, Mercury is the morning star that foretells the sunrise and the arrival of the day. That was the name the Japanese gave to the formation, as they consider it to be the precursor of a new uptrend.

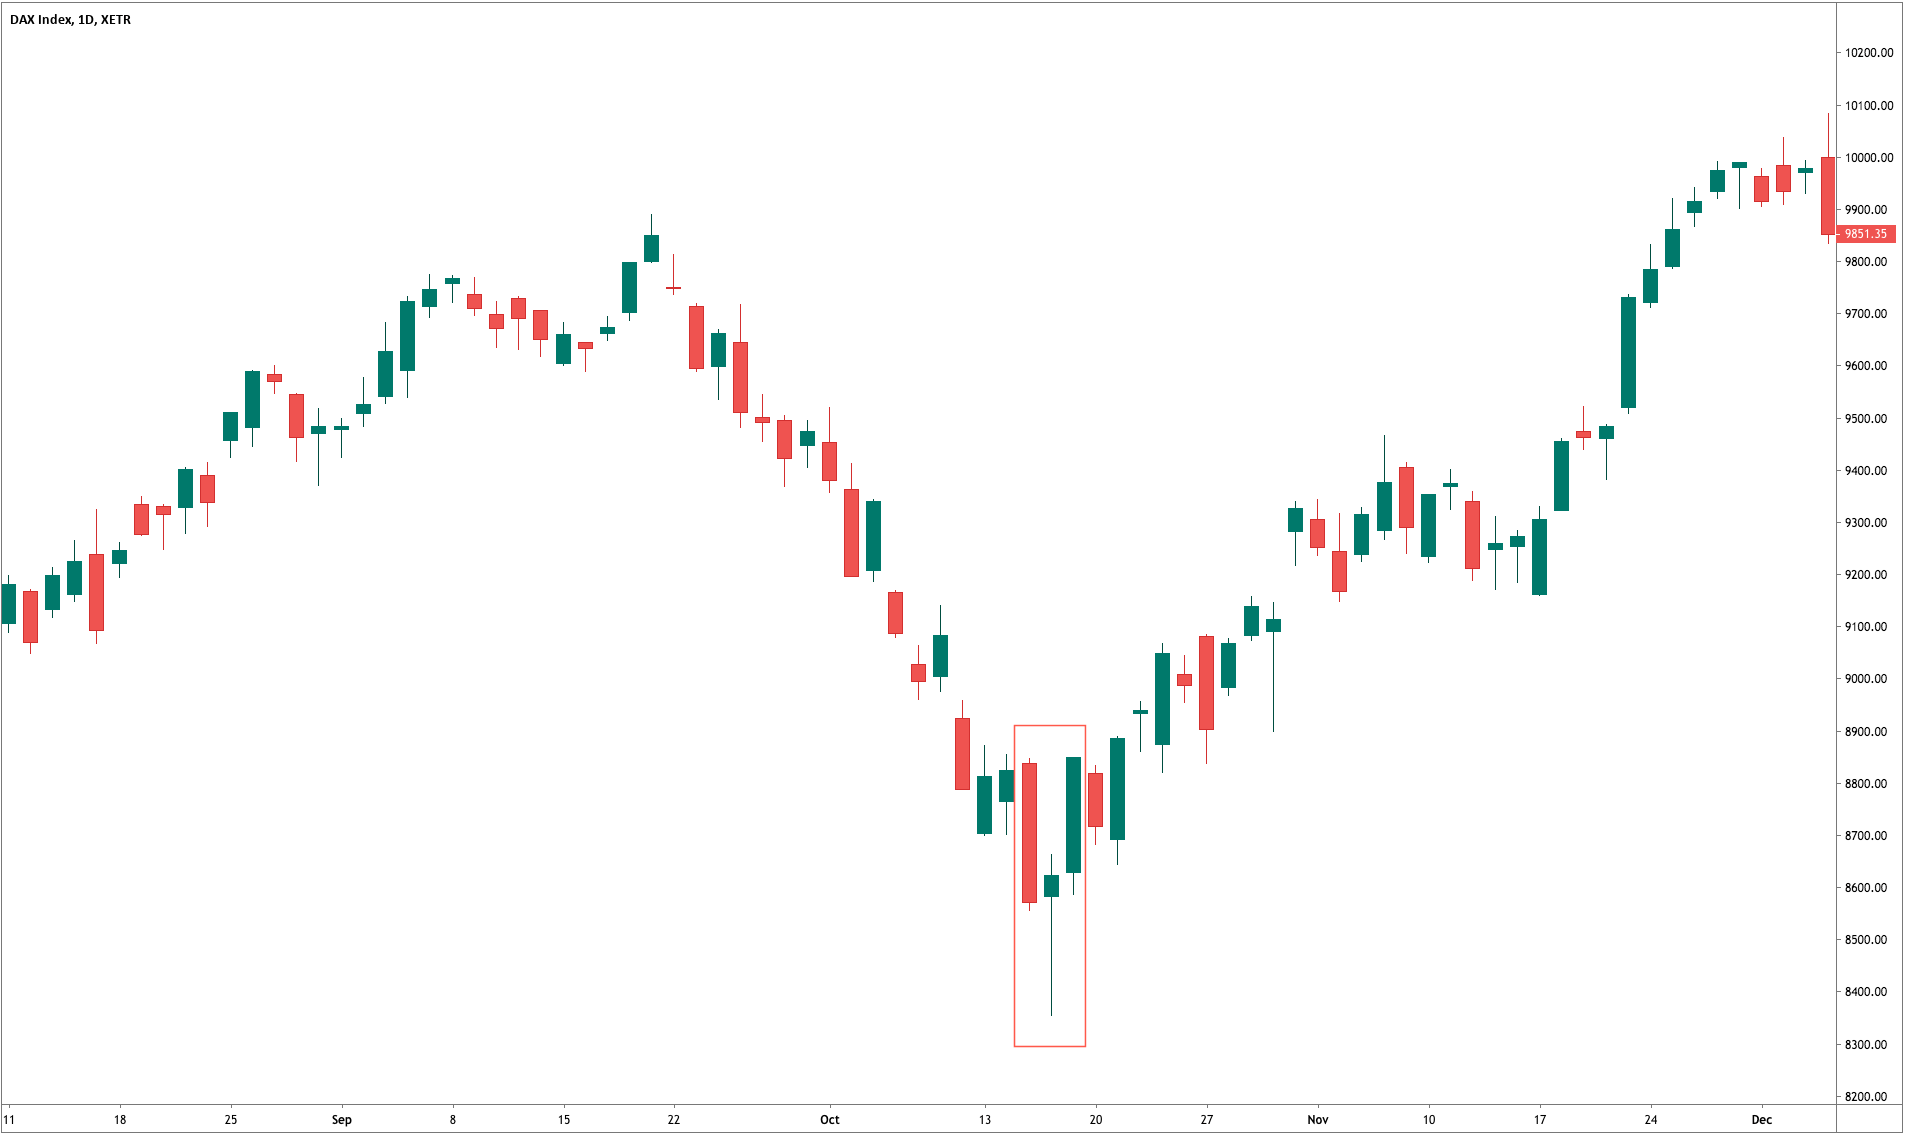
As said, it is formed by three candlesticks. The first one is a large and black candlestick. The session day the price starts with a gap down (or just at the close in Forex) continues moving down for a while, then it recovers and closes near the open, creating a tiny body. The third day is a white candlestick that closes near the open of the first black candlestick. The important factor in the signal is the confirmation of buyers after the star candle is formed. The close of the third day should, at least, cross the halfway up to the black candle body, as in the case of a piercing pattern. 

Chart 1 – Morning Star on the DAX-30 Index (click on it to enlarge)

Criteria for a Morning Star 
  1. The downtrend was evident
  2. The body of the first candle continues with the trend (black)
  3. The second candle is a short body figure showing indecision
  4. The third day the candle closes at least above 50 percent the body of the black candle.
  5. The larger the black and white candles, the better.
  6. A gap is desirable but doesn’t count on it on 24H markets
  7. A high volume in the first and third candles would be good signs of a selloff and consequent reversal.
Market Psychology

As in most bullish reversals, the first day, the hopeless bulls capitulate with a significant drop and substantial volume. The next day the power of the sellers stops in a short-bodied candle. The third day began bullish, touching the stops of the late short-sellers, and also caused by the close of positions of profit-takers. That fuels the price to the upside, making more short sellers close their positions -buying- and pushing up further the price. At the end of the day, buyers take control of the market action closing with a significant white candle on strong volume.

The Evening Star

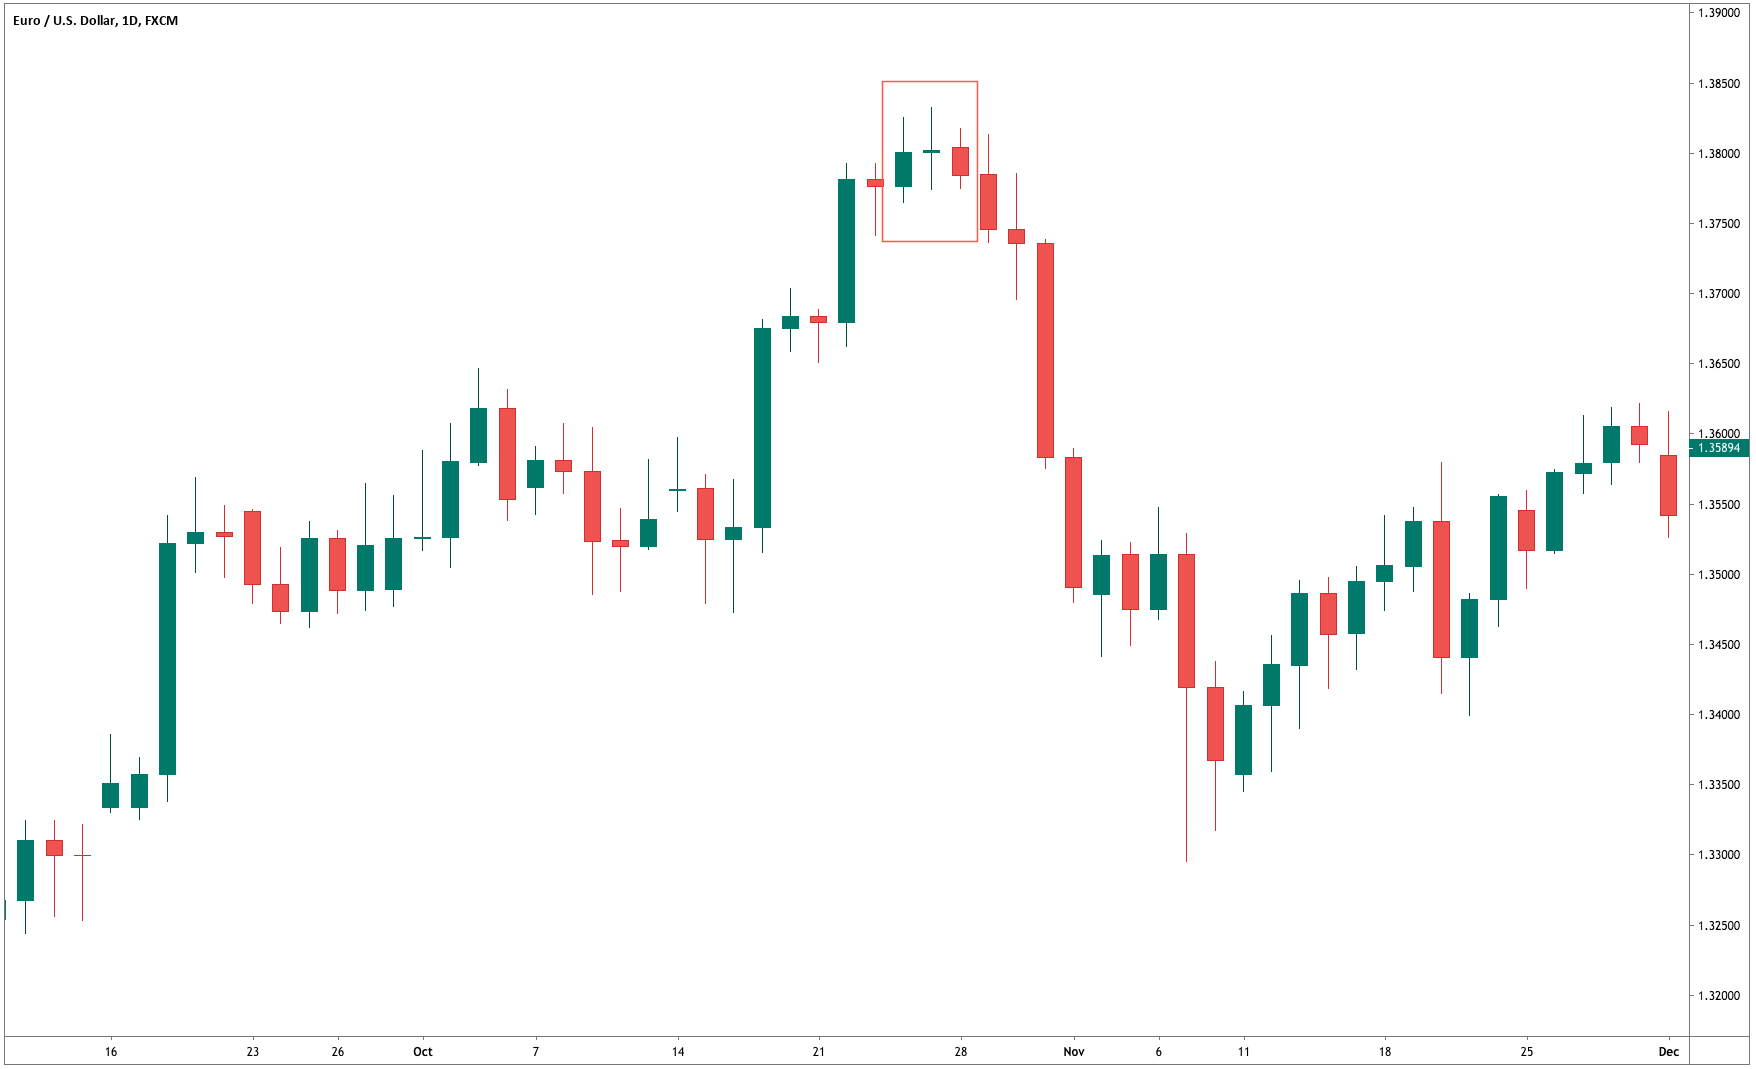
The Evening star is the reciprocal of the Morning star, and even more so, when trading pairs in the Forex market, or any pair, for that matter. In this case, the Japanese linked this formation with the Venus planet, as the precursor or the night. It is created when a long white candle is followed by a small body and a large black candle.

As the case of the Morning Star, a gap up on the second small-bodied candle followed by a gap down on the third black candle is further confirmation of a reversal, but that seldom happens in the Forex Market.  Also, the third candlestick is asked to close below 50 percent of the body of the first white candle.


Chart 2 – Evening Star on the EURUSD Pair (click on it to enlarge)

Criteria for an Evening Star
  1.  The upward trend has been showing for some time
  2. The body of the first candle is white and large.
  3. The second candlestick shows indecision in the market
  4. On the third day, it is evident that the sellers have stepped in and closes below 50 percent of the initial white candle.
  5. The longer the white and black candles, the better
  6. A gap before and after the second candle is desirable, although not attainable in Forex.
  7. A good volume in the first and third candles is also desirable.
Market Psychology

The uptrend has attracted the buyers, and the last white candle has seen an increasing volume. In the next session, the market gapped of continue moving up for a while, catching the last stops by short-sellers, but suddenly retraces and creates a small body, with the close next to the open. The next day there is a gap down makes the stops of the long positions to be hit, adding more selling pressure to the profit takers and short-sellers. The day ends with a close that wipes most of the gains of the first white candle, that shows that the control is in the hand of sellers.


Reference: Profitable Candlestick Patterns, Stephen Bigalow


Categories
Forex Course

53. Trading The Single Candlestick Patterns – Part 2

Introduction

In the previous lesson, we discussed some basic single candlestick patterns, which gave us trend continuation signals. In this lesson, we will look at reversal patterns that are formed by a single candlestick and how traders should perceive them.

These patterns are very important to learn as they indicate clear market reversals. So essentially, when we find these patterns on the charts, we should anticipate a reversal and take our trades accordingly.

The Hanging Man Candlestick Pattern

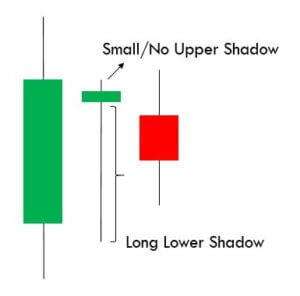
A Hanging Man is a single candlestick pattern that occurs during an uptrend. They give warning signals that markets are going to fall. This candlestick pattern is composed of a small body, a long lower shadow, and no upper shadow. Since it is a reversal pattern that reverses the current uptrend, The Hanging Man indicates the selling pressure that is starting to increase. Below is how the Hanging Man candlestick would look like.

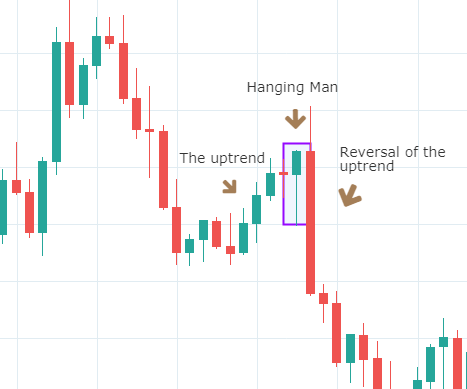
Below is a picture of how this pattern would like on the chart and how the trend reversal takes place.

Pattern Confirmation Criteria

  • Hanging Man is a single candlestick pattern that forms after a small rally in the price. The price rally can also be big, but it should at least be composed of few candles moving higher overall.
  • The candle must have a small body and a lower shadow at least twice the size of the real body.
  • This pattern is only a warning and a bearish candle after the formation of this pattern is highly desired. This is necessary for the Hanging Man pattern to prove to be a valid reversal. This is called confirmation.

The Hanging Man pattern is used by traders to exit long positions or enter into new short positions. After entering for a short position, stop loss can be placed above the high of the Hanging Man candle.

The Shooting Star Candlestick Pattern 

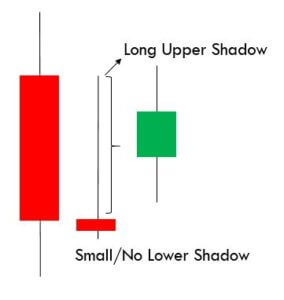
A Shooting Star is a bearish single candlestick pattern which also indicates a market reversal. It has a long upper shadow with little or no lower shadow and a small body.

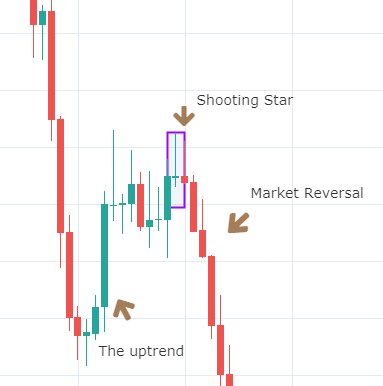
This pattern typically occurs after an uptrend and forms near the lowest price of the day. The Shooting Star pattern can be seen as the market creating potential resistance around the price range. It implies that the sellers stepped in, erasing all the gains, and pushed the price near the open. Basically, at the appearance of this pattern, buyers are losing control, and sellers are taking over.

Below is a picture of how the pattern would look like on a chart

Pattern Confirmation Criteria

  • The pattern must appear after an advance in price. The price must rally in at least alternate green and red candles if not in all green candles.
  • The distance between the highest price of the candle and the opening price must be twice the length of the body of the candle.
  • It is best if there is no shadow below the body of the candle.

Traders should not take immediate action after the formation of this pattern. They should wait to see what the next candle does following the Shooting Star. If they see a further price decline, they may sell or short that currency pair. However, if the price continues to rise, it means the uptrend is still intact. So traders must favor long positions over shorting.

The difference between the Hanging Man and the Shooting Star is in the length of upper and lower shadows along with the context. By now, we have understood how continuous and reversal single candlestick patterns work. In the upcoming lessons, we will be learning dual candlestick patterns and their implication. Cheers!

[wp_quiz id=”60770″]
Categories
Forex Course

52. Trading The Single Candlestick Patterns – Part 1 (Continuous Patterns)

Introduction

In the previous article, we have discussed the basics of candlestick patterns. We also understood that there are different candlestick patterns like single, dual, and triple depending on how many candlesticks are involved. We also know that in each of these types, there are continuous and reversal patterns.

In this article, let’s discuss ‘Single Continuous Candlestick Patterns.’ As the name suggests, a single continuous candlestick pattern is formed by just one candle, and the appearance of this pattern indicates that the trend will continue in its actual direction. This means the trading signal generated by this pattern is based on a single candle’s trading action. The trades taken based on a single candlestick pattern can be extremely profitable, provided the pattern has been identified and executed correctly.

Now let’s see an example of one of the most important single continuous candlestick patterns.

The Marubozu Candlestick Pattern

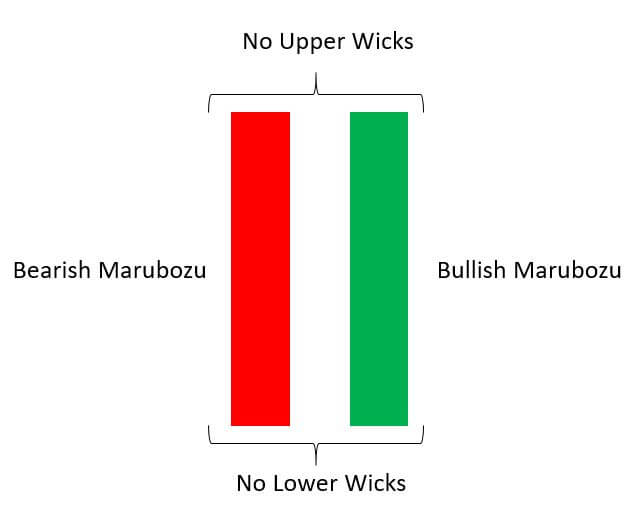
Marubozu is a candlestick with no upper and lower shadow (appearing bald). Essentially, this pattern has a single candle with just the real body, as shown below.

The Marubozu candle can be both bullish and bearish, depending on the major trend. The Marubozu, in an uptrend, suggests that the buying strength of the currency pair is still prevailing in the market, and the trend is supposed to continue. The same is the case if it appears in a downtrend (Bearish Marubozu), which is a sign of trend continuation.

As always, a Red candle represents Bearish Marubozu, and a Green candle represents Bullish Marubozu.

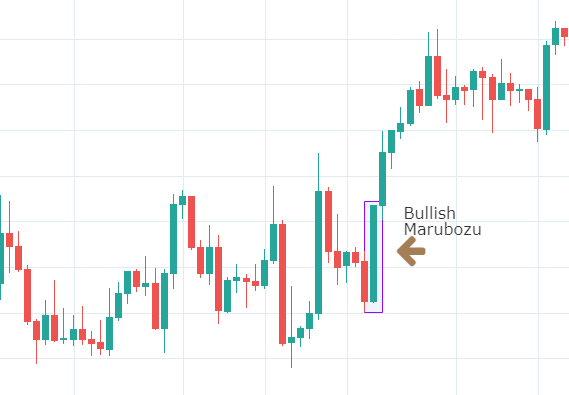
Below is the picture of how the Marubozu pattern looks on a price chart.

A bullish Marubozu indicates that there was so much buying interest in the currency that the market participants were willing to buy the currency at every price point during the day (considering a daily time frame chart). The buying interest is so much that the pair closed near its highest point for the day. So, when such a pattern appears on the chart, it is recommended to build long positions in that Forex pair with appropriate stop-loss and take profit.

The Spinning Top Candlestick Pattern 

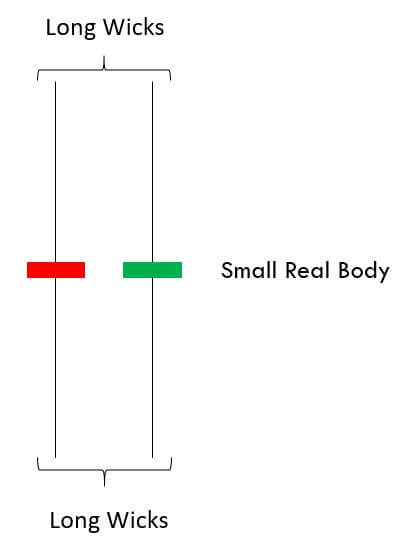
The Spinning Top is a very interesting candlestick pattern. Unlike other patterns, the Spinning Top is not specifically a continuous or reversal pattern. It can be indicating both depending on the market condition. A Spinning Top is a candlestick with a small real body and upper & lower wicks being identical in size.

It basically conveys the market indecision as both bulls and bears weren’t able to influence the market. When a trader encounters this pattern in a trending market, he/she needs to be prepared for two situations:

  • Either there will be another round of huge buying or selling
  • Or the markets could reverse significantly in either direction

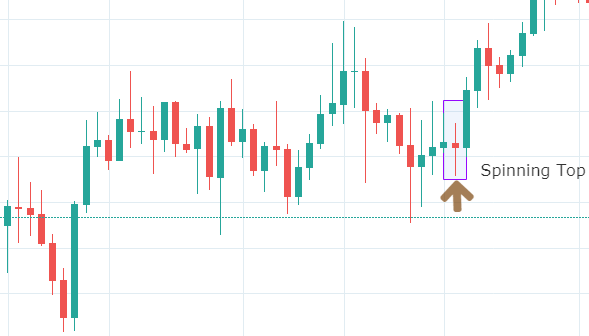
Below is how the Spinning Top Candlestick pattern appears on a price chart.

During such uncertainty, it is recommended to trade in the options segment of the market to profit from this candlestick pattern.

This was about single candlesticks patterns and their significance. There are many more single candlestick patterns, but we hope you got the gist. We recommend you research and learn as many single patterns as you can on the internet. In the upcoming articles, we will look into some of the reversal single candlestick patterns and how they are different from the continuous patterns we discussed today. Cheers!

[wp_quiz id=”60570″]
Categories
Forex Course

51. Fundamentals Of Candlestick Patterns

Introduction

In the previous course lessons, we have discussed the basics of candlesticks along with the pros and cons of using them. From this lesson, we will learn the basic candlestick patterns and their usage. As discussed, the idea of candlesticks charts has started in Japan in the late 1870s. These charts were then introduced to the outside world by Steve Nison through his first book, ‘Japanese Candlestick Charting Technique.’

In this lesson, let’s discuss the primary advantage of using candlestick charts. Although a single candlestick gives us many details about the price movement of an asset, a sequential set of candlesticks is more powerful. These sets are also known as patterns in simple trading language, and using these patterns, traders across the world take trading decisions.

Expert traders have decoded many such patterns and rigorously backtested them to analyze what those patterns will eventually result in. They also examined how the market direction will change after the appearance of these patterns on the charts. Now, let’s see the different candlestick patterns one must know.

Different types of candlestick patterns

There are single, dual, and triple candlestick patterns depending on how many candlesticks are involved in them. For example, if there are the candlestick pattern is formed by three candlesticks, it is known as the triple candlestick pattern. Every single pattern has its own significance and can be found in most of the Forex charts.

The main intention of identifying any candlestick pattern is to understand the further price movement in the market. Hence these patterns are classified into two different types – Continuation Patterns & Reversal Patterns. When we identify a continuation candlestick pattern on the chart, it means that the market will continue in the same direction as the underlying trend. Contrarily, if we identify a reversal pattern on the charts, we can expect the price to change its direction. Also, these patterns are internally classified as bullish and bearish continuous/reversal patterns, which will be discussed in the upcoming lessons.

Examples of Continuation Candlestick Patterns

  • Deliberation Pattern
  • Concealing Baby Swallow Pattern
  • Rising Three Methods Pattern
  • Separating Lines Pattern
  • Doji Star Pattern

Examples of Reversal Candlestick Patterns  

Some of these are single candlestick patterns, while some are multiple candlestick patterns. We shall be discussing each of these patterns in detail in our future articles.

Psychological context of candlestick patterns

The candlestick patterns demonstrate the psychological trading that takes place during the period represented by a single or multiple candles. We need to start imagining the price movement as a battle between buyers and sellers. Typically, Buyers expect that prices will increase and drive the price up through their trades. Whereas sellers bet on falling prices and push the price down with their selling interest.

Also, the Japanese gave very visual names to these patterns so that it impacts the mentality of a trader. For instance, pattern names like Hanging Man and Dark Cloud Cover represent negativity, while the patterns like Three White Soldiers and Morning Star indicate positive market results. Hence, as soon as we hear the names of these patterns, our sub-conscious memory will know whether the forecast of the market is positive or negative.

Benefits of trading candlestick patterns

Although initially conceived for daily timeframes, Candlestick patterns can be used by swing traders, day traders, and even long term investors. Below are some of the significant advantages of these patterns.

  • They are very easy to identify and comprehend. They provide a detailed description of the occurrences and happenings in the markets.
  • Interaction between the buyers and sellers can easily be understood just by reading the pattern and without having to analyze the market entirely.
  • Candlestick patterns can be used in conjunction with other indicators for extra confirmation on the trading signals generated.
  • They display reversal patterns that cannot be seen in other charts like Line & Bar charts.

That’s about the introduction to Candlestick patterns. In our upcoming lessons, we will discuss different candlestick patterns and how to generate trading signals using these patterns. So, stay tuned.

[wp_quiz id=”60271″]
Categories
Forex Basic Strategies

Trading The Most Profitable Candlestick Pattern With Stochastic Indicator

Introduction

Throughout the years, many professional traders and chartists spent thousands of hours in front of their screens and have invented hundreds of candlestick patterns that show in the market. Some of these patterns work very well, and some failed miserably. A lot of traders believe that pattern trading doesn’t work. But it is just a myth. Pattern trading does work if we use it in conjunction with other credible trading tools.

Most of the novice traders make the mistake of treating A candlestick pattern as a trading signal. They need to understand that the patterns alone do not hold enough power to reverse the trend of the market. Most of the candlestick patterns are defined by using the last three to four candlesticks alone. Also, most importantly, they ignore the price action context.

This is the reason why we always urge our readers to combines candlestick patterns with other trading tools like credible indicators or oscillators. In this article, we will be sharing one of the most profitable trading strategies that we have ever come across. It involves a candlestick pattern and a technical indicator.

Engulfing Pattern + Stochastic Indicator

After extensive research and backtesting, we found that the Engulfing Pattern is the most profitable Pattern when confirmed and traded with the Stochastic Indicator. Before going right into the strategy, let’s talk about the Stochastic Indicator and Engulfing Pattern in the interest of novice traders who have never heard of these things before.

Stochastic Indicator

George Lane developed the Stochastic Indicator in the Late 1950s. It is one of the most prominent indicators in the industry, and it has been identifying credible signals consistently in all the types of markets from the past 60+ years. The Stochastic is an oscillator, and it changes its direction even before the price action. It measures the relationship between the underlying asset’s closing price and its price range over a specific period of time. Just like other indicators, stochastic doesn’t follow the volume and price. Instead, it follows the momentum and speed of the price to identify the overbought and oversold areas.

Engulfing Pattern

Engulfing is one of the most prominent candlestick patterns in the market. This Pattern frequently appears in the Forex market than the stock or futures market. There are two types of Engulfing Patterns in the market – Bullish Engulfing Pattern & Bearish Engulfing Pattern. Engulfing is either a bullish or bearish reversal pattern, and it prints at the end of any prevailing trend.

Bullish and Bearish Engulfing Patterns

The Bullish Engulfing Pattern always appears in a downtrend. It is a three candle pattern. The first candle is Red; the color of the second candle doesn’t matter. Most of the time, the second candle is a Doji candle. The third candle is super important as it must be Green in color for the pattern confirmation. Also, it must close above the first Red candle.

Conversely, the Bearish Engulfing Pattern appears in an uptrend, and it indicates the bearish reversal. The first candle is Green in color, and that suggests the uptrend is still ongoing. The second candle is Doji, and the color doesn’t matter much. The third one is the decision making candle, which must be Red in color. This indicates the buyers not having enough power to lead the market.

Trading Strategy

Buy Example

This strategy works very well in all the timeframes. So irrespective of you being an intraday trader, swing trader, or an investor, you can still use this strategy. If you are a 60-minute trader, only trade with the current timeframe trend. Adding additional timeframes to this strategy often creates confusion, and as a result, it leads to wrong decision making. The strategy is as follows:

  • The very first step is to find a downtrend in any underlying security.
  • With a bullish view, look for a Bullish Engulfing Pattern.
  • Then apply the Stochastic Indicator on to the charts
  • To take a trade, the Stochastic must be in the oversold area. If the Stochastic is at the overbought area and you see a Bullish Engulfing Pattern, do not take the trade.

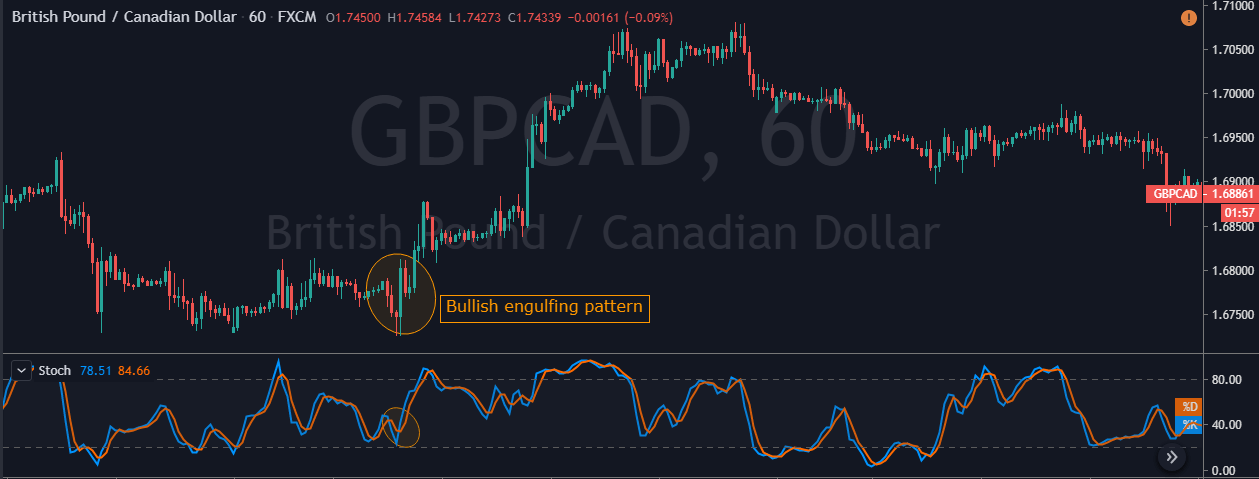
In the below GBP/CAD Forex chart the bottom panel shows the Stochastic Indicator. We can see the market was in an overall downtrend. At the end of the downtrend, we can notice the market printing the Bullish Engulfing Pattern. We can also see the crossover of the stochastic indicator at the same time.

This shows that the sellers are exhausted and buyers gaining control in this pair. If at all you are trade the Engulfing patterns alone, make sure to wait for two to three confirmation candles after the Pattern to enter the trade. Here, in our case, there is no need to wait for the next two-three candles as Stochastic confirms the Bullish Engulfing Pattern’s signal. Also, if we would have placed the Take Profit accurately, the winning pips in this trade would be huge. Hence we call this the most profitable candlestick pattern.

Sell Example

  • Firstly, check if the market is in an uptrend.
  • With a bearish view, look for the Bearish Engulfing Pattern.
  • The third step is that the Stochastic must be in the overbought area.
  • If the Stochastic is at the oversold area and market prints a Bearish Engulfing pattern do not take the trade.

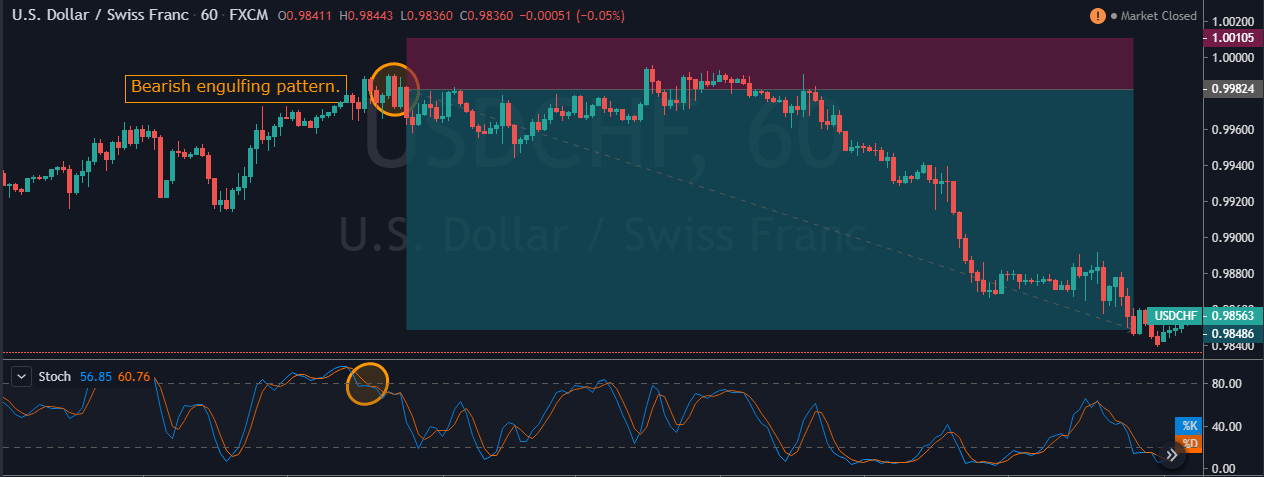
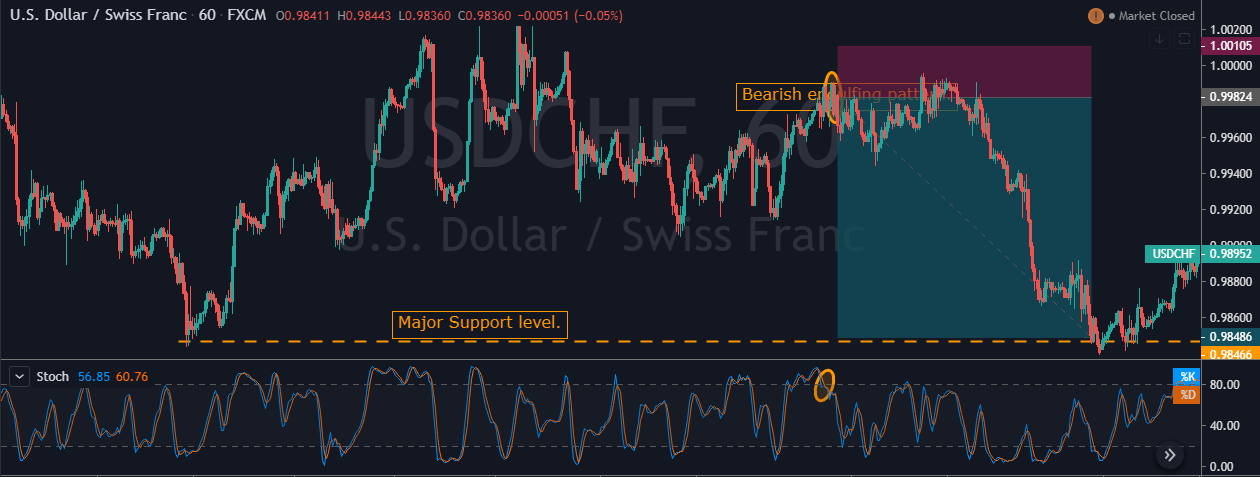
In the below USD/CHF Forex pair, the overall market was in an uptrend. When the market turned sideways, it has printed the Bearish Engulfing Pattern. We can also see the Stochastic Indicator in the overbought area. Hence this is a clear indication of Sell trade in this pair. After the signal, price action turned sideways for a longer period. Here, a lot of amateur traders exit their positions if the price takes too long to respond.

But we suggest you have faith and only exit your trades when it hits the stop loss. In our case, we can see the price action holding for sometimes, and when it rolls over, it gave stronger moves. In the below image, we can see that after holding sideways, price action dropped very hard, and we booked full positions at the major support area.

Bottom line

Engulfing Pattern is quite popular, and one of the most profitable patterns that exist in the industry. It often provides good risk-reward ratio trades. When we master the combination of Engulfing Patterns and the Stochastic Indicator, we can easily take our trading to a whole next level. Combining these two technical tools is a sound approach, as they quickly help us in filtering low probability trades. This strategy works well in both ranging market conditions and trending/dying market conditions.

We hope you find this information useful. Test this strategy in a demo account before applying it to the live markets. Cheers!

Categories
Forex Basic Strategies

Pairing The Shooting Star With Stochastic & Awesome Oscillators

Introduction

The Shooting Star is one of the most popular bearish candlestick patterns in the industry. This pattern appears in an uptrend most of the time, and it indicates bearish reversals in the price action of any underlying currency. So basically, when this pattern appears on the charts, it implies that the buyers are exhausted, and its sellers turn to lead the market. Once we have identified the Shooting Star pattern in an uptrend and confirm the trend reversal with any other credible indicator, we should look to open a short position.

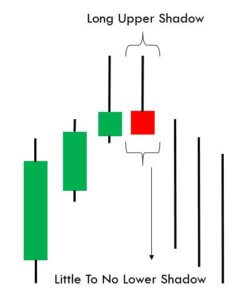
This pattern has a unique structure as it consists of a small body and a high upper wick, as shown in the image below. This image accurately represents the trend reversal because we can clearly see the buyers losing momentum and sellers taking over the market.

Trading strategies with the Shooting Star pattern

Shooting Star + Stochastic Indicator

In this strategy, we have paired the Shooting Star pattern with the Stochastic Indicator to identify the trading opportunities. Just like RSI and MACD, the Stochastic Indicator also belongs to the oscillator group. It is developed in the 1950s, and it is still widely used by the traders. The Stochastic indicator oscillates between 0 & 100 levels. When the indicator goes below 20, it means that the currency pair is oversold. Similarly, when the indicator goes above the 100 level, it indicates that the currency pair is overbought.

STEP 1 – First of all, find the Shooting Star pattern in an uptrend.

STEP 2 – Check the Stochastic indicator

Once you find the Shooting Star pattern, the next step is to check the Stochastic Indicator. If the indicator is giving a reversal at the oversold area, it indicates the overbought market conditions.

The image below represents the EUR/USD weekly Forex chart. In this pair, price action was held at a significant resistance area, and it prints the Shooting Star pattern. Also, the Stochastic indicates the overbought conditions. These three clues clearly say that this pair is all set to change its direction. The Stochastic pattern on a higher timeframe has very higher chances to perform. So whenever you find this pattern, and if it supports the rules of this strategy, always trade big.

Step 3 – Stop-loss and Take Profit

A stop loss is specially designed to limit the loss of the trader. So before activating your trade, it is essential to decide where you are going to place the stop loss. In the example above, we put the stop loss just above the Shooting Star candle.

Shooting Star pattern indicates the reversal in price action. This means that we are catching the top of the trend. As the end goal of every trader is to maximize their profits and minimize losses, always try to hold the positions for more extended targets.

In the example, we have closed our position at a higher timeframe support area. We can use the higher timeframe support or look for the Stochastic Indicator to reach the oversold area. Another way to close the position is when the market reaches the major support area while the Stochastic is in the oversold area.

As we can see in the image below, we closed our full position at a significant support area. You can use the Stochastic or any other trading tool to exit your position, but we always suggest to use the considerable support/resistance area to book profits.

Shooting Star Pattern + Awesome Oscillator

In this strategy, we have paired the Shooting Star pattern with the Awesome Oscillator to identify the trading opportunities. The Awesome Oscillator is a boundless indicator. When the Awesome Oscillator reverses below the zero-level, it indicates the buying pressure. When it reverses above the zero-level, it means sellers are ready to lead the market. Furthermore, some traders use this indicator to confirm the strength of the trend. When the indicator goes above zero-level, it means the buying trend is quite strong, and when it goes below the zero-level, it shows the sellers dominating the market.

Step 1 – First of all, find the Shooting Star pattern in an uptrend.

Step 2 – Look for the Awesome oscillator reversal

Once we find the Shooting Star pattern, the next step is to take a sell-entry when the Awesome Oscillator reverses at overbought market conditions.

The image below is the EURUSD 240 chart. On this pair, at first, the buyers were quite weak, and they started holding at the resistance area. Furthermore, in that small range, price action turned sideways, and it printed the Shooting Star pattern. The Awesome Oscillator even reversed at the overbought conditions. Both of the trading tools are indicating the exhaustion of the buyers. And sellers are ready to take over the market.

Step 3 – Take Profit and Stop loss

Every trader has different expectations from the market, some like to trade short term trends, and some like to trade longer-term moves. If you are an intraday trader, then we suggest you close your position when the Awesome Oscillator reverses at the oversold area. But, if you are a swing trader or investor, wait for the opposite pattern (Hammer Pattern) to appear to close all of your positions. We can even use the higher timeframe support/resistance area to close our positions.

We advise you to place the stop-loss order above the Shooting Star pattern. As you can see in the image below, we booked full profits at the major support area. After that, the price action dropped a bit more but reversed immediately to follow the buy direction. It is important not to ignore the higher timeframe support/resistance areas.

The psychology behind the Shooting Star Pattern

At first, we see the buyers enjoying the uptrend as the price of the currency keeps printing brand new higher high. As this euphoric moment begins to set in, the sellers start to sell their positions at higher prices. Now the buyers get panicked, and even they start to sell their positions. Now that the buyers and sellers are both selling their positions, panic is created in the market, which leads to a sharp reversal in price action. Thus a long wicked small body candle appears on the trading charts.

Keep in mind that the Shooting Star pattern is more reliable when it is formed after the three consecutive bullish candles. It creates strong bullish pressure on the price chart, and in such cases, the upper wick of Shooting Star is even longer. It indicates that the price is about to reverse with even more strength.

Bottom line

The Shooting Star is a single candle pattern, and it is the most popular trend reversal pattern in the industry. There is a strong psychological pattern that exists beyond the Shooting Star pattern. When the market is in an uptrend, and when buyers gain exponential strength, most of the traders book the profit, and as a result, the bullish trend loses its strength. This results in sellers sending the price down. Most of the time, the Shooting Star pattern provides the 3:1 risk-reward ratio trades.

We hope you find this article informative. Please let us know if you have any questions regarding the same in the comments below. Cheers!

Categories
Forex Basic Strategies

How To Trade The ‘Three Black Crows’ Pattern Like A Professional Forex Trader

Introduction

Three Black Crows is a bearish candlestick pattern that consists of three consecutive red candles. This is a visual pattern and can be identified easily on the price action charts. The Three Black Crows pattern essentially indicates a shift in control from bulls to bears. In the book known as ‘Candlestick Trading Technique,’ Steve Nison says that this pattern is one of the most useful ones for longer-term trades.

In an uptrend, this pattern consists of three consecutive bear candles that have large bodies of roughly the same size. The Three Crows pattern confirms the strength of the sellers.

Each candle should be open and close lower than the previous candle.

Each candle should mark a successive decline in price action and should not have long shadows or wicks. Using this trading pattern in conjunction with other technical indicators will enhance the probability of winning the trade.

Trading Strategies With Three Black Crows Pattern

TBC Pattern + Bollinger Bands

In this strategy, we have paired the Three Black Crows pattern with the Bollinger Bands to identify accurate trading signals. The Bollinger Bands indicator is developed by the technical trader John Bollinger. It consists of a centerline and two bands above and below the price chart. The bands of the indicator contract and expand according to the different market conditions. In a volatile market, the bands of the indicator expand and in a dying market condition the bands’ contract.

Step 1 – First of all, find the Three Black Crows Pattern in an uptrend.

Step 2 – Take a sell-entry when the Three Black Crows pattern hit the upper band of the Bollinger Bands Indicator.

In the above chart of the NZD/USD forex chart, we can see that the pair was in an overall uptrend. Around the 4th of November, price action prints Three Black Crows, which is an initial clue to go short. Furthermore, price action also respects the Bollinger upper band, which is a sign to go short on this pair.

Step 3 – Stop-loss & Take Profit

Placing accurate Stop loss is one of the most critical aspects of successful trading. Some of the novice traders never use stop loss, and it is the biggest mistake they do. We always suggest the traders use the stop-loss order in every trade they take. If you have the fear that your trade might hit the stop loss, then use a deeper stop loss and expect only 1R trades. If you are an aggressive trader, then stop loss above the Bollinger bands is the safest idea.

The basic idea most of the traders have is to exit their positions when price action hits the lower band of the Bollinger band indicator. If you follow this strategy, there will be fewer chances of you making money. Because price action moves in cycles, and prices often hit the upper and lower bands. We suggest you always use the higher timeframe major support area for booking your profits. You can also close your position when the market prints the Three White Soldiers pattern, which is quite the opposite of the Three Black Crows pattern.

In the above example, we have closed our full position when the market reached a previous major support area. Most of the time, price action always reacts from a significant support area. In our case, when we closed our position (yellow dotted line), price action immediately changed its direction.

TBC Pattern + MACD Indicator

In this strategy, let’s learn how to trade the Three Black Crows pattern by combining it with the MACD indicator to identify reliable trading signals. MACD is a trend following indicator, and it stands for Moving Average Convergence and Divergence. This indicator consists of a histogram, moving averages, and a centerline. Traders use the MACD moving average crossovers to identify the trading signals. When the moving averages of the indicator go above the zero-line, it indicates a buy signal. Likewise, when it goes below the zero-line, it indicates the sell signal.

Step 1 – First of all, find the Three Black Crows Pattern in an uptrend.

Step 2 – The strategy is this – when market prints the Three Black Crows pattern, see if there is a crossover happening on the MACD indicator at the overbought area. If there is a crossover, it is a clear sign to go short in any underlying currency pair and vice-versa to go long.

In the image below, GBP/CAD was in an overall uptrend. When price action prints the Three Black Crows pattern, it indicates the ongoing trend reversal in the near future. Furthermore, when crossover happened on MACD, it’s a clear signal that the GBP/CAD is ready to start a downtrend afresh. After our entry, price held for a bit at the support area and dropped to print a brand new lower low.

Step 3 – Stop-loss & Take Profit

Put the stop loss above the first candle of the Three Black Crows pattern and close your whole position when price action reached a significant support area.

As you can see in the image below, we closed our full position at the major support area. Overall it was not a smooth ride, but our position didn’t go into loss even for a single time. Traders can also close their positions according to market situations, or according to their trading style.

Bottom Line

Three Black Crows pattern is one of the most famous and popular trading patterns out there. This pattern can be used to identify the trend reversals in an upward market. Whenever you find a Three Black Crows pattern on the price chart, we suggest you sit up straight and understand if this pattern has the potential to reverse the market or not. It is always advisable to pair this pattern with other trading tools to confirm the indication. Traders can also use this pattern to enter or exit a trade. Some traders use this pattern with the combination of other trading tools in order to close their full position. The end goal is to use this pattern to identify trading opportunities and trend reversals more accurately. Cheers!
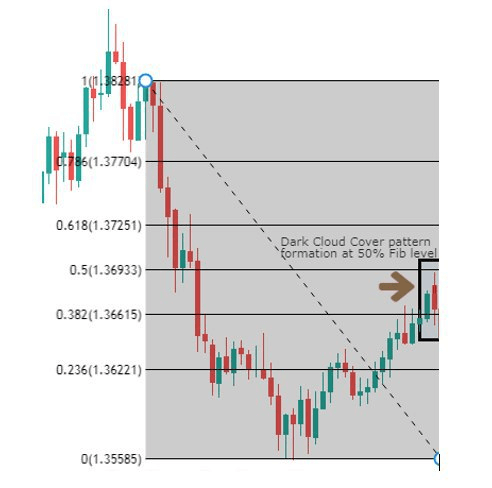
Categories
Candlestick patterns Forex Basic Strategies Forex Trading Strategies

Pairing The Hanging Man Candlestick Pattern With MACD Indicator

Introduction

The Hanging Man is a visual candlestick pattern which is used by traders and chartists in all type of markets. The term ‘Hanging Man’ refers to the shape of the candlestick. Visually the hanging man looks like a ‘T,’ and it appears in an uptrend. The formation of this candlestick is an indication that the uptrend is losing its strength. Meaning, sellers started showing interest, and the current trend of an asset is going to get reversed. Anyone can easily predict from the name of this pattern that it is viewed as a bearish sign.

The Hanging Man candle composes of a small body and a long lower shadow with little or no upper shadow. The vital point to remember is that the hanging man pattern is a warning of the upcoming price change, so do not take it as a signal to go short. Also, trading solely based on one pattern is risky. To confirm the sign given by the Hanging Man pattern, traders must pair it with support resistance or any other trading indicator.
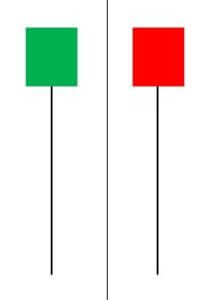
This pattern is not confirmed unless the price falls shortly after the Hanging Man. If the next candle closes above the high of the Hanging Man, this pattern is not valid. After the pattern, if the very next candlestick falls, then it’s a clear indication of the reversal. Now, if you see a Hanging Man candlestick and the above-discussed rules apply, you can go ahead and take the trade. But since it is crucial to have an extra confirmation, let’s pair this pattern with a technical indicator.

Pairing the Hanging Man Pattern With MACD Indicator

In this strategy, we have paired the Hanging Man pattern with the MACD indicator so that we can filter out the low probability trades. MACD stands for Moving Average Convergence and Divergence, and it is one of the most popular indicators in the market. It is essentially an oscillator that is used for trading ranges, trend pullbacks, etc. Also, this indicator identifies the overbought and oversold market conditions. In this strategy, we are using the default setting of the MACD indicator to identify the trades.

Step 1 – Confirm the uptrend first on your trading timeframe

We can’t use the Hanging Man pattern to take the buy trades. Since it is a reversal pattern, it only signals the selling trades. So first of all, find out the uptrend in any currency pair. One more primary thing to remember when trading this pattern is this – After finding a clear uptrend, if you see the market printing the Hanging Man, then try not to trade that pair. Because, in a strong trend, it’s not easy for a single candle to change the direction of the entire trend. But if you find this pattern when the uptrend is a bit choppy, it has higher chances to perform. As we can see in the image below, the uptrend in USD/CHF was not strong enough.

Step 2 - Find out the Hanging Man pattern on your trading timeframe

Some traders use two or three timeframes to trade patterns. But that’s not the right way of pattern trading. If you are an intraday trader, use only lower timeframes to identify the pattern. So the next step here is to find out the Hanging Man in this chart. Also, apply the MACD indicator. For us to go short, the MACD indicator must be in the overbought area.

As you can see in the image below, the USD/CHF Forex pair prints a Hanging Man pattern. This is the first clue for us that the buyers aren’t able to push the market higher. Soon after the crossover happened on the MACD indicator, we can say that this forex pair is in the overbought condition. So now, two forces are aligned, and they are indicating us to go short. Within a few hours, the pair rolls over, and it prints brand new lower low.

Step 3 – Entry, Take Profit & Stop Loss

We go short as soon as we see the Hanging Man candlesticks and MACD indicator at the overbought area, we can go short. In this pair, buyers were quite weak, and this is an indication for us to place deeper targets. As we suggest in every strategy, often close your position at significant support/resistance area, or when the market starts to print the opposite pattern. In this pair, we closed our full trade at 0.9844. Overall it was 7R trade, and we made nearly 140+ pips.

Placing the stop loss depends on what kind of trader you are. Some advanced traders use their intuition to close their positions, while some use logical ways such as checking the power of the opposite party. In this trade, we know that the buyers are not strong enough, so there is no need to use the spacious stop loss.

Difference Between Hanging Man and Hammer Patterns

The Hanging Man and Hammer both look the same terms of size and shape. Both of these patterns have long, lower shadows and small bodies. But the Hanging Man forms in an uptrend, and it is a bearish reversal pattern. Whereas the Hammer forms in a downtrend, and it is a bullish reversal pattern. These two patterns appear in both short and long term trends. Do not use these patterns alone to trade the market. Always use them in conjunction with some other reliable indicators or any other trading tool.

Bottom Line

Most of the professional traders never see this pattern alone as a predictor of a potential trend reversal. Because there will be times when the price action continues to move upward even after the appearance of the Hanging Man. Hence technical indicator support is required to confirm the reversal of the trend. Make sure to stick to the rules of the pattern so that you can use it to your advantage. This pattern forms in all the timeframes, but we suggest you master it on a single timeframe first. Cheers!