Introduction
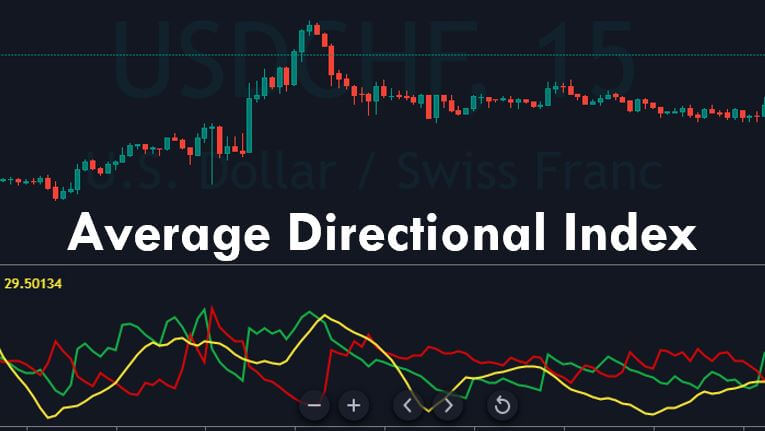
The ADX indicator is created by a technical analysis legend, ‘J Welles Wilder.’ ADX (Average Directional Index) shows how strong the market is trending in any direction. This indicator doesn’t have a negative value, so it is not like the oscillators that may fluctuate above and below the price action. The indicator gives a reading that ranges between 0 and 50 levels. Higher the reading goes, stronger the trend is, and lower the reading goes, weaker the trend is.

The ADX Indicator Consists of Three Lines.
- The ADX Line.
- The DI+ Line. (Plus Directional Movement Index)
- The DI – Line. (Minus Directional Movement Index)
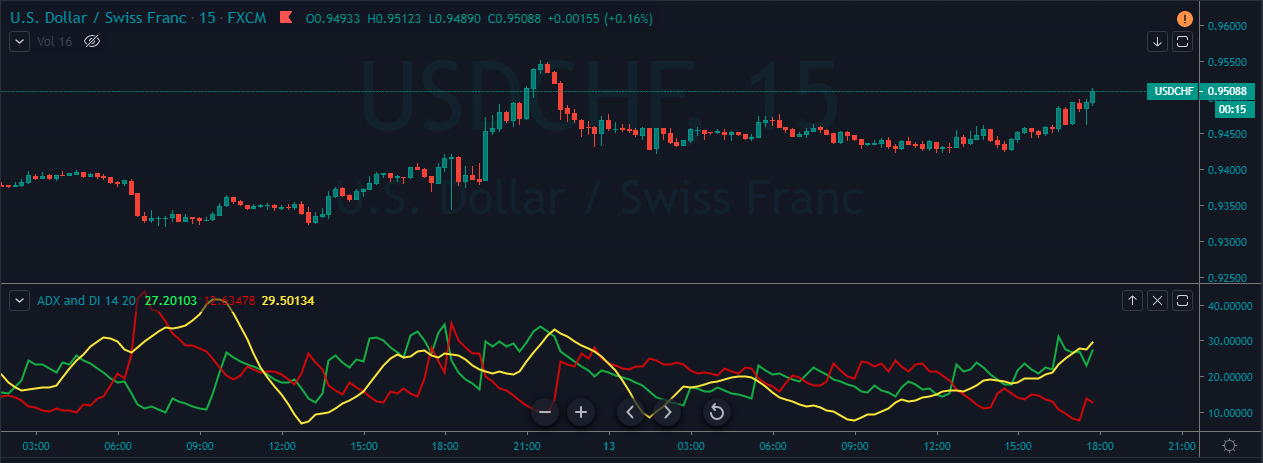
The chart above is the visualization of the ADX indicator. We can see the green line (DM+), the Red Line (DM-), and the Yellow Line. (ADX)
Trend Direction and Crossovers
Buy Example
To take a buy trade using this indicator, the first requirement is that the ADX line should be above the 20 level. This indicates that the market is in an uptrend. We go long when the DI+ crosses the DI- from above as it indicates a buy signal.
The chart below is the EUR/AUD Forex pair, where we have identified a buy trade using the ADX indicator. As we can see, the market was in an uptrend, and it is confirmed by the ADX line going above the 20 level. At the same time, we can also see the crossover happening between the DI+ and DI- lines of this indicator. This clearly indicates a buying trade in this pair.
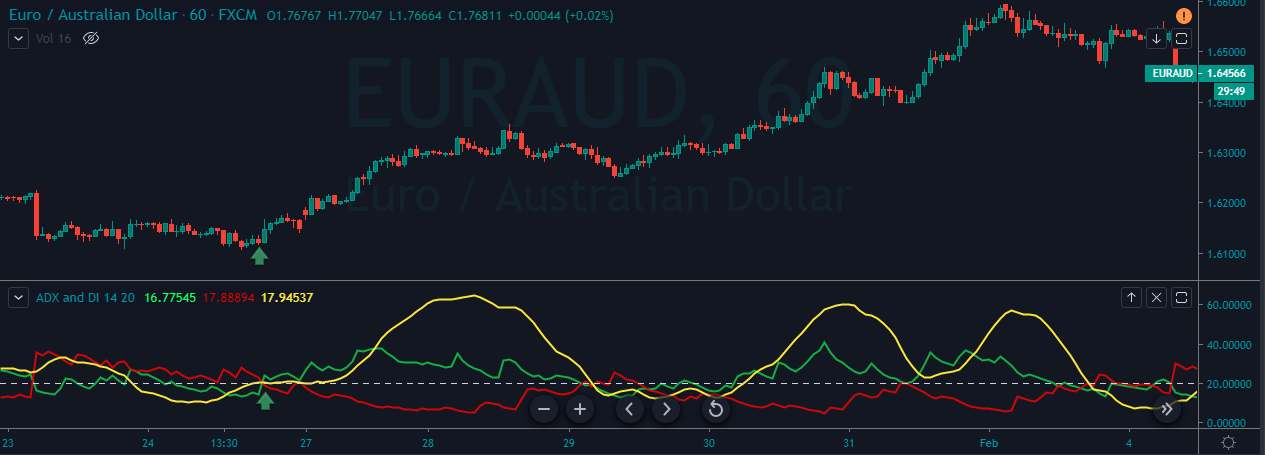
The stop-loss placed below the close of the recent candle is good enough, and we must exit our position when the ADX line (yellow line) goes below the 25 level.
Sell Example
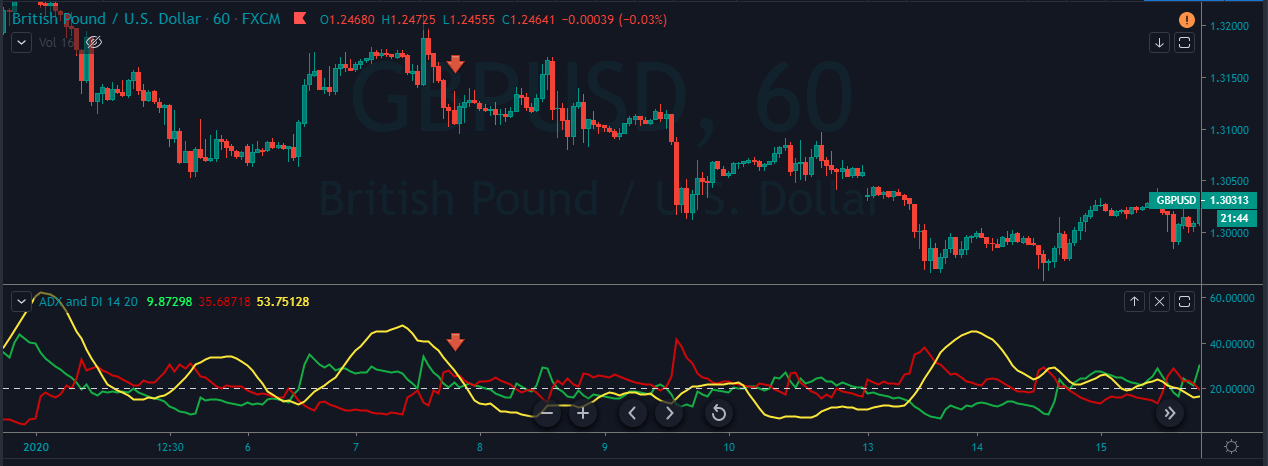
The first requirement to take a seeling position using the ADX indicator is that the ADX line must be below the 20 level. This indicates that the market is in a downtrend. We go short when the DI+ line crosses the DI- line from below as it indicates a sell signal.
The below chart of the GBP/USD Forex pair indicates a sell signal. In a downtrend, when the ADX line (yellow line) goes below the 20 level, it confirms the strength of the downtrend. At the same time, when the DI+ crosses the DI- from below, it shows that the sellers are ready to resume the downtrend.
Breakout Trading Using The ADX Indicator
This strategy is similar to the crossover strategy that is discussed above. However, we are adding the price action breakout part to it. The idea is to go long when the ADX line is above the 20 level and when the DI+ crosses the DI- line from above. Also, the price action must break above the major resistance level to confirm the buying signal.
As we can see, in the below USD/CAD Forex chart, when the ADX line goes above the 20 level, it indicates that the uptrend is gaining strength. It also means that we can expect a break above the resistance line soon. When the price action broke above the resistance line, we can see the crossover on the ADX indicator. This clearly indicates a buy trade in this currency pair.
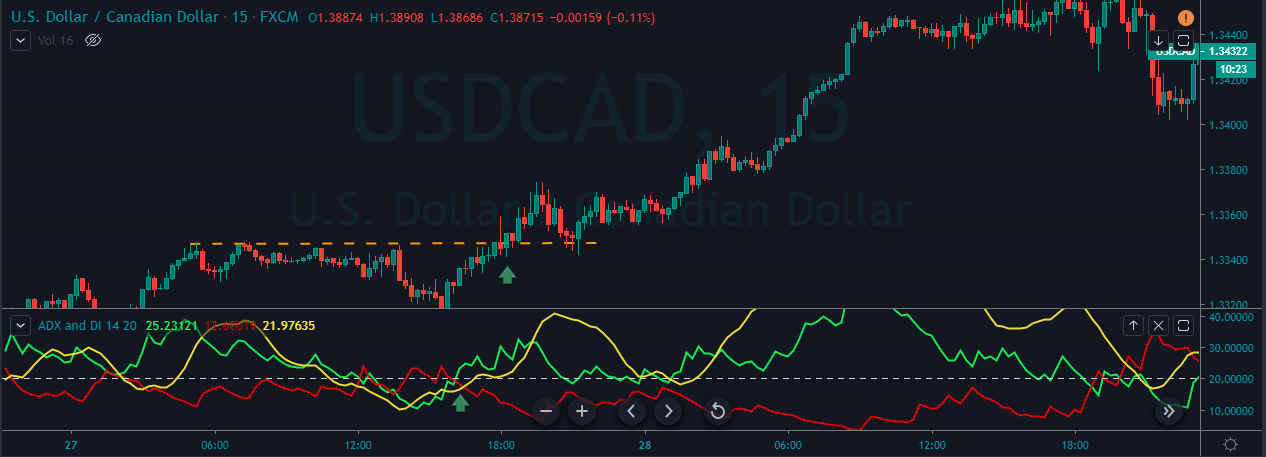
We can exit the trades when the opposite signal is triggered. Most of the time, breakout trades travel quite far. So if your goal is to ride longer moves, exit your position when the momentum of the uptrend starts to die or when the price action approaches the major resistance area.
That’s about the ADX indicator and related trading strategies using this indicator. If you have any questions, please let us know in the comments below. Cheers! [wp_quiz id=”68035″]


One reply on “89. Identifying Trading Signals Using The ‘ADX’ Indicator”
Thank you for breaking down for me to chew it I really appreciate