Introduction
In the previous lesson, we had an introduction to oscillator indicators and understood how they work. In this lesson, we shall put that into action by analyzing some of the most used oscillators.
Quick Revision
In general, Oscillator is any object that moves back and forth between two points. In simple terms, anything that moves between two points, 1&2, is said to be an oscillator.
The concept remains the same for trading as well. An oscillator is an indicator which moves within two bounds in a range. When trading using oscillators, our eye catches interest when it is around the peaks and troughs. These areas generate buy and sell signals. Precisely, it indicates the end of a trend or the beginning of a new trend.
Trading Oscillators
Stochastic, Relative Strength Index, and Parabolic SAR are the extensively used oscillators by traders.
All these indicators work under the premise that the rate of price change begins to slow; that is, the number of buyers or sellers have reduced at the current trading price. And this change in the momentum indicates a possible trend reversal because the other party is losing its gas. Such indications are given when the oscillators are at the overbought or oversold regions.
Stochastic Indicator
The stochastic indicator is an oscillator whose upper and lower bounds are 80 and 20, respectively. So, if the line moves 80, it enters into the overbought region, and if it drops below 20, it is said to be in the oversold region.
Calculating stochastic variables
There are two line on the stochastic oscillator, namely, %K and %D. Both the values are calculated as follows:
%K = 100 x (Price – L) / (H – L)
%D = (K1 + K2 + K3) / 3
Where, in %K, H and L represent the Low and High for the specified period. And %D represents the average of the most three recent values of the %K.
Note: In the given example, the period is chosen as 14 (last 14 days/candles).
RSI Indicator
The Relative Strength Index (RSI) is a momentum oscillator that measures the rate of change of price and the magnitude of directional price movements. The RSI calculates the momentum as the ratio of higher close values and lower close values for a specified period. As it is an oscillator, it oscillates between the bounds 30 and 70. The interpretation for it is the same as that of other oscillators.
Interpretation Example
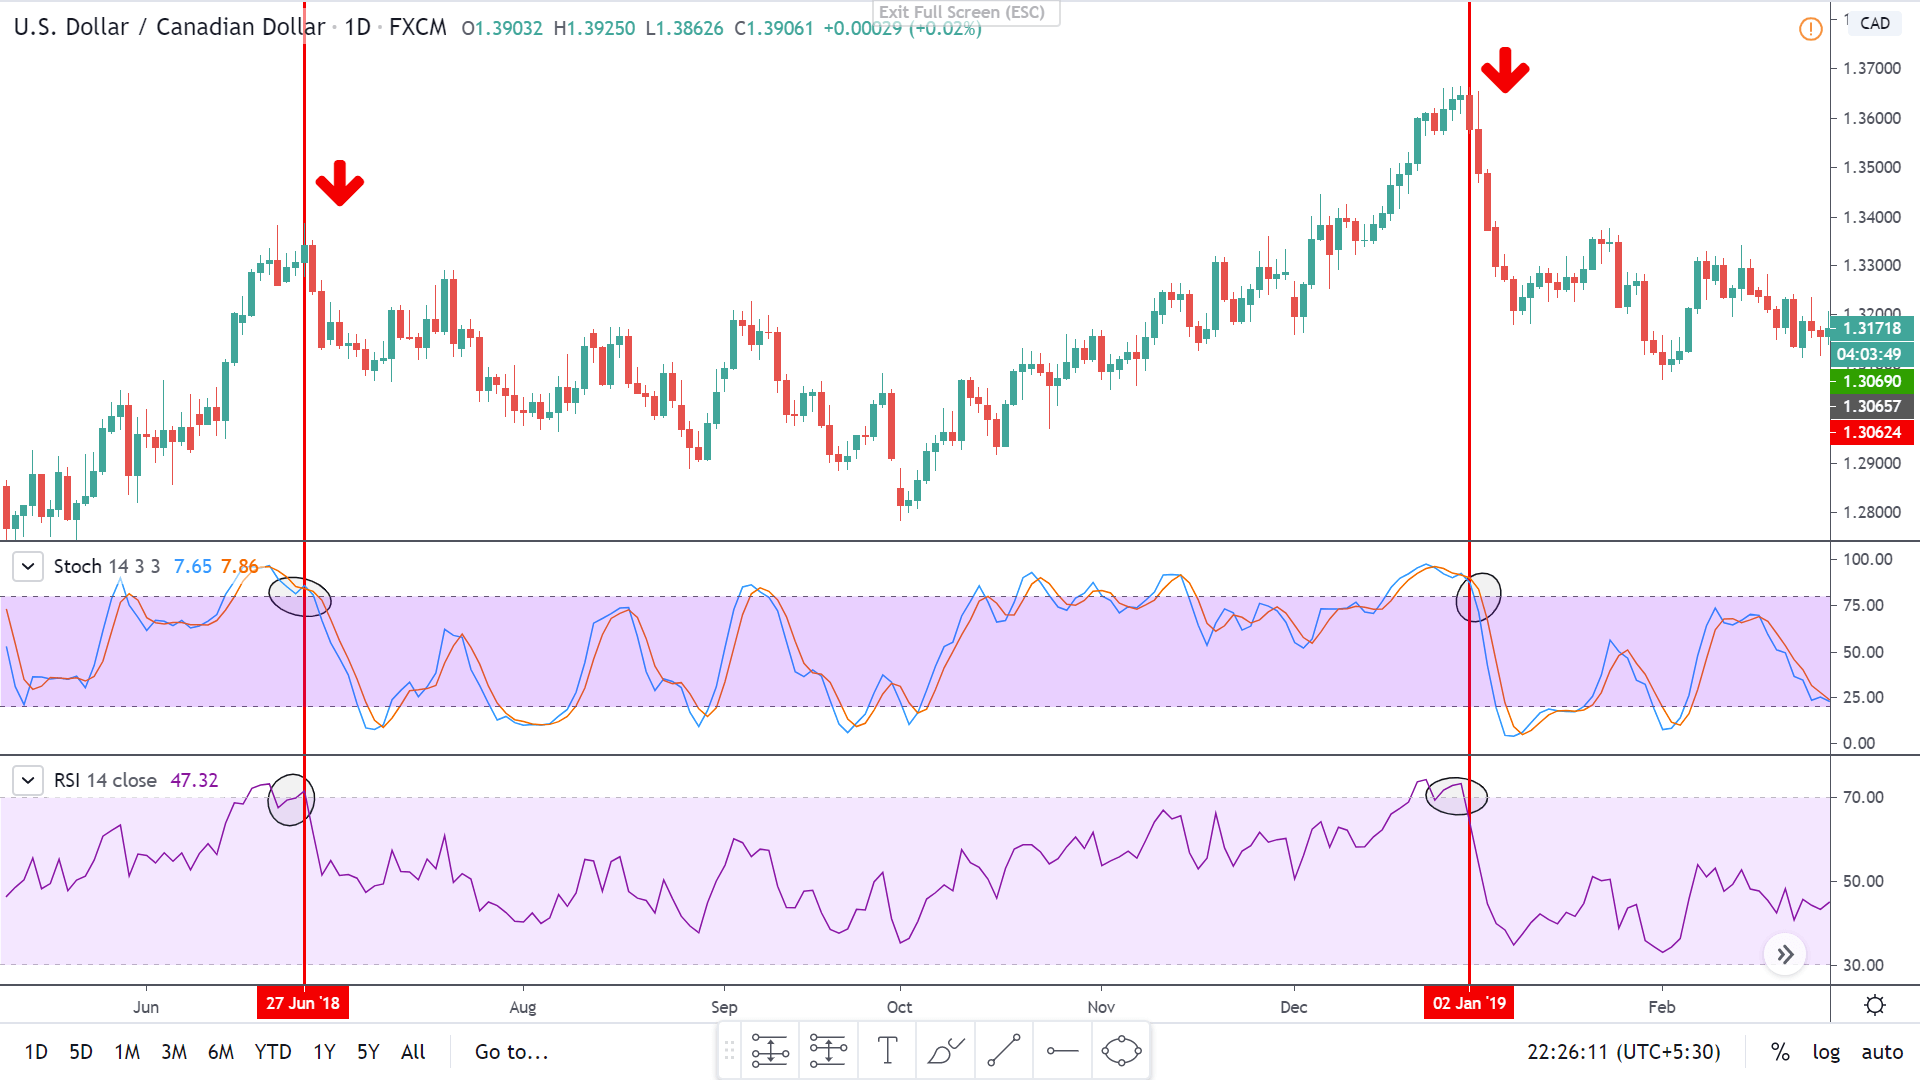
To illustrate the use of the oscillators, consider the given chart of USD/CAD on the 1D timeframe. To the price chart, the stochastic and the RSI oscillator has been applied.
At the vertical red lines, it can be seen that the market was overbought according to both the oscillators. This is an indication that the market which was in an uptrend priorly is not losing strength. Hence, in hindsight, the market falls as the oscillators start to make their way back into the range.
Bottom Line
Oscillators are great leading indicators that help in determining oversold and overbought conditions. It also gives traders an indication of the possibility of a market reversal. From the above example, it is seen that these indicators work like a charm. However, one must note that oscillators work in your favor, but not always. Sometimes, one oscillator indicates a buy while the other does not. These are the times when traders must avoid trading such instruments. As shown, oscillators must be used with other oscillators or technical tools to achieve the best out of it. [wp_quiz id=”70760″]


