Categories
Forex Basic Strategies Forex Daily Topic

Stop Hunting – The Strategy That Is Used By Most Of The Investment Banks

Introduction

Currently, there is a strategy that is followed by most investment banks around the world, and that is known as Stop Hunting. It attempts to force some market participants out of their positions by driving an asset’s price to a level where many retail traders set their stop-loss orders. The triggering of many stop losses at once generally leads to high volatility, and this can present opportunities to some smart traders who seek to trade in such an environment.

The fact that the price of a currency pair can experience sharp moves when many stop losses are triggered is exactly why many traders engage in stop hunting. Traders who are aware of this fact and have observed this phenomenon of the market try to make of this opportunity by being patient and conservative. The strategy we will be discussing today takes advantage of this sudden rise in volatility due to what is known as ‘stop-hunting.’

Timeframe

The beauty of this strategy is that it can be employed on all timeframes. However, it is not recommended in extremely small timeframes as there is a lot of noise in those timeframes, which may lead to confusion and misunderstanding. Hence, if one wants to profit greatly from this strategy, he/she should trade in 15 minutes or a higher time frame.

Indicators

We will be using just one technical indicator, and that is ‘Simple Moving Average (SMA)’ with 5 or 10 as it’s period. No other indicators are used in this strategy.

Currency Pairs

The strategy is suitable for trading in all currency pairs, including major, minor, and some exotic pairs. However, illiquid currency pairs should be avoided as the price action patterns are not reliable in these pairs.

Strategy Concept

In this strategy, we will be using the concept of previous highs and lows instead of support and resistance to act as our reference points. This is easy to understand and easier to spot in a chart. We will then anticipate these highs and lows as our support and resistance areas, which could break out of. Lows on a price chart are points where the price found support and started to go up.

In other words, this is a price point where there were ready sellers. When price revisits that area, sell orders get triggered, and the price starts to fall. However, during a breakout scenario, the momentum of the price is so much that it breaks the previous high and continues moving south. The Opposite is true for the breakdown of previous lows.

At times it is seen that even when the previous high or low is broken, the price doesn’t always continue in the direction of the breakout or breakdown. The price immediately retreats and bounces off the high or low. We will call these scenarios as fake-out or ‘stop-loss hunt.’ When price retraces back immediately, there is a high chance that it will continue in the same direction, at least until the latest hurdle. Let us explore the steps of the strategy.

Trade Setup

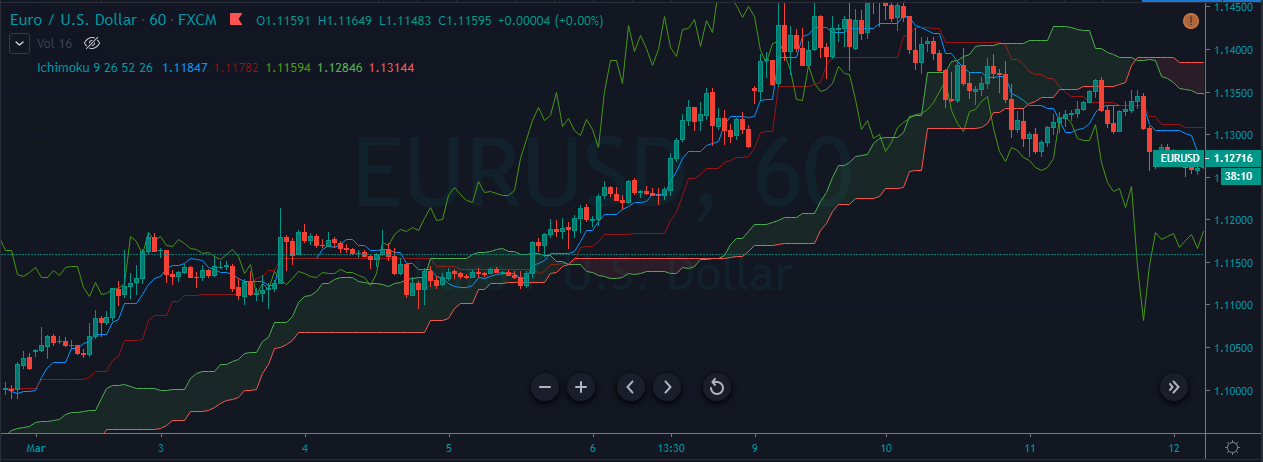
To explain this strategy, we will consider the EUR/USD currency pair and find a trade that fulfills all the criteria of the strategy. In this example, we will be analyzing the 1-hour time frame chart and look for appropriate price action patterns in the pair.

Step 1

The first step of the strategy is to look for highs and lows from where the market has traveled a fair amount of distance. Spotting for such areas in the direction of the major trend is preferred as the risk is lower in such trade setups. For instance, look for buying opportunities at lows of an uptrend and selling opportunities at the highs of a downtrend. This step is very important from a risk aversion point of view. Thus, one should give a lot of importance to this step of the strategy.
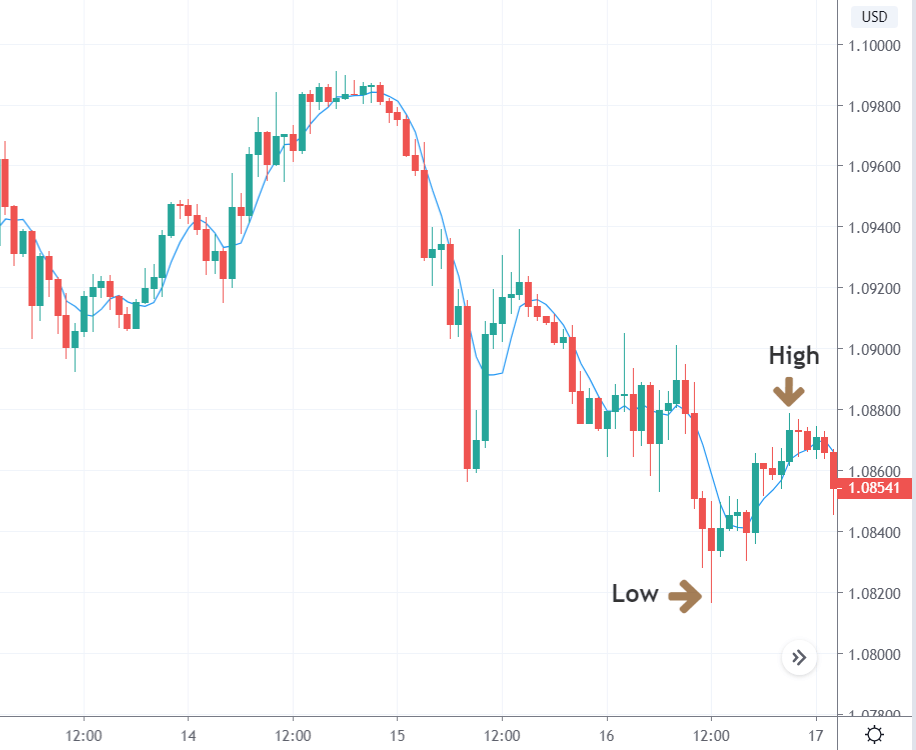
Step 2

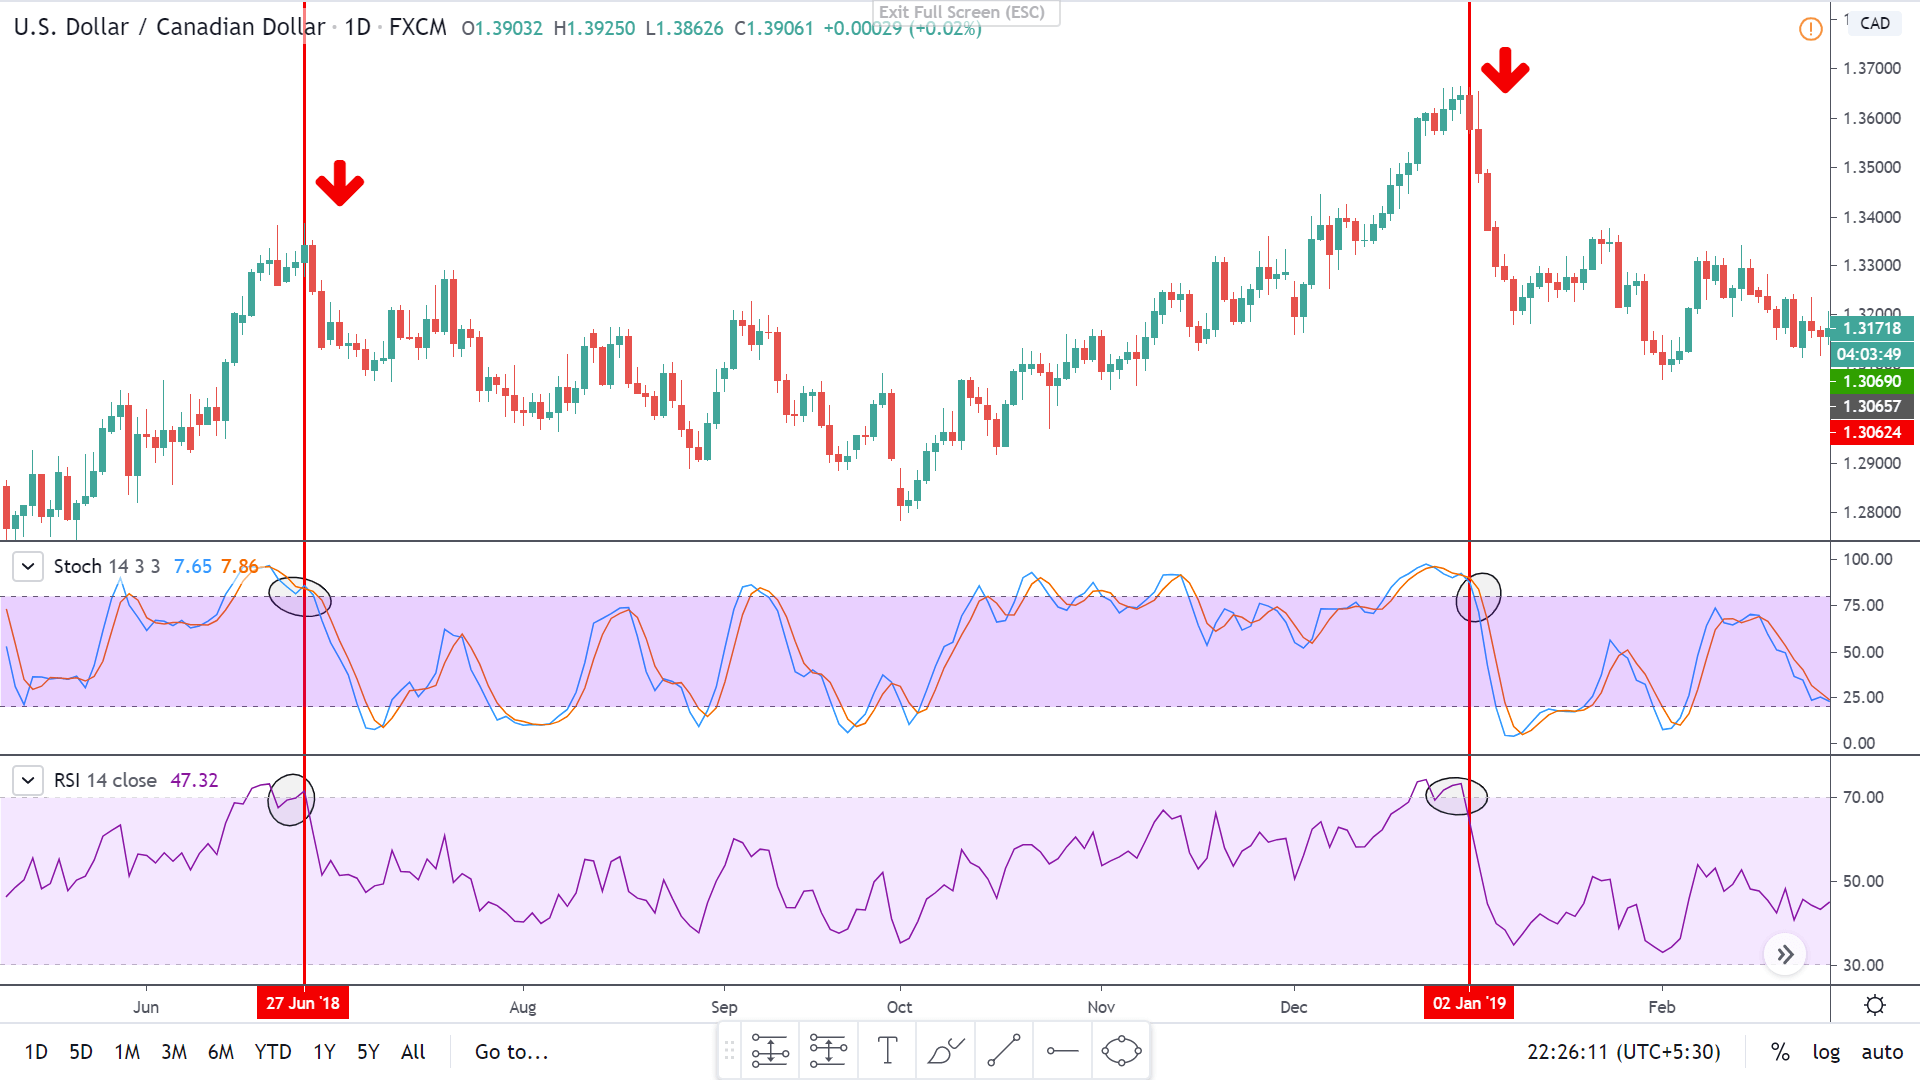
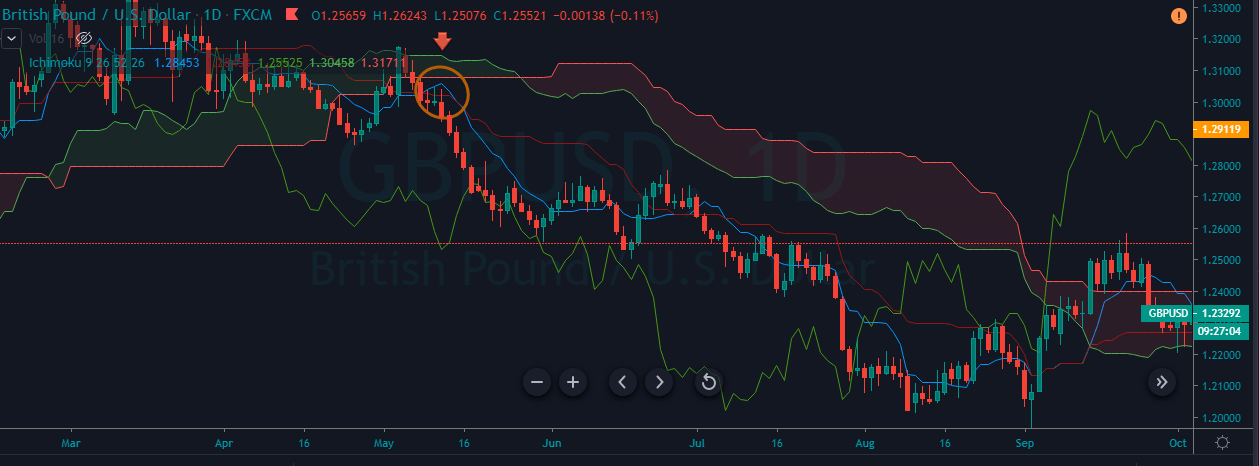
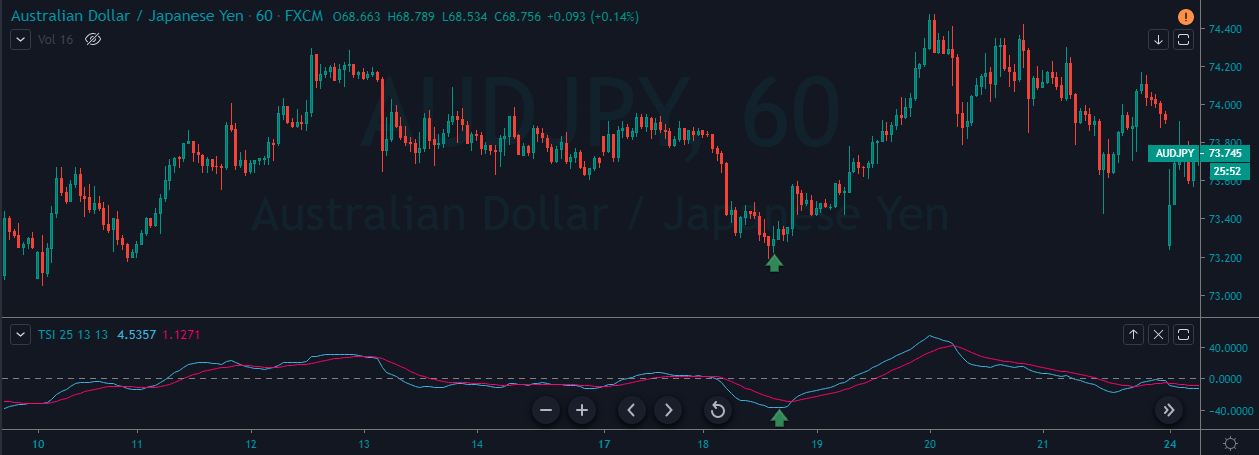
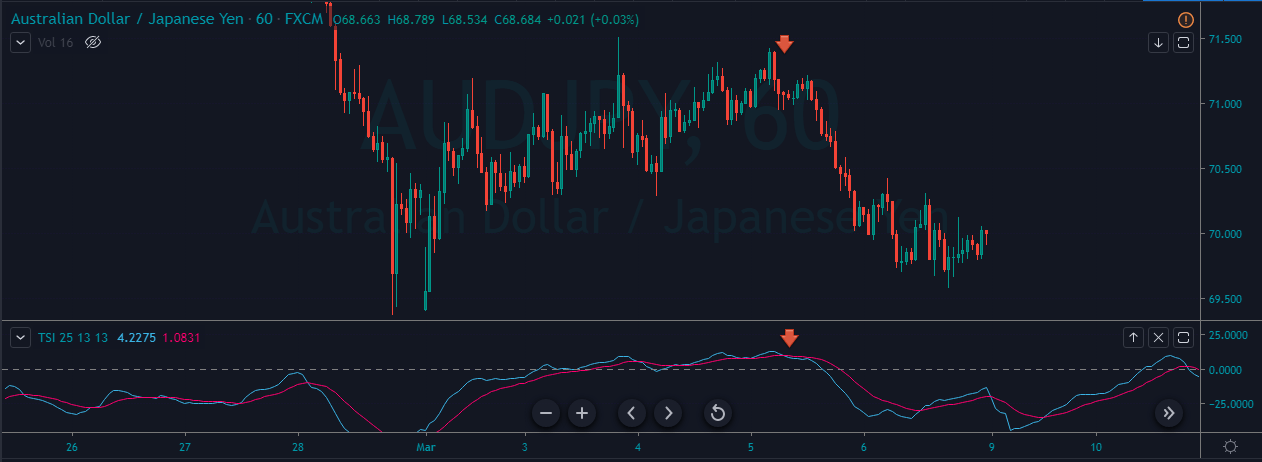
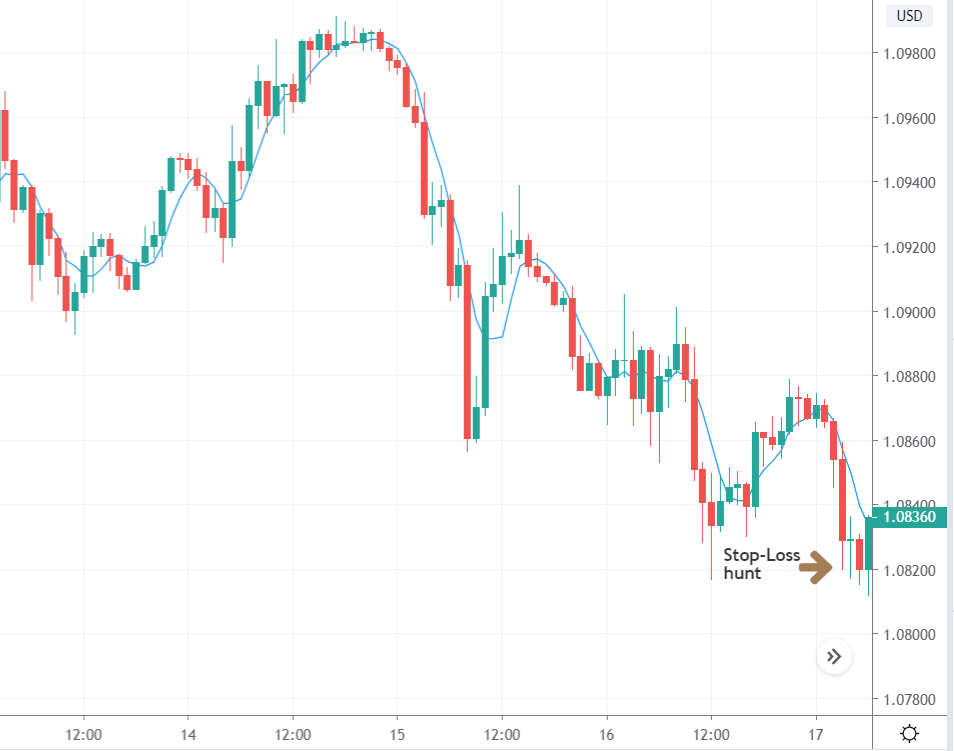
The next step is to look for a fake-out price action pattern at the low, marked in the previous step. This is the first confirmation that buyers or sellers have come back into the market, and the banks have cleared out all the strategies that were placed below the low and above the high.

The below image shows how the price goes slightly below the previous low clearing all the stops of retail traders, and the last candle closes with a great amount of bullishness.

Step 3

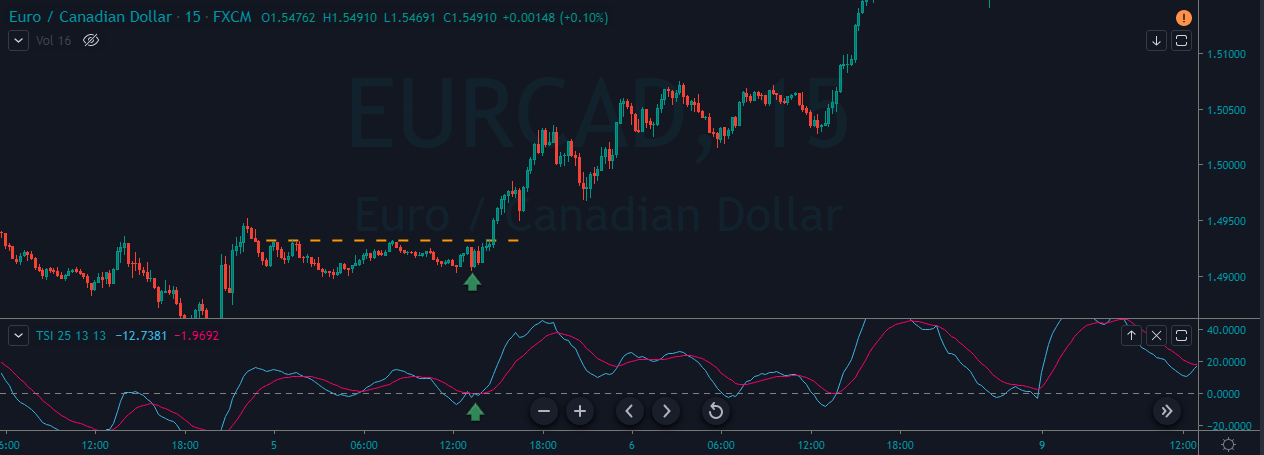
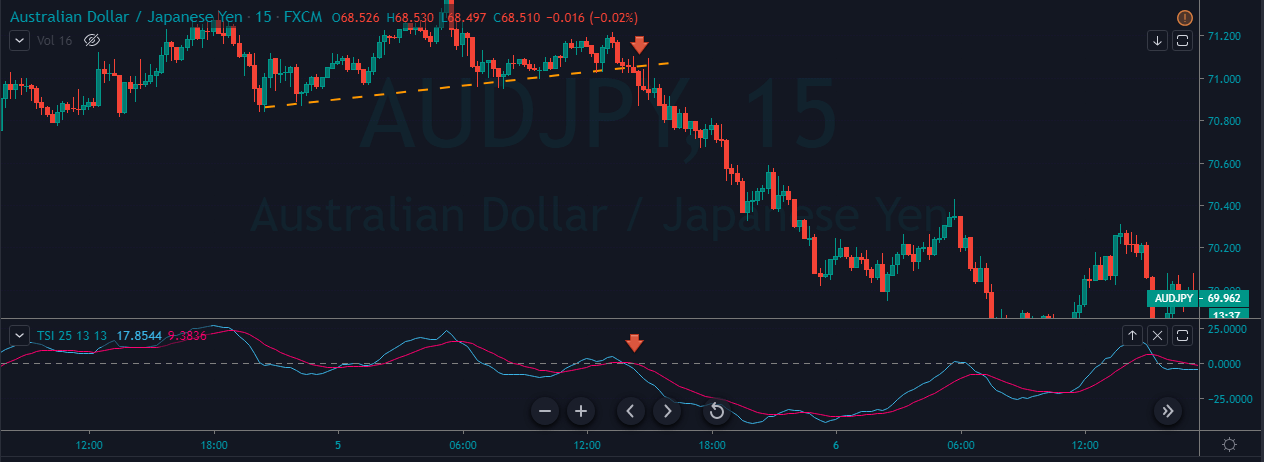
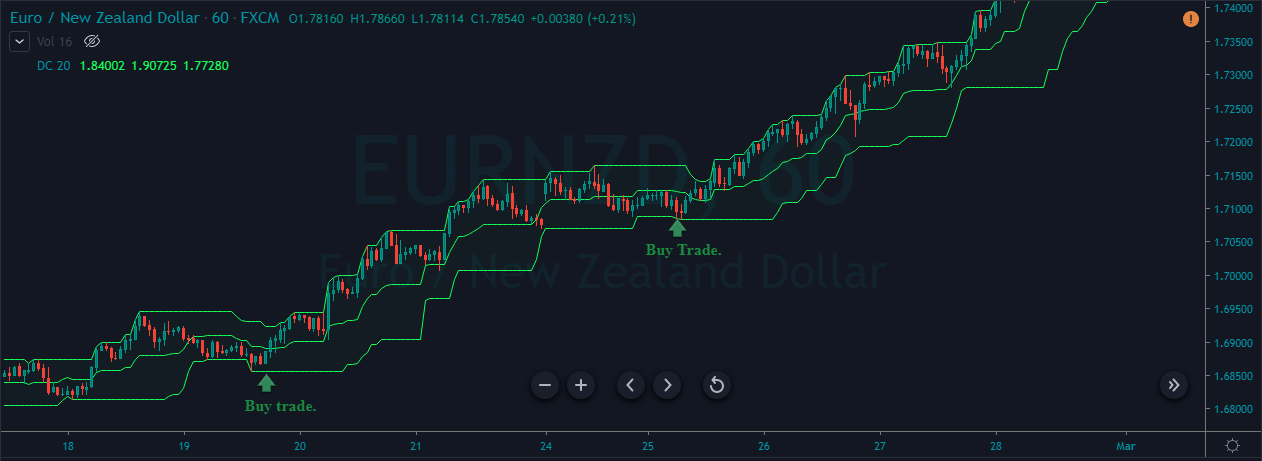
In this step, we see where we take an entry in the market. We take an entry right after the price starts moving higher or lower and closes above or below the simple moving average (SMA), respectively. Conservative traders can wait for the price to retrace to the SMA and then take an entry while aggressive traders can enter right at the close of the candle.

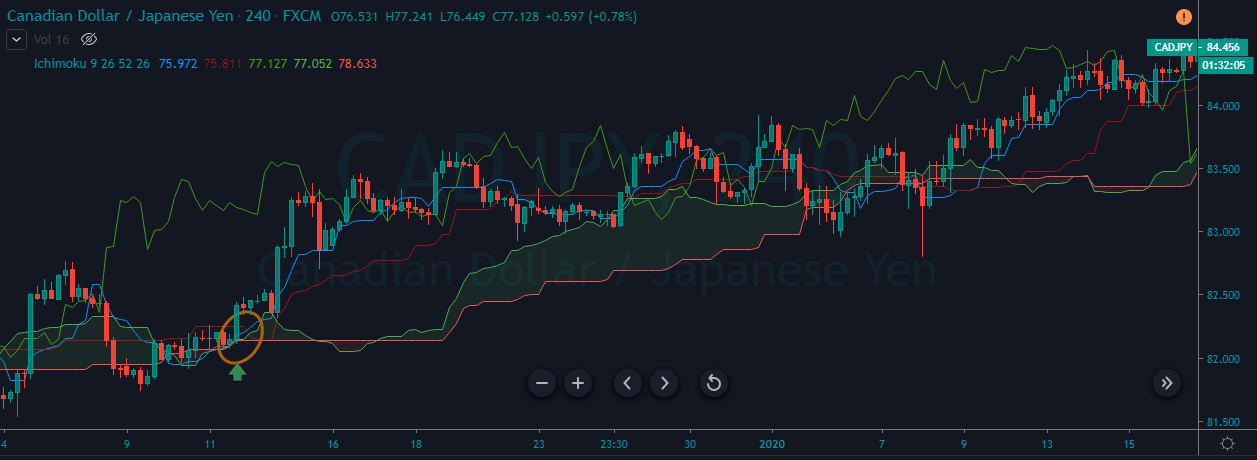
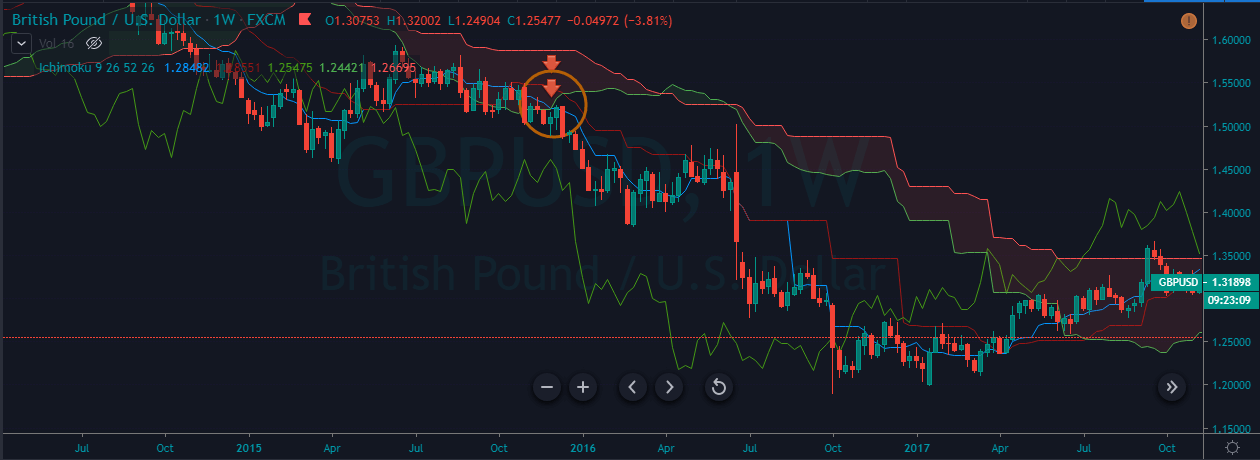
The arrow mark in the below image shows that the entry is made at the close of the second bullish candle after the fake-out.

Step 4

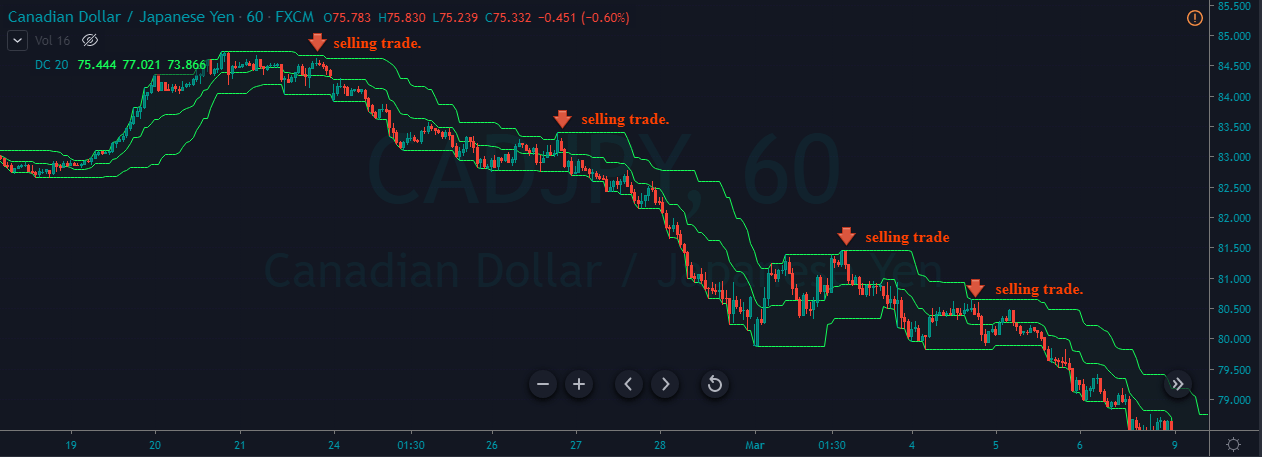
We have one take-profit and one stop-loss point for this strategy where we take profit at the high or low as we had marked in the first step of the strategy while stop loss is placed below or above the low and high, respectively. If one is trading in the direction of the major trend, he/she can take profits at new highs or lows. However, one needs to be conservative while taking counter-trend trades.

Strategy Roundup

Stop-loss hunts are becoming as common as breakouts. By including this strategy in our trading arsenal, we will have something that we could use when we notice such patterns in the market where other traders are looking for breakouts. In this strategy, we have put a significant amount of stress on price action, which makes this strategy very reliable and consistent. One can use trailing stop-loss to protect their profit even when the target isn’t reached. All the best!

Categories
Forex Course

105. Summary of Leading and Lagging Indicators

Introduction

In the previous lessons, we have understood what leading, and lagging indicators are. We also saw how these indicators could be further divided into other types. Here’s a summary of everything we’ve learned so far in this space.

Leading Indicators

Leading indicators are those who forecast prices in the market using historical prices. It indicates a signal for the continuation or reversal of a trend the event occurs. However, these indicators do not work with complete certainty. As they are making a prediction, it is more probability driven.

Lagging Indicators

Lagging indicators, as the name suggests, are lagging in nature. These indicators confirm the market trend using past prices. They are called the trend-following indicators as they give an indication once the trend has been established in the price charts. However, these confirmatory indicators are more reliable than the leading indicators as they give more accurate signals though they are late in doing so.

Please refer to this article to know the differences between these two types of indicators.

In the industry, there are three types of indicators that are widely used. They are

  • Oscillators
  • Trend-following indicators
  • Momentum indicators

If we were to put them into the bag of leading or lagging indicators, Oscillators are leading, trend-following indicators and momentum indicators are lagging. Note that an indicator may not be under one of the types; they can be a combination of two or all three.

Oscillators

An oscillator is a leading indicator that moves within a predefined range. These are to our interest when it crosses above or below the specified bound. These areas determine the oversold and overbought conditions in the market. These indicators are very helpful in determining market reversal. Some of the most popular oscillators include MACD, ROC, RSI, CCI, etc. The usage and interpretation of oscillators have been discussed in detail in this article.

Trend-Following Indicators

Trend-following indicators are lagging indicators that are usually constructed with a variety of moving averages. Crossovers are the typical strategy used with these indicators. These indicators give a signal to buy or sell when the market has already begun its move. Hence, these indicators give us late entries but are more convincing than leading indicators. For example, Moving Averages and MACD are the most used trend-following indicators.

Momentum Indicators

As the name clearly indicates, these indicators show the speed or the rate of price change in the market. Since the momentum can be calculated after the price moves, it is considered a lagging indicator. These indicators indicate when there is a slowdown in the buyers or sellers. And with this, we can assume for a possible reversal. More about this can be found here.

Conclusion

This sums up the concept of leading and lagging indicators. Having an understanding of these indicators is necessary because it is risky if a lagging indicator is analyzed as a leading indicator and vice versa. Also, it is recommended to use these indicators in conjunction with each other for better results. In the upcoming course lessons, we will be discussing interesting topics related to Elliot Wave Theory.

Categories
Forex Course

103. Analyzing The Power Of Oscillators

Introduction

In the previous lesson, we had an introduction to oscillator indicators and understood how they work. In this lesson, we shall put that into action by analyzing some of the most used oscillators.

Quick Revision

In general, Oscillator is any object that moves back and forth between two points. In simple terms, anything that moves between two points, 1&2, is said to be an oscillator.

The concept remains the same for trading as well. An oscillator is an indicator which moves within two bounds in a range. When trading using oscillators, our eye catches interest when it is around the peaks and troughs. These areas generate buy and sell signals. Precisely, it indicates the end of a trend or the beginning of a new trend.

Trading Oscillators

Stochastic, Relative Strength Index, and Parabolic SAR are the extensively used oscillators by traders.

All these indicators work under the premise that the rate of price change begins to slow; that is, the number of buyers or sellers have reduced at the current trading price. And this change in the momentum indicates a possible trend reversal because the other party is losing its gas. Such indications are given when the oscillators are at the overbought or oversold regions.

Stochastic Indicator

The stochastic indicator is an oscillator whose upper and lower bounds are 80 and 20, respectively. So, if the line moves 80, it enters into the overbought region, and if it drops below 20, it is said to be in the oversold region.

Calculating stochastic variables

There are two line on the stochastic oscillator, namely, %K and %D. Both the values are calculated as follows:

%K = 100 x (Price – L) / (H – L)

%D = (K1 + K2 + K3) / 3

Where, in %K, H and L represent the Low and High for the specified period. And %D represents the average of the most three recent values of the %K.

Note: In the given example, the period is chosen as 14 (last 14 days/candles).

RSI Indicator

The Relative Strength Index (RSI) is a momentum oscillator that measures the rate of change of price and the magnitude of directional price movements. The RSI calculates the momentum as the ratio of higher close values and lower close values for a specified period. As it is an oscillator, it oscillates between the bounds 30 and 70. The interpretation for it is the same as that of other oscillators.

Interpretation Example

To illustrate the use of the oscillators, consider the given chart of USD/CAD on the 1D timeframe. To the price chart, the stochastic and the RSI oscillator has been applied.

At the vertical red lines, it can be seen that the market was overbought according to both the oscillators. This is an indication that the market which was in an uptrend priorly is not losing strength. Hence, in hindsight, the market falls as the oscillators start to make their way back into the range.

Bottom Line

Oscillators are great leading indicators that help in determining oversold and overbought conditions. It also gives traders an indication of the possibility of a market reversal. From the above example, it is seen that these indicators work like a charm. However, one must note that oscillators work in your favor, but not always. Sometimes, one oscillator indicates a buy while the other does not. These are the times when traders must avoid trading such instruments. As shown, oscillators must be used with other oscillators or technical tools to achieve the best out of it.

[wp_quiz id=”70760″]
Categories
Forex Course

101. What Are Oscillators & How To Interpret Them?

Introduction

Technical Indicators are primarily used to confirm a price movement and the quality of a candlestick pattern, and also to create trading signals with them. Indicators are a great source of strength to confirm an existing analysis. Moreover, some indicators solely help in analyzing the trend, momentum, and volatility of the market.

As discussed previously discussed, there are two types of indicators, leading and lagging. And oscillators fall under the leading indicators. That is, they determine the trend of the market before-hand.

Indicator construction

There are two ways through which indicators are designed:

  1. Non-bounded
  2. Oscillators

Non-bounded, as the name suggests, they are the indicators that are not bound in a specific range. They usually display the strength and weaknesses, and to an extent, generates buy and sell signals.

Oscillators, on the other hand, are indicators that are bound within a range. For example, 0-100 is the range they oscillate between. However, based on the type of oscillator, the range varies.

Oscillators

Oscillators are technical indicators that are mainly used to determine the oversold and overbought conditions. These non-trending indicators are used when the market is not showing any certain trend in either direction. They are unlike the moving averages (MA), which determine the trend and overall direction of the market.

When security is under an overbought or oversold situation, the oscillators show its real value. It indicates that one of the parties is losing its strength, and the other is slowly starting to gain together.

Interpreting Oscillators

Oscillators are constructed with lower and upper bounds. And these bounds form a range. In the below oscillator, the purple region represents range-bound, where 30 is the lower bound, and 70 is the upper bound. The upper and lower bounds are also referred to as peaks and troughs. Typically, the peaks and troughs in the oscillator correspond to the peaks and troughs in the market as well.

Extreme Regions

The oversold and overbought regions are the extreme regions. That is, when the oscillator line shoots above the upper bound, the market is considered to be overbought. On the contrary, if the oscillator falls beneath the lower bound, the market is said to be overbought.

An overbought market means that the buying volume has diminished over a few trading days. So, there could be a possibility for investors to sell their positions. However, note that this interpretation holds true when the market was in a predominant uptrend and is currently consolidating.

An oversold market indicates that the selling volume, which was high in the past days, has now diminished. This could mean that the sellers are done selling with the security and might begin closing their positions. Hence, indicating a turn-around in the market.

Midpoint Line

A crossover at midpoint region of the range depicts the gain in strength of the buyer or sellers. From the oscillator given, 50 is the midpoint line. So, if the oscillators cross above the 50 mark, it indicates bullishness in the market. And if cuts below 50, it could indicate bearishness in the market.

This concludes the lesson oscillators. In the coming lessons, we shall discuss some strategies using a few oscillators. Stay tuned. Happy trading!

[wp_quiz id=”70529″]
Categories
Forex Course

Introduction To Forex Course 4.0

Hello People,

As you all know, we have completed Course 3.0 successfully. Thanks a lot for the brilliant response and great job on the quizzes you all have taken. We have covered some of the most critical fundamentals pertaining to technical analysis in course 3.0. Please make sure to practice all the concepts we have discussed in a demo account. Without practice, it is impossible to ace the Forex Market using technical analysis. We have also made a quick navigation guide for Course 3.0 so that it’ll be easier for you to get a quick recap whenever required. You can find that guide in the link below.

Quick Navigation Guide – Forex Academy Course 3.0

With all these learnings in mind, we will be moving on to the Forex Academy Course 4.0. We have discussed most of the basics concerning technical trading in the previous course. Hence, we will be exploring some sophisticated strategies and intermediate to advanced concepts of technical analysis in Course 4.0. It is crucial to have acquired the knowledge of whatever we have studied in the previous course to catch up with these complex concepts. So it is highly recommended to finish the previous course before starting off with this one.

Topics that will be covered in Course 4.0

Forex Chart Patterns & Their Importance

Trading The Most Popular Chart Patterns

Oscillators

Momentum Indicators

Pivot Points & their importance

Each of these topics will have about 7 to 10 course articles with corresponding quizzes. The USP of this course are the writers who prepared TOC and the related content. They are professional technical & price action traders who have a combined experience of 20+ years in the Forex market. So make sure to follow all the concepts that are discussed in this course and practice them well to become a successful Technical Trader. Also, try to answer the quiz questions until you get all the questions right. We wish you all the luck. Cheers!

Categories
Forex Course

87. Using Ichimoku Cloud To Identify Trading Signals In The Forex Market

Introduction

The Ichimoku Cloud is a Japanese charting method and a trading system developed by Mr. Goichi Hosoda. This indicator consists of many different lines embedded in the price chart. Hence it might look complicated at first and might even make novice traders unforgettable reading the charts. But with enough experience, we can grab all the information presented by the indicator. The indicator consists of five Moving Averages and a cloud formed by two of those averages. The default settings of the indicator are 9, 26, and 52, and these settings are configurable according to the trader preference.

Components of the Ichimoku Cloud

This indicator consists of five lines in total, as discussed. They are a Red Line (Tenken Sen), Blue Line (Kijun Sen), Green Line (Chinoku Span), and Two Orange lines that make the cloud (Senkou Span A and B). Each line of the indicator is a moving average, so we can also look at the Ichimoku cloud indicator as a five moving average indicator.

The Basic Interpretations of the Ichimoku Cloud

When the price is above the cloud, it means the market is in a bullish trend. Contrarily, when the price is below the cloud, it means the market is in a bearish trend. When the price action is in the middle of the trend, it means that the market is in a consolidation phase.

Below is how a Forex price chart looks when the Ichimoku cloud is plotted on it.

Ichimoku Cloud Trading Strategy – Buy

First of all, the price action must be above the cloud as it indicates that the market is in an uptrend. When the Tenken Sen (Red Line) crosses the Kijun Sen (Blue line) from below, it indicates a bullish signal, and we can go long.

Buy Example 1

The image below represents a buying trade in the CAD/JPY Forex pair. We can see that the cloud goes below the price action, and it indicates that the trend is up. Soon after Tenken Sen (Red Line) crosses the Kijun Sen (blue line) below the price action, we know that the pullback is exhausted, and buyers are ready to resume the uptrend.

Buy Example 2

The image below belongs to the Weekly chart of the USD/CHF Forex pair. In Dec 2000, the Ichimoku indicator generated a clear buy signal when the cloud was below the price action, and the crossover of both the lines shows that it’s a perfect moment to go long in this pair.

Ichimoku Cloud Trading Strategy – Sell

The price action must be below the cloud as it indicates that the market is in a downtrend. Go short when the Tenken Sen (Red Line) crosses the Kijun Sen (Blue line) from above as it indicates a sell signal.

Sell Example 1

The below example is from the daily chart. It doesn’t matter which timeframe we trade; this strategy works well on all the timeframes. In the below image, at first, the market was in the consolidation phase. When the cloud goes above the price action, it’s a sign for us to prepare to go short soon in this pair. When the Tenken Sen (Red Line) crosses the Kijun Sen (Blue Line), it indicated that the sellers are now ready to print a new lower low.

Sell Example 2

If you are an investor or a higher timeframe trader, the below example is for you. The Red arrows and the encircled area indicate that the price action is below the cloud. Also, the Tenken Sen (Red Line) crosses the Kijun Sen (Blue line), indicating a sell signal.

The example below we took was from 2016, and the price action continuously goes down for the complete year. We should be patient enough and have control over our emotions to ride longer moves. We have placed the stop-loss above the crossover of two lines and booked the profits when the cloud goes below the price action.

That’s about Ichimoku Cloud and relative trading strategies. There are many other ways through which the signals can be generated using this indicator, but the ones discussed above are the most basic yet reliable ones. Cheers.

[wp_quiz id=”67661″]
Categories
Forex Course

85. Learning To Trade By Using The ‘True Strength Index’ Indicator

Introduction

The True Strength Index (TSI) is a technical indicator used to analyze the financial markets. ‘William Blau’ developed the indicator in the mid of 1991. If you are interested to know more about William Blau and the technical tools developed by him, we suggest you read his book – ‘Momentum, Direction, and Divergence.’ The True Strength Index abounds between the +100 and -100 levels, and most of the values fall between +25 and -25.

Typically, the price action moves between these levels, and they are considered as overbought and oversold levels. This indicator also warns the weakening of a trend through the divergence and indicates a potential trend changes via centerline. When the indicator goes above the zero-level, it means the indicator is in positive territory, and the buying market is strong. But if the indicator goes below the zero-level, it means that the indicator is in negative territory, and the selling market is strong.

Below is how the price chart looks when the True Strength Index indicator is plotted on it.

True Strength Index Trading Strategies

Traditional Trading Strategy

Buy Example

We must look for buy trades when the crossover of the TSI lines happen at the oversold levels and hold it until the price action reaches the overbought level. The image below represents a buying entry in the AUD/JPY Forex pair. In an uptrend, when the market gives a decent pullback, the TSI indicator reached the oversold area, which means that the sellers are exhausted now and prepare for the buys. Soon after the exhaustion, the crossover happened on the TSI indicator, indicating a buy trade.

Sell Example

Look out for selling opportunities when the crossover happens at the overbought levels and hold it until the price action reaches the oversold level. The below chart represents the sell trade in the AUD/JPY Forex pair. The TSI indicator reached the overbought level when the price action gave enough pullback; the crossover indicates the failure of buyers to move price action higher, and as a result, reversal happened. We can exit our positions at any of the major support levels, or when the indicator gives an opposite signal.

TSI Breakout Strategy

Buy Example

The strategy is to identify a breakout on the price chart. Once the breakout happens, the TSI indicator must be above the zero-line to take the buy trade. We can see that in the below image when the breakout happened on the EUR/CAD Forex pair. After the breakout, we can see that the TSI indicator was also above the zero line, indicating a buy signal in this pair. We can exit our positions at the higher timeframe’s resistance area or exit when the TSI reaches the overbought area.

Sell Example

In a downtrend, find out a sell-side breakout. After the breakout, if the TSI indicator goes below the zero-line, it indicates a sell trade. As we can see in the image below, when the price action broke the trend line, the TSI indicator also breaks below the zero line, which shows that the sellers are ready to print a brand new lower low in this pair.

That’s about TSI and trading strategies related to this indicator. Make sure to try this indicator and these strategies and let us know hoe did your trades go in the comments below. Cheers.

[wp_quiz id=”67291″]
Categories
Forex Course

83. Learning To Trade The Donchain Channel Indicator

Introduction

The Donchain channel indicator is one of the quite popular technical indicators in the market. It is developed by Richard Donchian in the mid-twentieth century. This indicator consists of three moving average lines calculated by the highest high and lowest low of the last ‘n’ period. The upper Donchian band marks the highest price of the security over the ‘n’ period of time, whereas the lower band of the indicator marks the lowest price of a security over the “n” period of time. The area between the upper and lower band represents the Donchian channel.

If the price action is stable, the Donchian channel stays in a narrow range, and in volatile market conditions, the Donchian channel indicator will be wider. In this way, the Donchian channel is a wonderful indicator to assess the volatility of the market. The upper Donchian band indicates the extent of bullish energy, highlighting the price action achieved a new high in a particular period. Whereas the centerline of the indicator identifies the mean reversion price for a particular period. The bottom line identifies the extent of bearish energy, highlighting the lowest price achieved by the sellers in a fight with the buyers.

Below is how the price chart looks once the Donchain Channel indicator is plotted on to it.

Trading Strategies Using The Donchain Channel Indicator

Scalping Strategy

This strategy is made for traders who prefer to make quick bucks from the market. By following this strategy, we can get a couple of trades in a single trading session. The idea is to go long when the price action hits the lower band and go short when the price hit the upper band. The preferred time frame will be a 5- or 3-minute chart.

The image above represents a couple of buying and selling trading opportunities. Scalping is the easiest way to make quick bucks from the market. When we take a buy or sell trade, and if the price action goes five pip against your entry, we suggest you close the trade and wait for the price action to give another trading opportunity. Book the profit when price action hits the opposite band of the indicator.

Donchain Channel To Trade The Trending Market

If the market is in an uptrend, it is advisable to go only for the buy trades, and if it is in a downtrend, only go for sell trades. In this way, we can filter out false trading opportunities, and by following the trend, we can easily hold our position for longer targets.

Buy Trade

The below image represents two buying opportunities that we have identified in the EUR/NZD pair. We can see that the trend was up, and if we take any of those small sell trades, we will end up on the losing side. So on a higher timeframe, it is advisable to trade with the trend. We have captured the whole buying movement in this Forex pair. This is the easiest and safest way to trade the market using this indicator

Sell Trade

The below image represents a couple of selling opportunities in the CAD/JPY Forex pair. We can scale our positions when the market gives an opportunity to do so. Or, we can close our positions when the opposite signal is triggered. Always wait for the desired signal with patience to trade the market.

The advantage of trading with the trend is that whenever the market gives us the trading opportunity, we can easily hit the trade without worrying much. Another advantage of trading with the trend is that we can go with a smaller stop-loss as the price action spikes very less in a trending market.

These are only a few applications of the Donchain Channel Indicator. You can follow our strategy section to learn many advanced applications of this indicator. Stay tuned to learn many more technical indicators. Cheers!

[wp_quiz id=”67024″]
Categories
Forex Course

79. Is Indicator Based Trading For You or Not? (Pros & Cons)

Introduction

In the previous course article, we have briefly discussed the basics of indicator-based trading. We have also understood the different types of indicators. Before considering how to trade using these indicators, let’s see if indicator based trading is for you or not. For that, we will be listing down some of the significant pros and cons involved in indicator-based trading. After going through this article, we will know why we should be using indicators to trade the markets and what we should be cautious about while using these indicators.

Pros of using Technical Indicators

Simplification

As discussed in the previous course article, Indicators mainly present the existing price and volume data on the price charts. For novice traders who have less knowledge of reading this data, can take the help of indicators to understand the price charts in a more precise way. Also, indicators act as a great tool to identify market strength.

For instance, using the Moving Average indicator, the direction of the trend can be found. By using the stochastic indicator, overbought and oversold areas can be found. These cannot be easily identified by the novice traders if not for these indicators.

Swift Decision Making

Since you aren’t entirely aware of most of the indicators, we would like to give you an example of the indicators we have learned till now. If you remember trading Fibonacci levels, we have taken our entries right after the price bounces after touching the respective Fib levels. It is impossible to make such swift decisions in the absence of these indicators. Hence we can say that indicator based trading allows us to make quick decisions comparatively.

Confirmation Tool

Indicators act like an excellent confirmation tool for experienced traders as well. For example, a technical trader identifies a candlestick pattern and wants to take trades based on that pattern. To confirm if the signal provided by the pattern is accurate or not, he can take the help of any technical indicator like RSI or Stochastic. If the indicator supports the signal provided by the pattern, the trader can confidently make trades.

Combination Capability  

Indicators can be combined to understand the market more clearly. For instance, Moving Averages can be combined with Fibonacci levels, and Stochastic can be combined with many other reliable indicators to generate accurate signals. If we wish to, we can even add an end number of indicators, but these additions should able to simplify the price chart rather than making it more complex.

Cons of using Technical Indicators

Unawareness of the complete picture

Novice traders who get used to trading with these indicators can never get an entire background on what’s happening behind the charts. If they get used to this, they can never become a professional technical trader. Also, they won’t be able to identify if the signal generated by the indicator is accurate or not. Hence, it is always crucial to understand why the indicator is moving the way it is so that we can make better trading decisions.

Not for pure price action traders

Price action trading is also a part of technical trading. It is purely based on the price movements of the asset alone. So price action traders might find indicator based trading a bit redundant because they know why the price is moving the way it is moving. Hence we can say that indicators don’t add more value to pure price action traders.

Lag Issue

By now, we know that there are lagging indicators that portray what has already happened in the market. These indicators do add significant value to indicator based trading, but they can’t be completely used to take the trades.

Final Word

These are some of the pros and cons involved in using indicators for trading the markets. So the answer to the question ‘If the Indicator based trading is for you or not?’ is yes. It is for you. But we have to be cautious and understand the entire picture instead of blindly following the indicators. In the upcoming articles, we will start learning how to take trades using various reliable indicators in the market. Cheers!

Categories
Forex Course

78. Brief Introduction To Technical Indicators & Indicator Trading

Introduction

In the past two sections of this course, we have discussed two of the most important tools in Technical Analysis – Fibonacci & Moving Averages. These two are discussed in an elaborated way because you might be using them in conjunction with many of the other reliable indicators in the market. They can be used standalone not just to take trades but also for different other purposes. For instance, Moving Averages can be used to identify the direction of the trend. Likewise, Fibonacci Levels can be used to test the reliability of any support and resistance level.

Since we have completed learning these crucial tools, it’s time for us to extend our learning to understand specific technical tools known as indicators and oscillators. There are many indicators and oscillators in the market. Some are reliable, and some are not. So in the next few course lessons, we will be discussing some of the most credible and reliable indicators. In this lesson, let’s first understand what an Indicator basically is and why it is important to use them in technical analysis.

What is an Indicator?

An indicator is a tool that is used by technical traders and investors to understand the price charts and market conditions. The important purpose of any indicator is to interpret the existing data and accurately forecast the market direction. These indicators are built on various mathematical calculations by market experts.

These days, with the advent of technology, hundreds of indicators can easily be accessed. They are available on most of the charting platforms that we currently use, like MT4 & TradingView. Many of the reliable indicators we have today are a result of extensive research and back-testing. Any technical indicator considers a lot of important data like historical price and volume to predict the future price of an asset.

Indicators are an integral part of technical analysis, and the number of traders who just rely on indicators to take trades is pretty high. Typically, most of the indicators overlay on the price charts to predict the market trend. However, there are indicators that position themselves below the price chart to make users understand the overbought and oversold market conditions.

Oscillators are nothing but range-bound indicators. Which means, an oscillator can range from 0 to100 levels (0 being the floor and 100 being the roof). Essentially, if the price of an asset is at 0, it represents oversold conditions. Likewise, if the asset’s price is at 100, it represents overbought conditions.

Two Types of Indicators

Indicators are classified into two different types – Leading Indicators & Lagging Indicators. As the names pretty much suggest, leading indicators are those that predict the future price direction of any given currency pair. Essentially, these indicators precede the price action and predict the price.

Leading Indicator Examples: RSI (Relative Strength Index), Stochastic Indicator, & Williams %R.

Contrarily, lagging indicators act more like a confirmation tool. They follow the price action and help traders to understand the complex price charts better. One of the best use cases of a lagging indicator could be while testing the trend. We can confirm the trend along with its strength using a lagging indicator.

Lagging Indicator Examples: MACD (Moving Average Convergence & Divergence) & Bollinger Bands.

That’s about a brief introduction to Indicators and Indicator trading. In the next lesson, let’s understand the pros and cons involved in Indicator trading. Once that is done, we can start learning some of the most reliable indicators and how to trade the markets using them. Cheers.

[wp_quiz id=”66227″]