Introduction
Leading and lagging indicators are not the only categorizations of technical indicators. If we dig deeper, we can find more classifications and momentum indicators are one such classification in leading indicators. Before getting into momentum indicators, let’s first define the term momentum. Momentum, in general (physics), is the product of mass and velocity. The meaning of momentum is not different in trading too.
What are the Momentum Indicators?
Momentum indicators are a type of indicator that determines the velocity or the rate at which the price changes in security. Unlike moving averages, they don’t depict the direction of the market, only the rate of price change in any timeframe.
Calculating Momentum
The formula for the momentum indicators compares the most recent close price with the close price of a user-specified time frame. These indicators are displayed as a separate line and not on the price line or bar. Calculating momentum is simple. There are two variations to it but are quite similar. In both, momentum is obtained by the comparison between the latest closing price and a closing price ‘n’ periods from the past. The ‘n’ value must be set by the user.
1) Momentum = Current close price – ‘n’ period close price

2) Momentum = (Current close price / ‘n’ period close price) x 100
The first formula simply takes the difference between the closing prices while the second version calculates the rate of change in price and is expressed as a percentage.
When the market is moving upside or downside, the momentum indicator determines how strongly the move is happening. A positive number in the first version determines strength in the market towards the upside, while a negative number signifies bearish strength.
How are Momentum Indicators useful?
As mentioned, momentum indicators show/predict the strength of the movement in prices, regardless of the direction, be it up or down. Reversals are trades where one can make a massive killing with it. And momentum indicators help traders find spots where there is a possibility of the market to reverse. This is determined using a concept called divergence, which is discussed in the subsequent section.
Momentum indicators are specifically designed to show the relative strength of the buyers and sellers. If these indicators are combined with indicators that determine the direction of the market, it could turn out to be a complete strategy.
Concept of Divergence
Consider the chart of EUR/USD given below. The MACD indicator (momentum indicator) is plotted as well. From the price chart, the market was in a downtrend, but the divergence was moving upward. It means that the indicator has diverged from the price chart and is indicating that the sellers are losing strength.
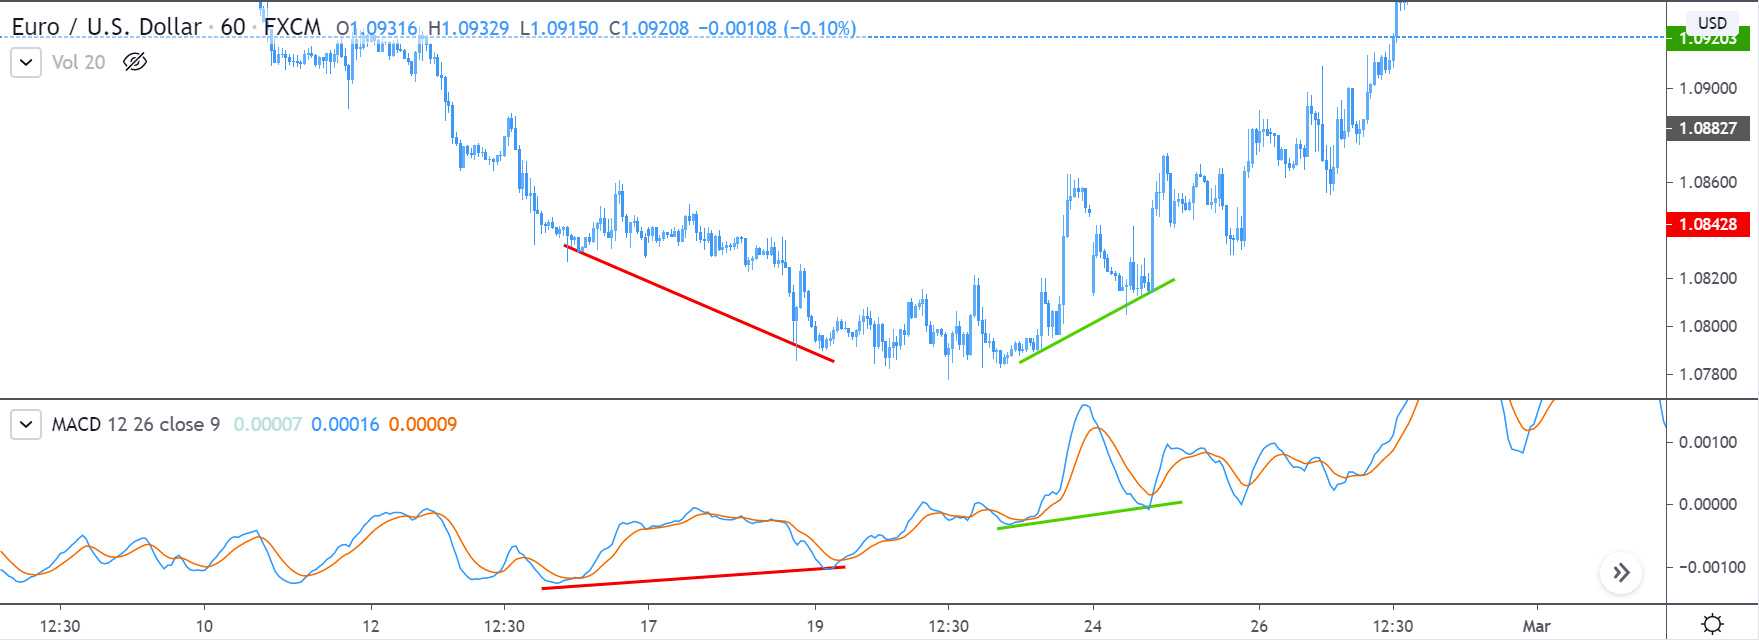
In hindsight, the market reversed its direction and started to move upwards. Hence, the MACD predicted the reversal in the market. Moving forward, when the market laid its first higher low, the MACD too was inclined upwards, indicating that the buyers are strong, and the uptrend is real. And yet again, the MACD proved itself right.
This concludes the lesson on momentum indicators. In the coming lessons, let’s get more insights over this topic. Don’t forget to take the below quiz before you go. [wp_quiz id=”70612″]