Introduction
In the past two sections of this course, we have discussed two of the most important tools in Technical Analysis – Fibonacci & Moving Averages. These two are discussed in an elaborated way because you might be using them in conjunction with many of the other reliable indicators in the market. They can be used standalone not just to take trades but also for different other purposes. For instance, Moving Averages can be used to identify the direction of the trend. Likewise, Fibonacci Levels can be used to test the reliability of any support and resistance level.
Since we have completed learning these crucial tools, it’s time for us to extend our learning to understand specific technical tools known as indicators and oscillators. There are many indicators and oscillators in the market. Some are reliable, and some are not. So in the next few course lessons, we will be discussing some of the most credible and reliable indicators. In this lesson, let’s first understand what an Indicator basically is and why it is important to use them in technical analysis.
What is an Indicator?
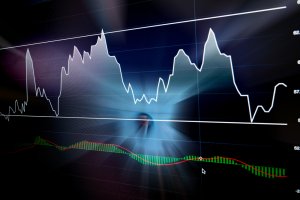
An indicator is a tool that is used by technical traders and investors to understand the price charts and market conditions. The important purpose of any indicator is to interpret the existing data and accurately forecast the market direction. These indicators are built on various mathematical calculations by market experts.
These days, with the advent of technology, hundreds of indicators can easily be accessed. They are available on most of the charting platforms that we currently use, like MT4 & TradingView. Many of the reliable indicators we have today are a result of extensive research and back-testing. Any technical indicator considers a lot of important data like historical price and volume to predict the future price of an asset.
Indicators are an integral part of technical analysis, and the number of traders who just rely on indicators to take trades is pretty high. Typically, most of the indicators overlay on the price charts to predict the market trend. However, there are indicators that position themselves below the price chart to make users understand the overbought and oversold market conditions.
Oscillators are nothing but range-bound indicators. Which means, an oscillator can range from 0 to100 levels (0 being the floor and 100 being the roof). Essentially, if the price of an asset is at 0, it represents oversold conditions. Likewise, if the asset’s price is at 100, it represents overbought conditions.
Two Types of Indicators
Indicators are classified into two different types – Leading Indicators & Lagging Indicators. As the names pretty much suggest, leading indicators are those that predict the future price direction of any given currency pair. Essentially, these indicators precede the price action and predict the price.
Leading Indicator Examples: RSI (Relative Strength Index), Stochastic Indicator, & Williams %R.
Contrarily, lagging indicators act more like a confirmation tool. They follow the price action and help traders to understand the complex price charts better. One of the best use cases of a lagging indicator could be while testing the trend. We can confirm the trend along with its strength using a lagging indicator.
Lagging Indicator Examples: MACD (Moving Average Convergence & Divergence) & Bollinger Bands.
That’s about a brief introduction to Indicators and Indicator trading. In the next lesson, let’s understand the pros and cons involved in Indicator trading. Once that is done, we can start learning some of the most reliable indicators and how to trade the markets using them. Cheers.
[wp_quiz id=”66227″]


