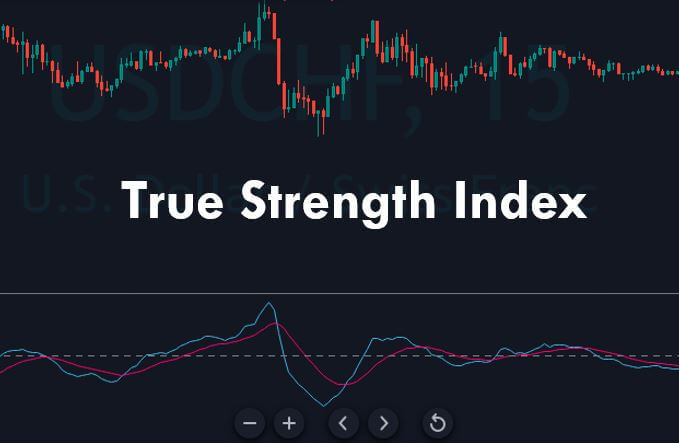
Categories
Forex Course

148. How To Fade The Breakout By Successfully Trading It?

Introduction

Most retail traders have a greedy mentality, so they always prefer to trade the breakouts to catch the home run. They believe in considerable gains in huge moves. Trading smaller moves are something they are not interested in because it takes a lot of work and time to scan the market. The problem with breakout trading is that the majority of the breakouts fail. To make consistent money from the market, professionals always prefers to fade the breakout. The fading breakout essentially means trading a false breakout.

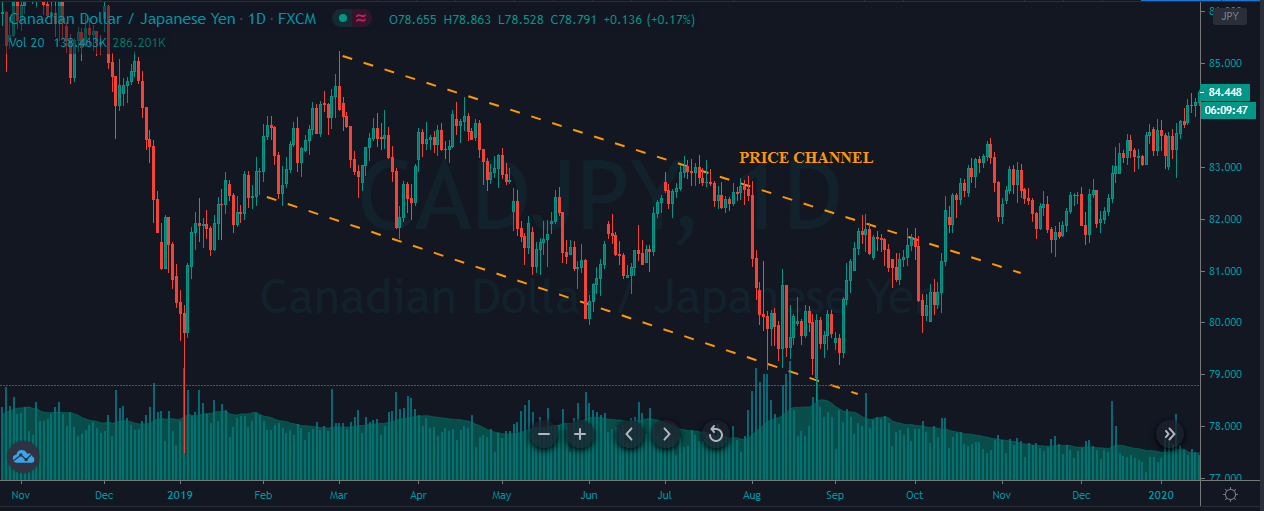
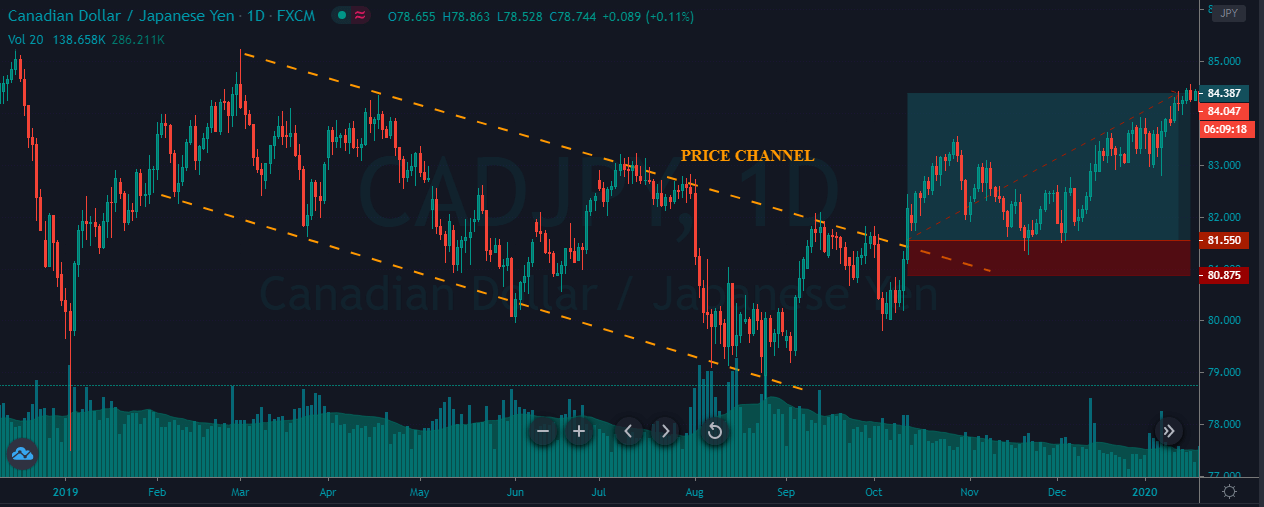
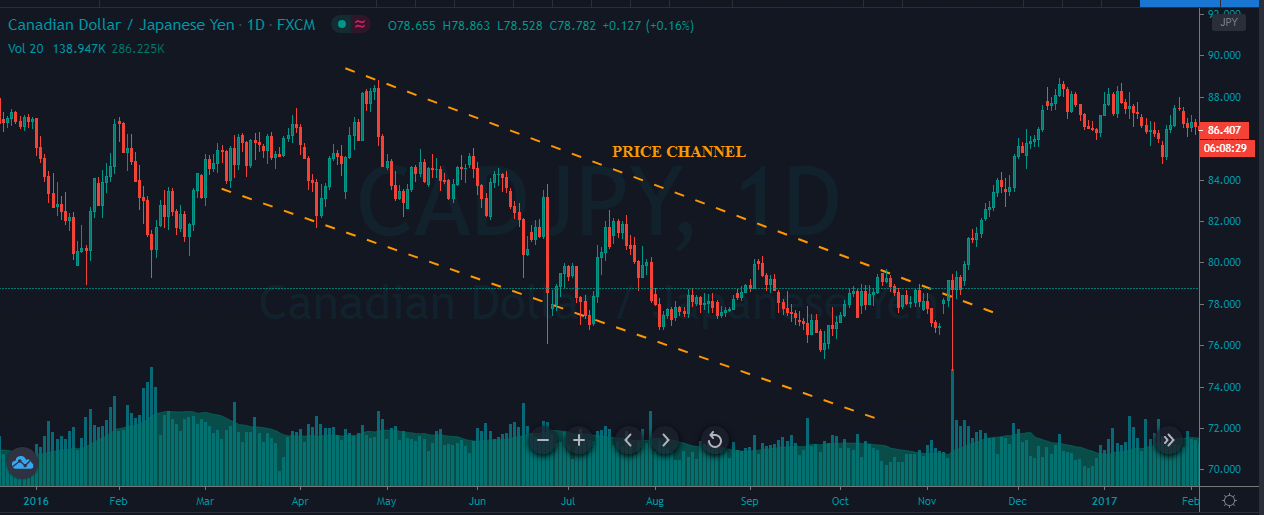
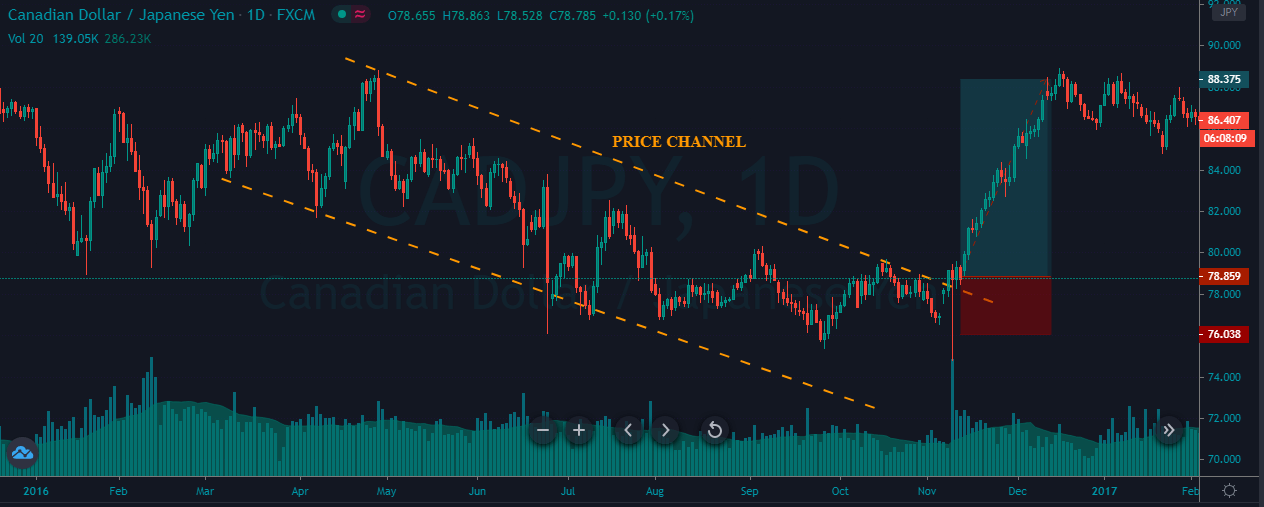
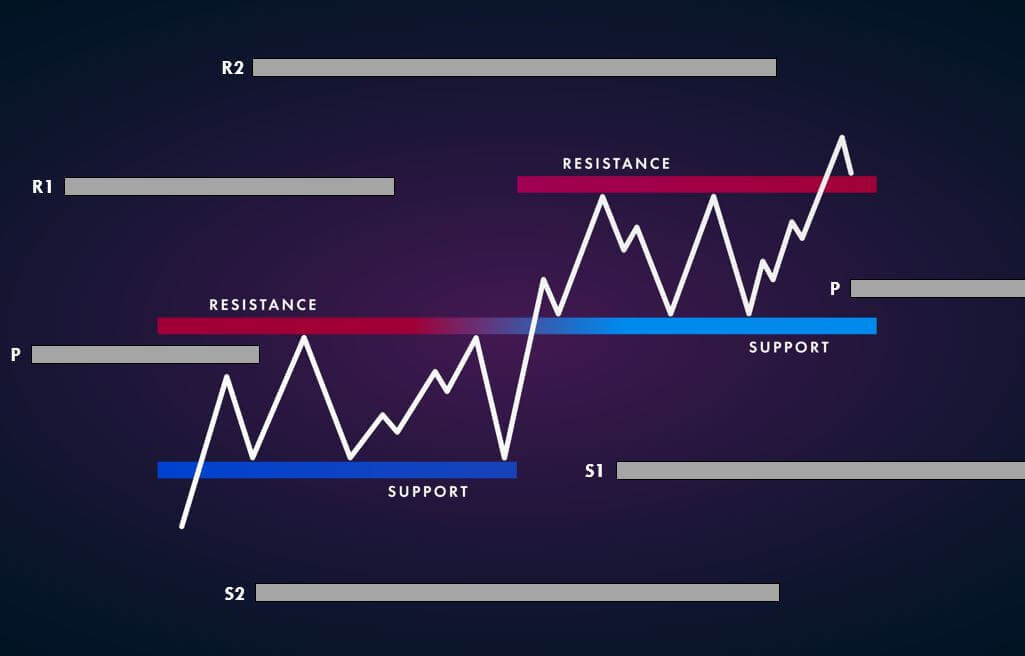
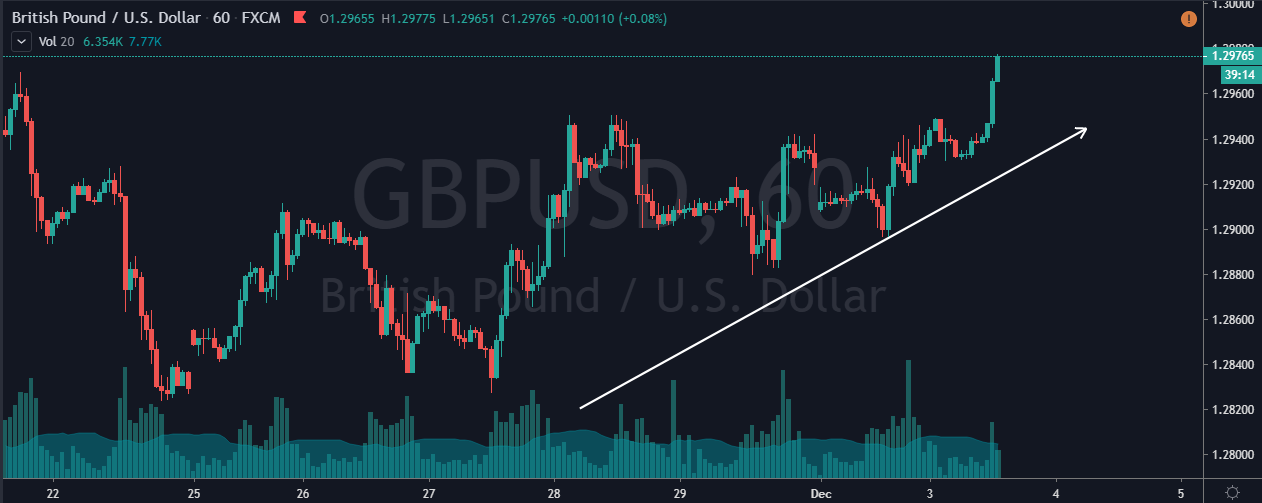
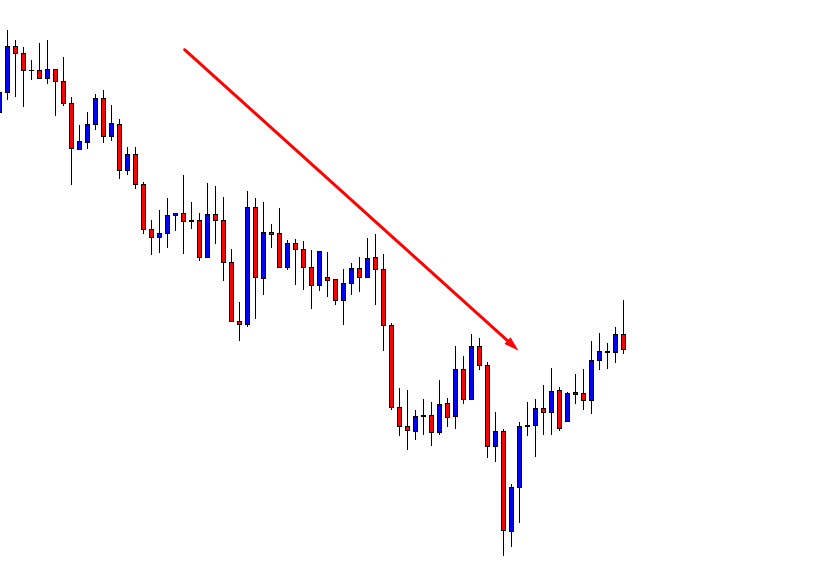
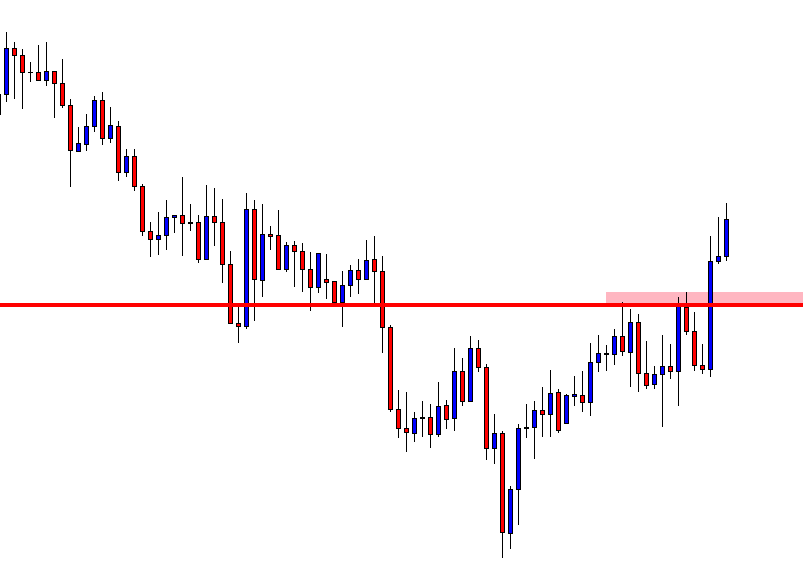
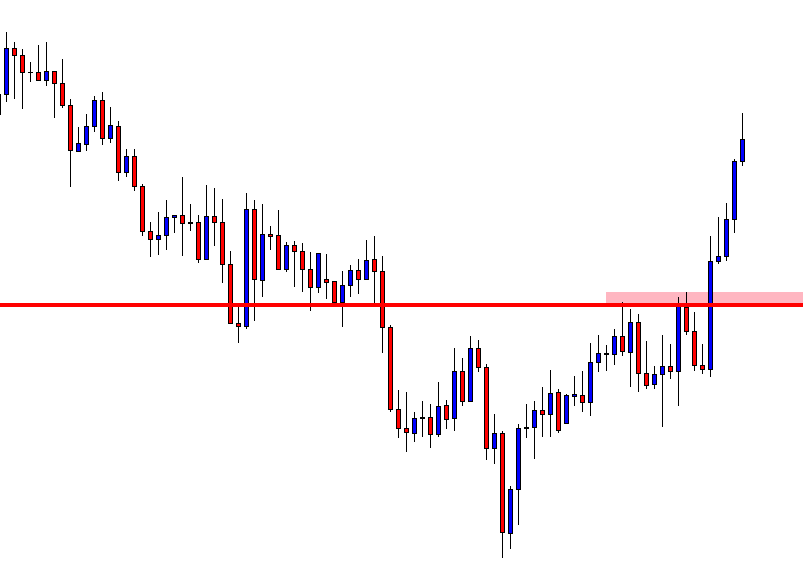
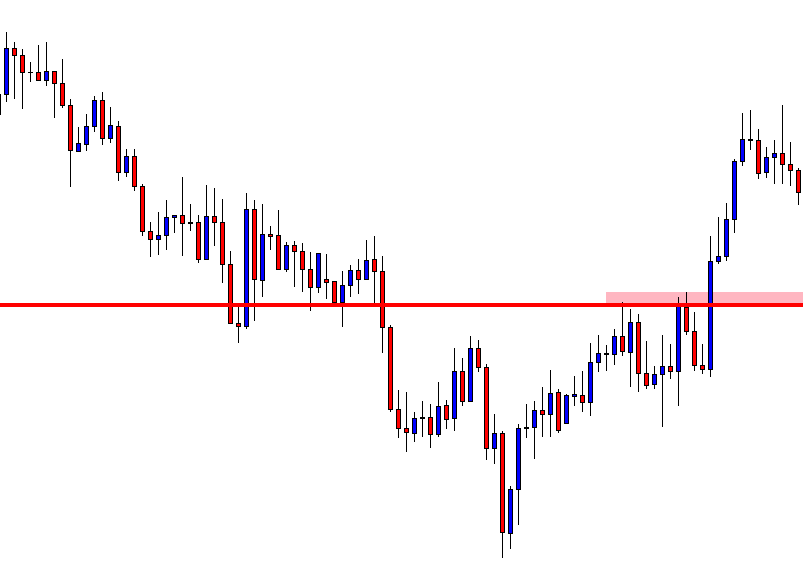
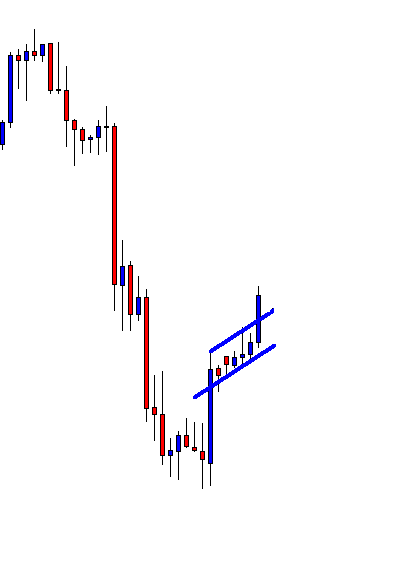
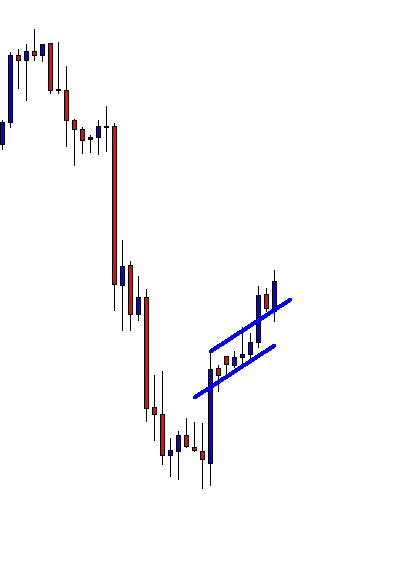
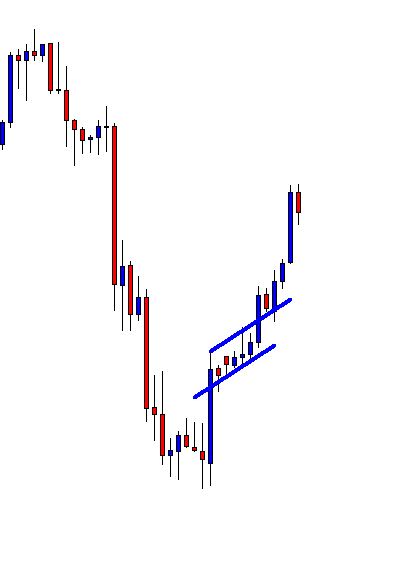
Fading Breakouts = Successfully trading the False Breakout

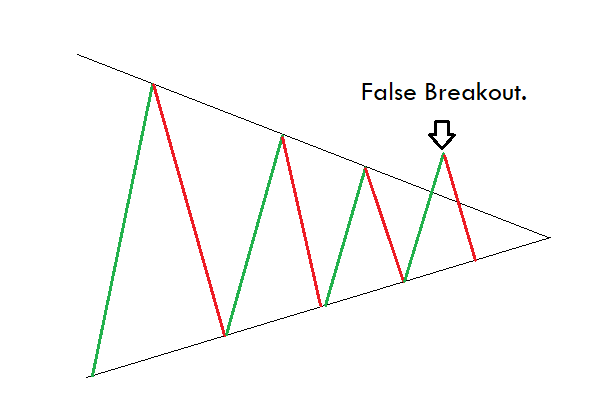
The image above represents the formation of a false breakout, which gives us a potential sell opportunity. Experienced industrial traders are always interested in fading the breakout because they know the crux of it. Most of the time, when the price action attempts to fade the breakout, it fails and closes back inside any of the major levels. Therefore, fading the breakout is always a smarter move than avoiding it.

Trading Strategies

Always remember that fading the breakout is a short term strategy. Therefore, please do not expect a home run while taking these trades. What we are doing here is that we are trading the false breakout moves. During the fight between the buyers and sellers, we will witness the initial moves, often failing to give the breakouts.

We are just taking advantage of these exact moves. In the end, one party always wins, and we will eventually get the breakout on the price chart. Instead of waiting for the home run, it is always advisable to trade some smaller moves, and if the market allows the home run, we must definitely go for it.
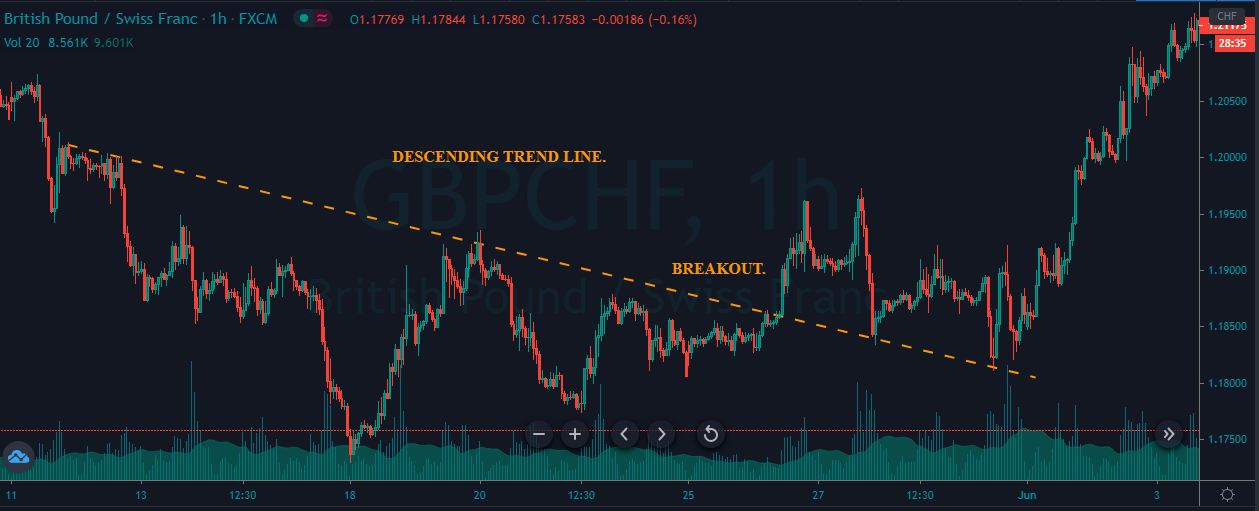
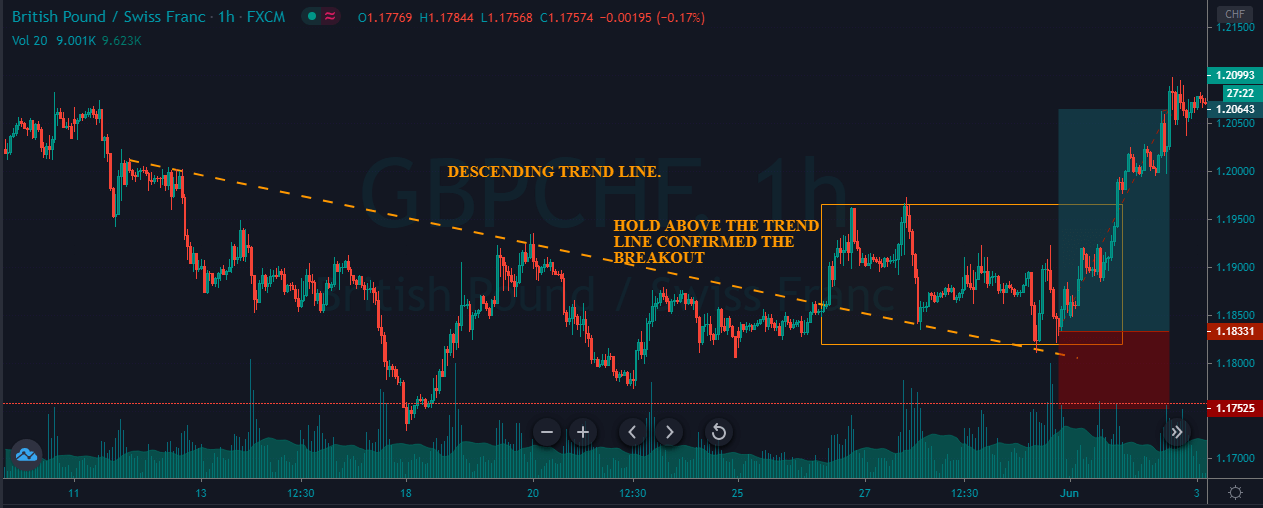
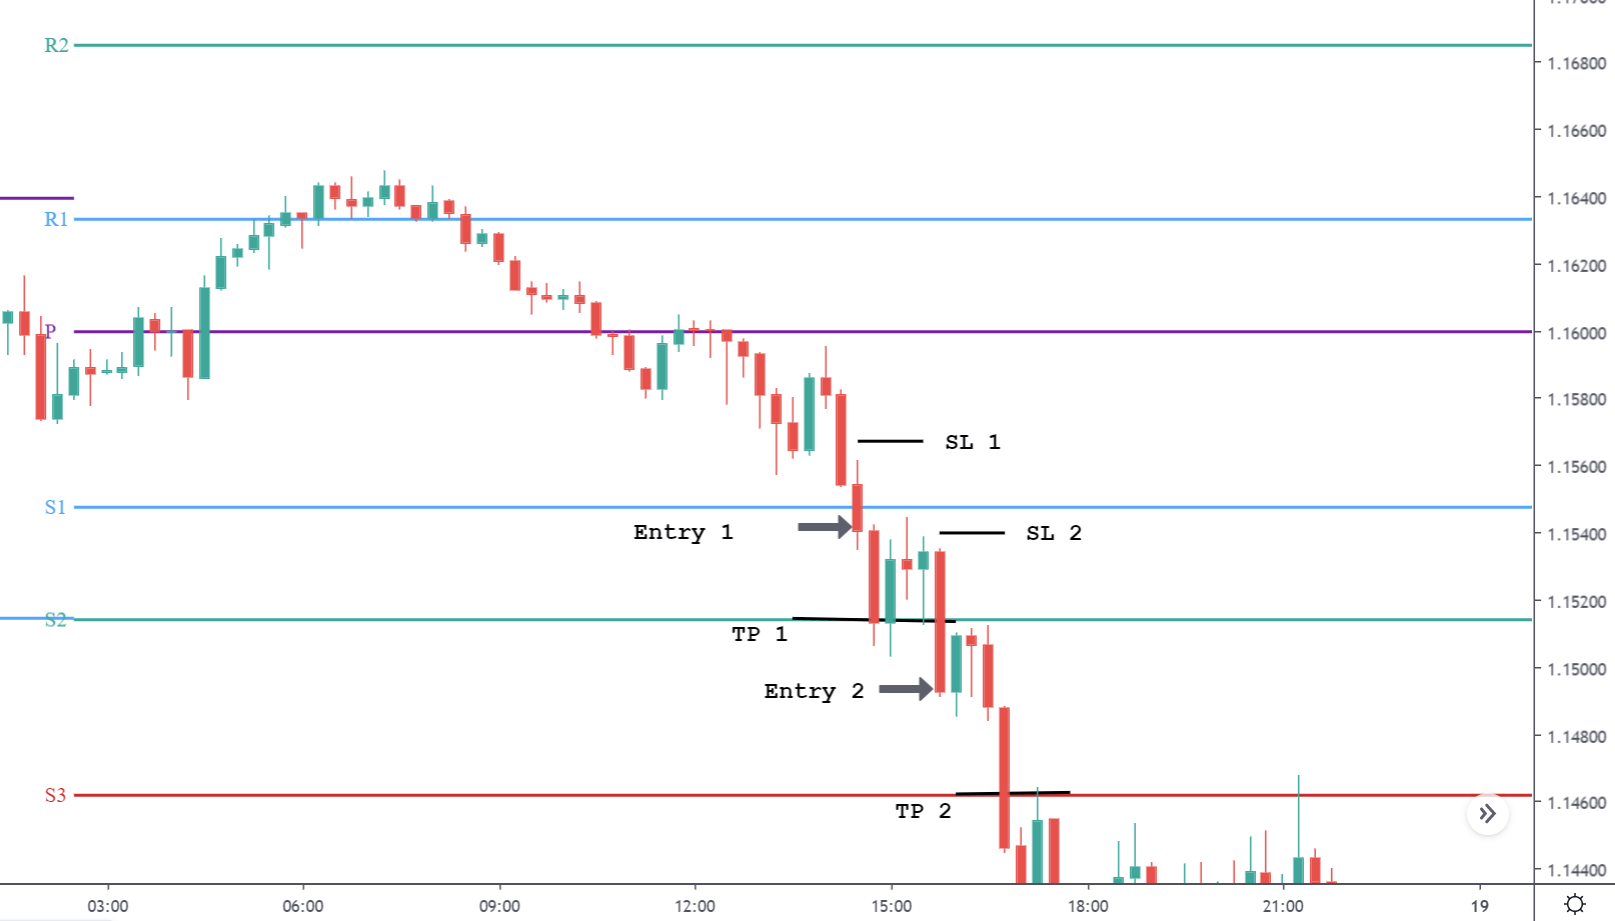
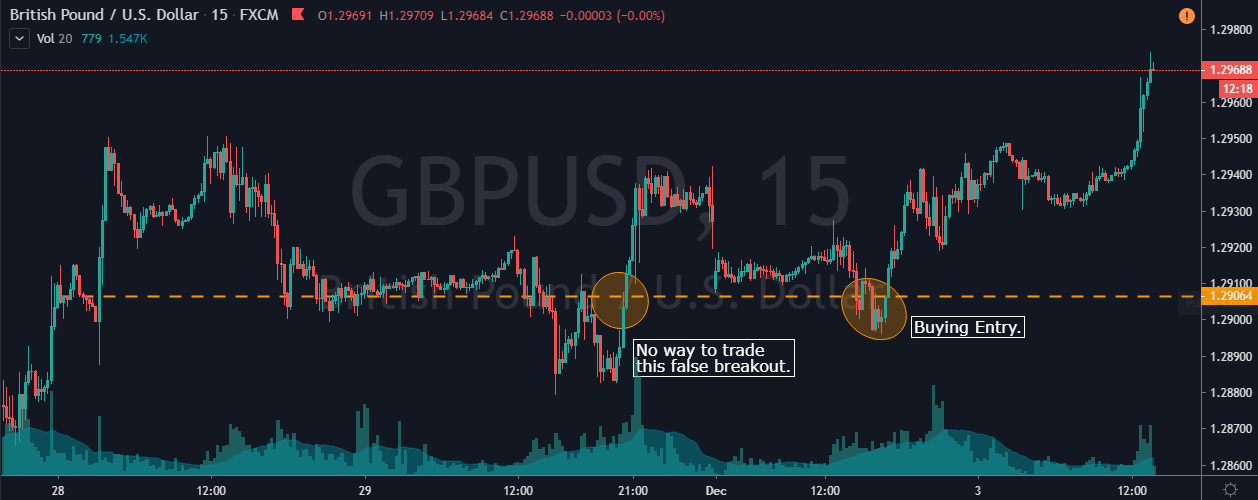
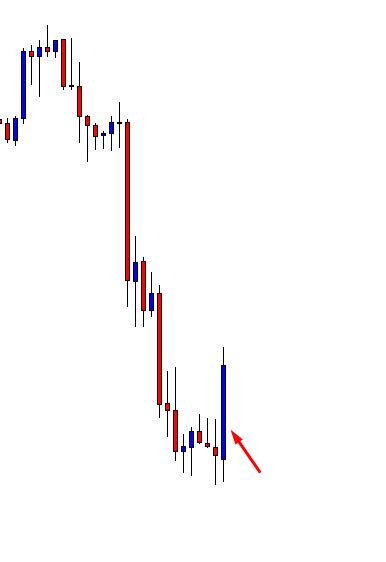
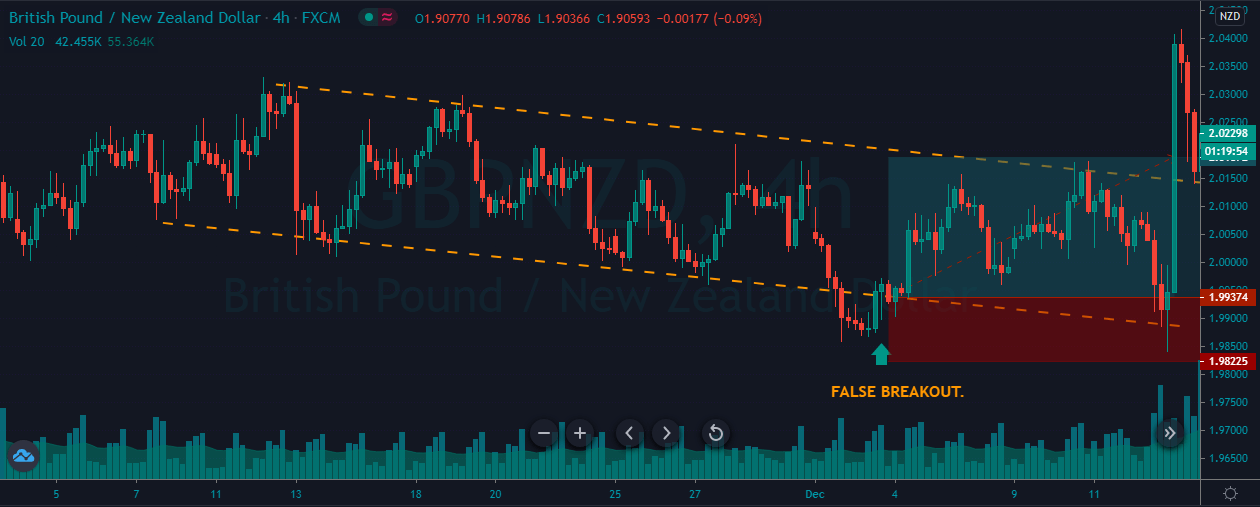
Buy Trade

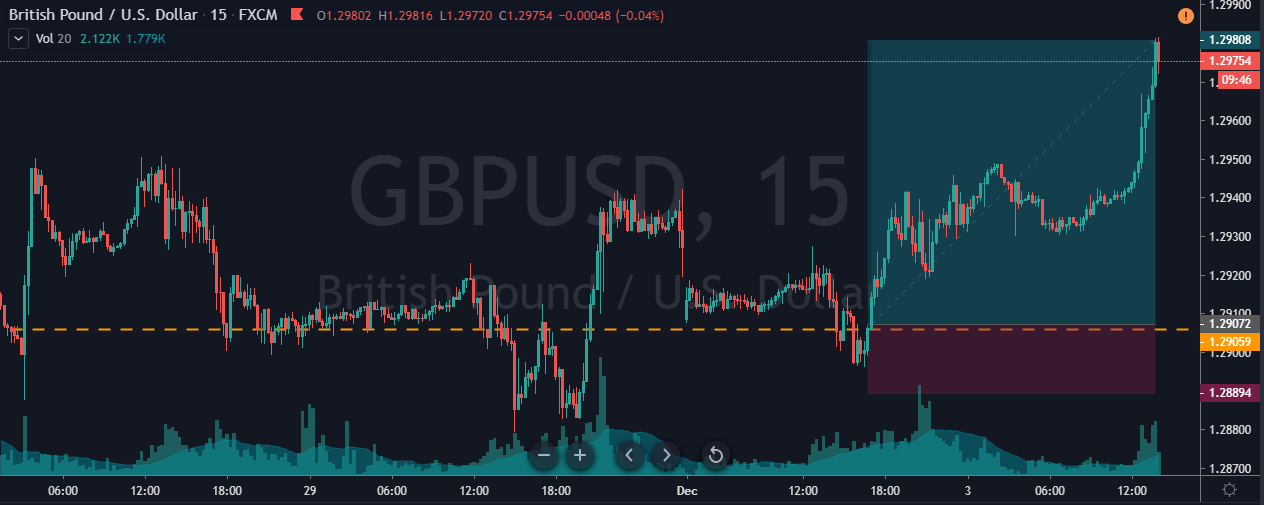
The price chart below represents a false breakout in the GBP/NZD Forex pair.

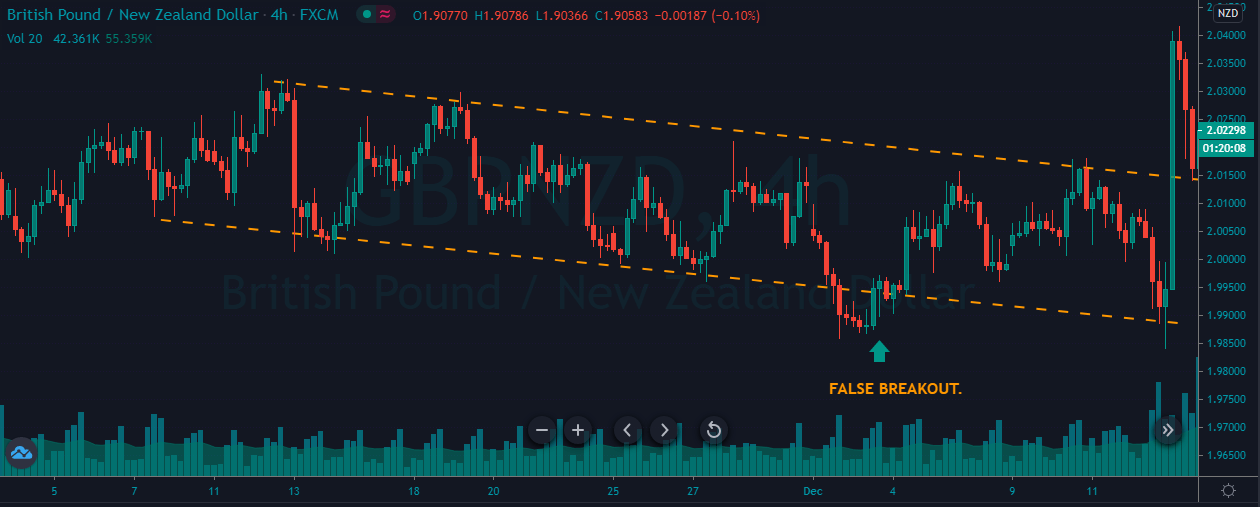
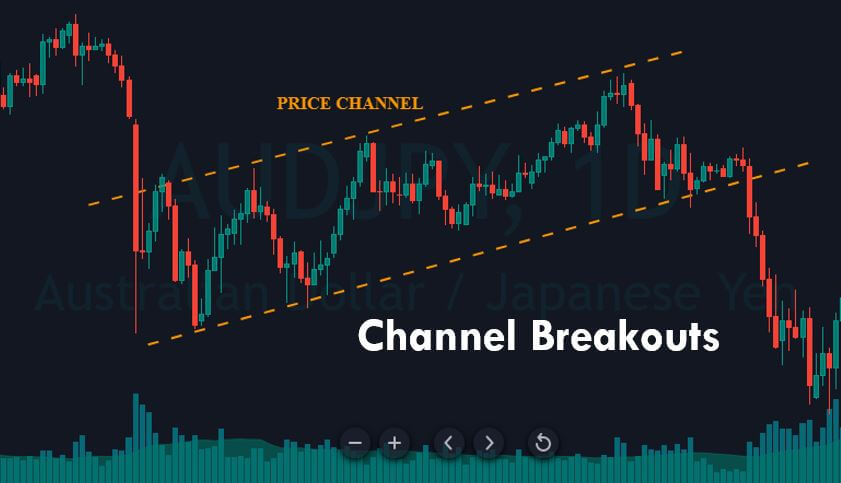
As we can see in the below chart, where the price action breaks below the channel, it came back right into the channel, indicating a false breakout. After the breakout, we can see the price action holding at the support zone. We decided to go long after we saw the red candles struggling to go down and when a clear big Green Candle is formed. Instead of being disappointed that the breakout didn’t happen to take the trade, these small trades inside the major areas come handy to make money.
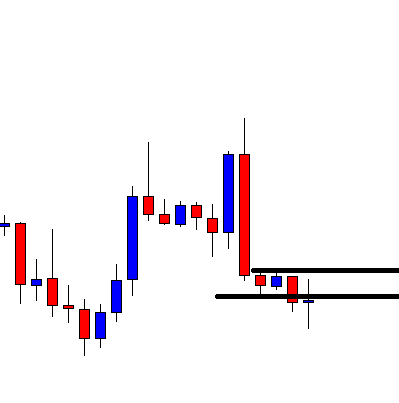
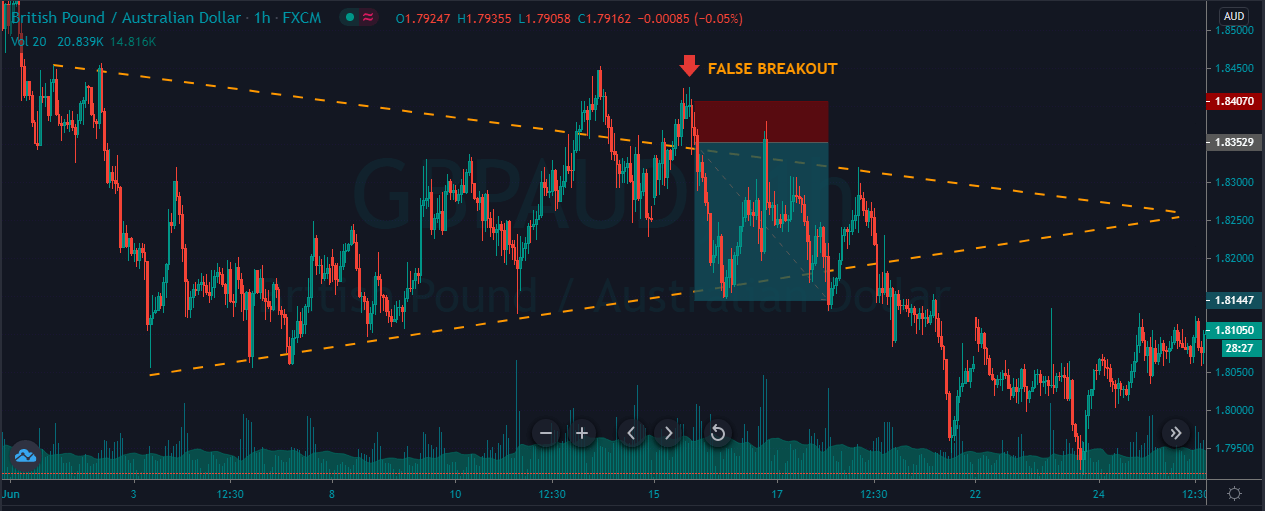
Sell Trade

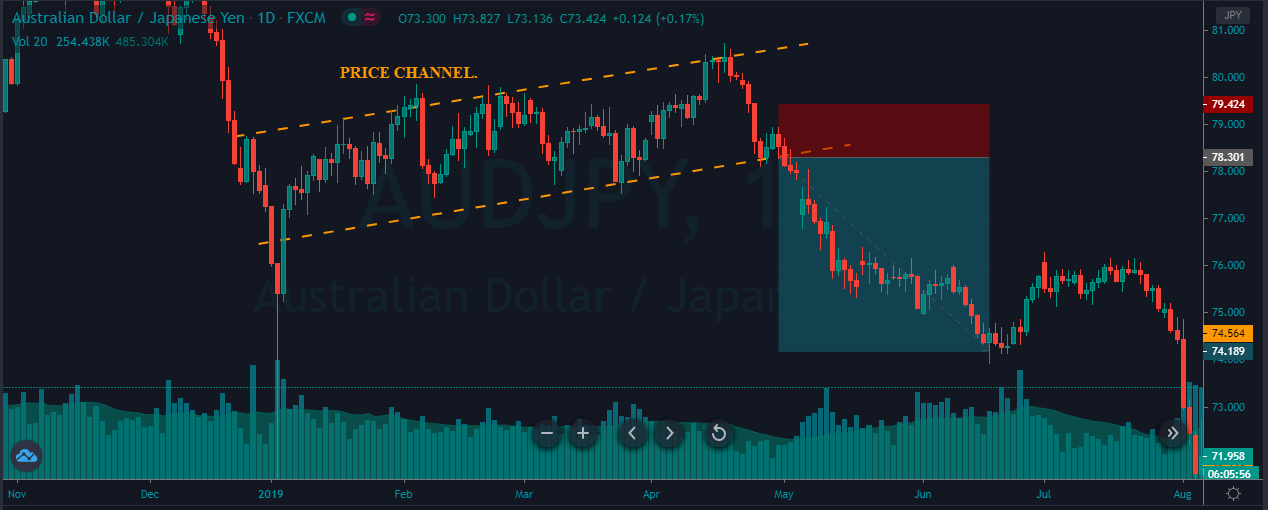
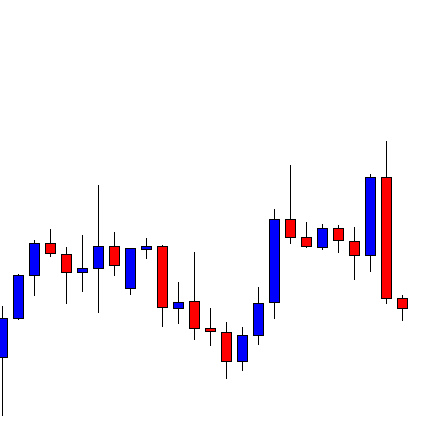
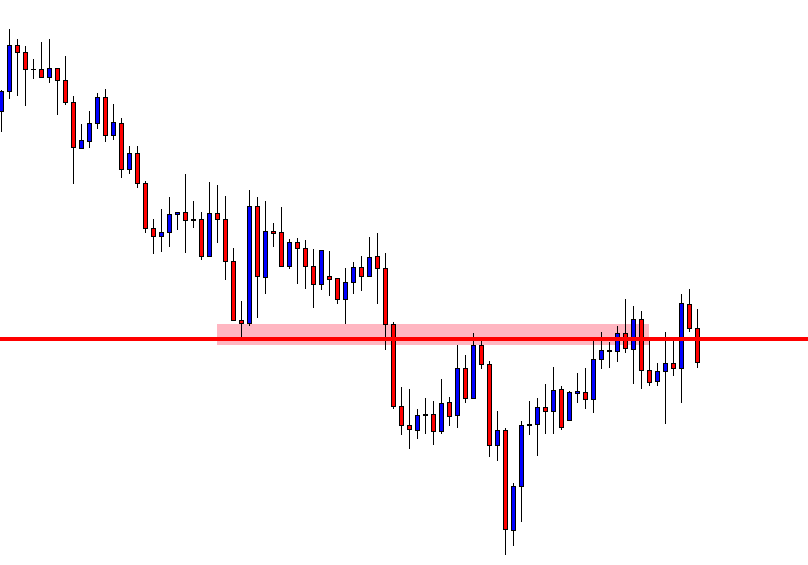
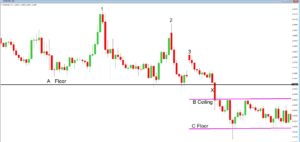
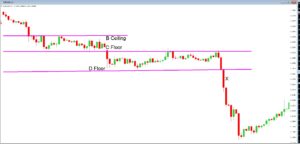
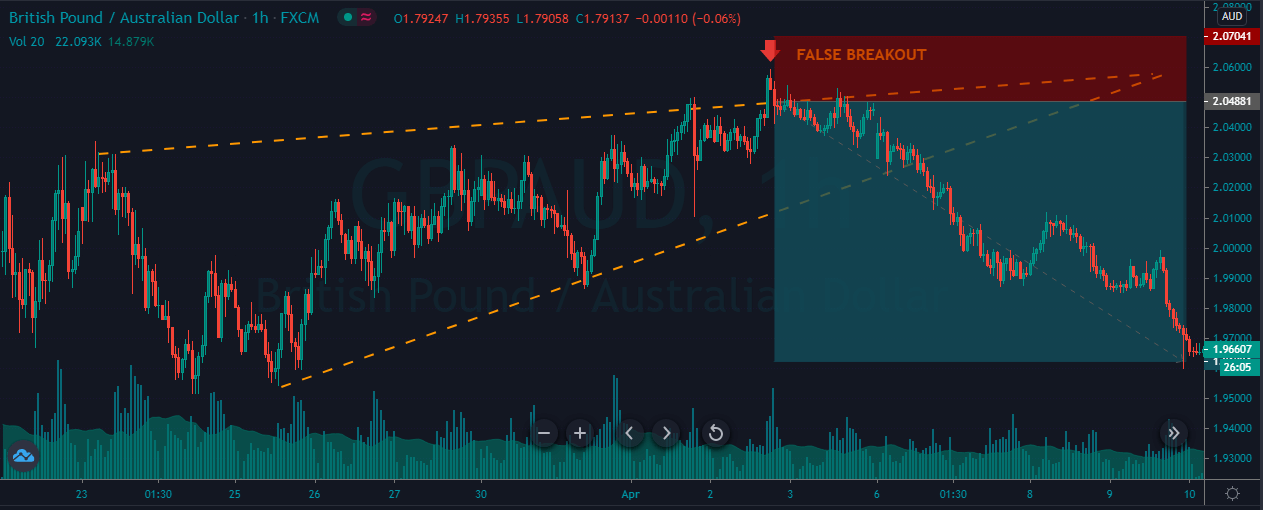
The image below represents the formation of a false breakout in the GBP/AUD Forex pair.

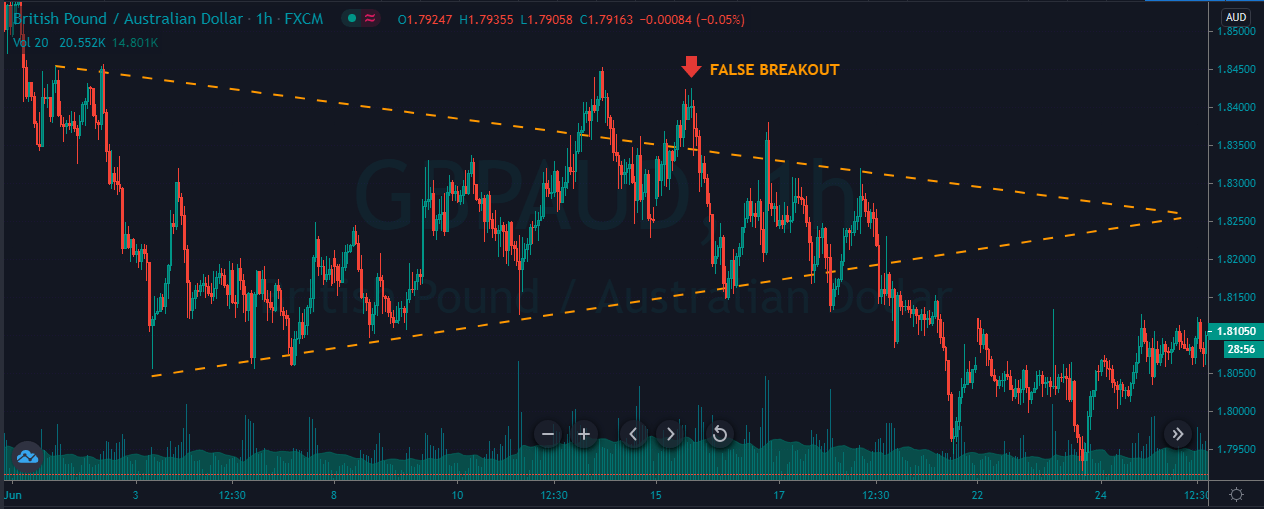
As you can see, the image below represents our entry, exit, and stop-loss in this pair. When the price failed to go above the major level, it is an indication for us to take a trade inside the triangle. Therefore, when the price came back, we took the sell entry to the most recent support area. The stops above the entry should be good enough.
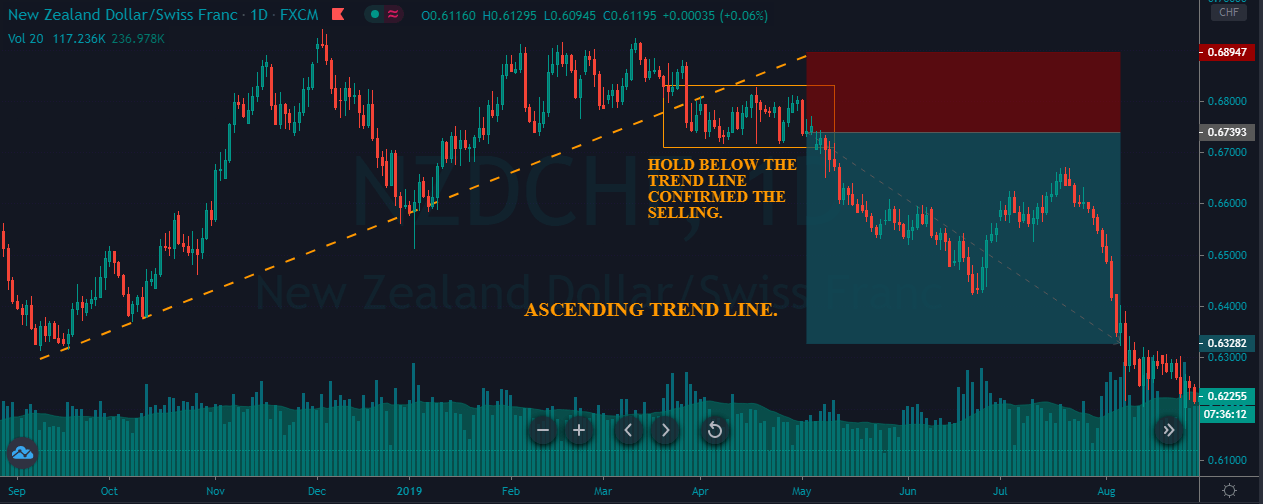
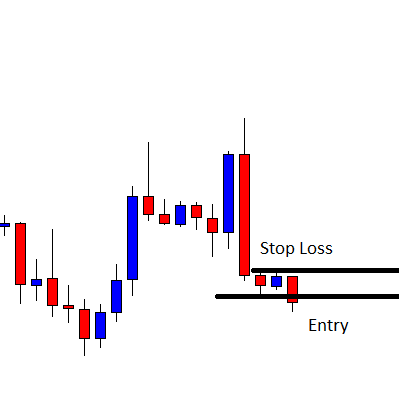
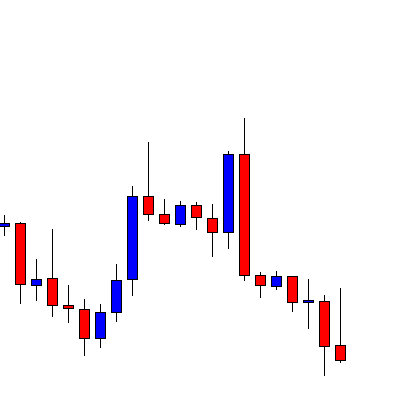
Another Sell Trade

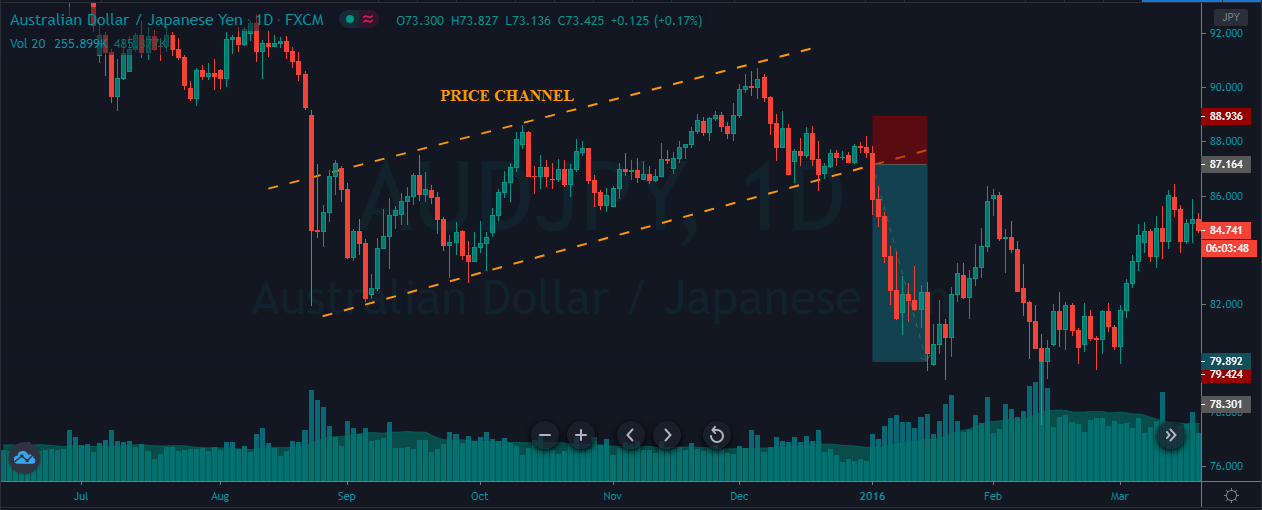
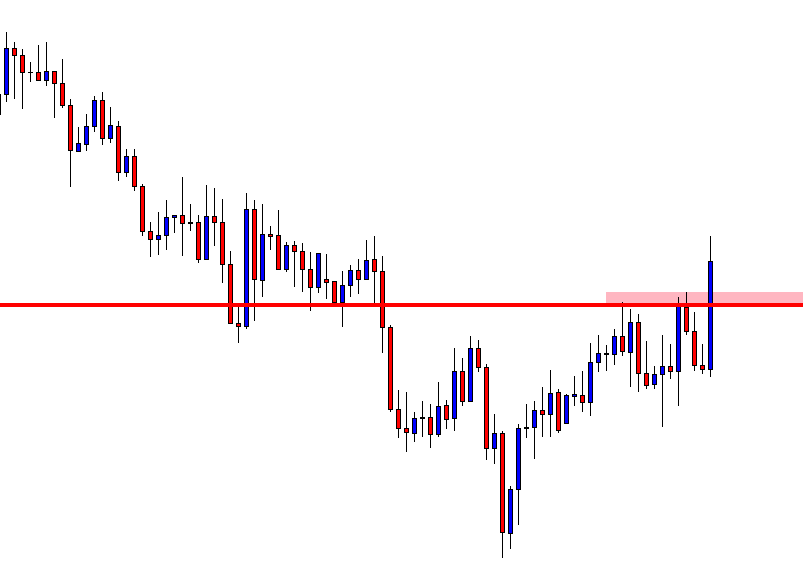
The image below represents a false breakout in the GBP/AUD Forex pair.

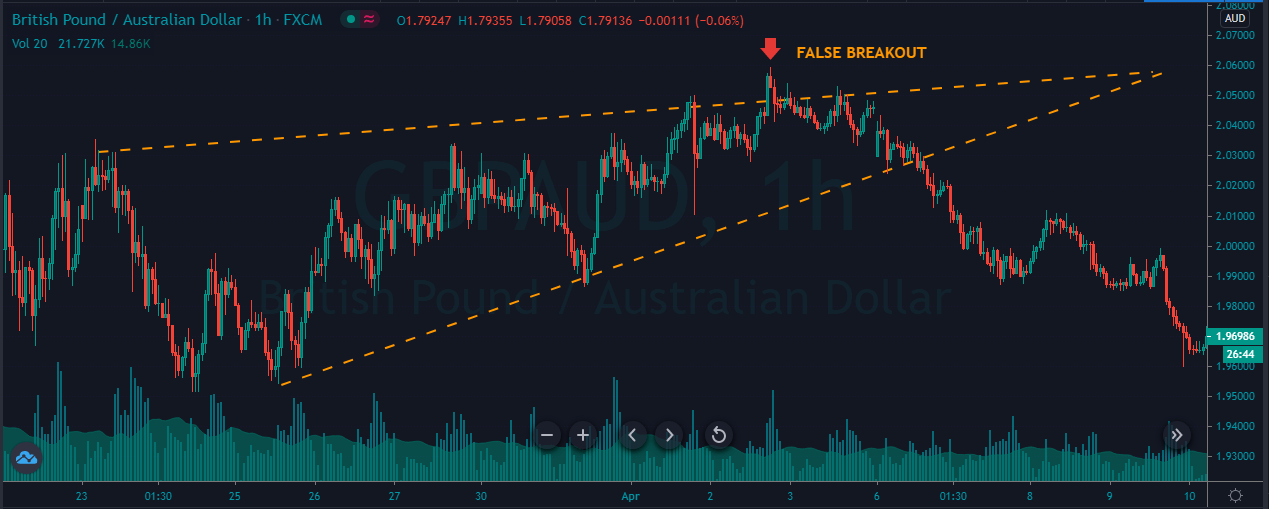
As you can see, when the prices failed to break the trend line and started to hold below the trend line, it was a sign that it is a failed breakout. It also indicates that the sellers are going to take over the market when we look-in the price action perspective. In this trade, we choose not to close our position at the most recent higher low. Instead, we went for the actual breakout. The holds below the support area is an additional confirmation for us to go to the most recent lower low area.

That’s about Fading the breakout, and we hope you find this lesson informative. Let us know if you have any questions in the comments below. Cheers!

Categories
Forex Course

145. Trading The Triangle Pattern Breakouts

Introduction

Breakouts trading and trading the triangle chart pattern are two different trading tools. A breakout occurs when the price goes above or below the significant support resistance area. It indicates that the price is ready to move in the direction of the breakout, and any entry near the breakout will be fruitful. This is the reason why breakout trading is considered a leading method of trading in the industry as it helps the traders to anticipate the trend and ride the potential moves.

On the other hand, the Triangle is a technical chart pattern. The best description of the triangle chart pattern is as a horizontal continuation chart pattern, which helps the traders in finding the best entry on the price chart. At the beginning of the pattern, it is widest, and as the market continues the ranging move, the price starts to move in a limited, narrow range, and as a result, we witness the point of the Triangle on the trading chart.

The Trading Strategies

There are two types of triangle chart patterns. The first one is ascending chart pattern, and the second is the descending chart pattern.

Ascending Triangle Chart Pattern

Ascending Triangle is a bullish chart pattern that helps traders to take buy trade in an ongoing uptrend. The image below represents the formation of an Ascending Triangle chart pattern in the CAD/JPY Forex pair.

The image below represents our entry, exit, stop-loss, and take-profit in the CAD/JPY forex pair. As you can see, in an uptrend, when the price broke above the chart pattern line, it is a sign that the buyers are strengthening. Therefore, if the price is holding above the support line, it is an indication for us to go long in this pair.

Right after our entry, we can see that the price smoothly ran towards the north, and printed a brand new higher high. We can close our trade based on any nearest support area, and we also can use any indicator for the exit. The stop-loss order was placed just below the entry. In a strong trending market, the smaller stops are good enough to ride the trend.

Descending Triangle Chart Pattern

The Descending Triangle is a bearish chart pattern that helps traders in taking sell trades in an ongoing downtrend. The image below indicates the formation of a Descending Triangle pattern in the GBP/CAD Forex pair.

The below price chart of the GBP/CAD pair represents our entry, exit, and stop-loss. In a downtrend, when the price breaks below the support area, it’s a sign that the strong buyers failed to push the price higher, and any hold below the resistance line is an indication to go short. Soon after our entry, price blasted down south, printing a brand new lower low.

The descending Triangle is simple and easy to trade Forex chart pattern. Most of the time, this pattern offers excellent risk to reward entry trades. So when you see the pattern on the price chart, don’t forget to scale your position for more significant gains.

That’s about trading the ascending and descending Triangle chart pattern breakouts. Take the below quick quiz before you go. Cheers.

[wp_quiz id=”85881″]
Categories
Forex Course

144. Trading The Channel Breakouts In The Forex Market

Introduction

Breakout trading is one of the easiest and most common and smartest ways to trade the market. It doesn’t matter whether you are a scalper, intraday trader, investor, or a swing trader; you can always make money in the market if you master the breakout trading only.

Breakout trading is an attempt to enter in the market when the price action moves outside the significant price range, most of the time it takes an immense amount of power to break the significant areas, and you will always witness the spikes, fake-outs near the breakouts, this is because both of the parties tries to dominate the shows.

What is a Price Channel?

A price channel is a state of the market that connects the swing high and swing higher lows in an uptrend. Conversely, in a downtrend, it connects the swing low and lower low. The upper trend lines act as a resistance to the price action, and the lower trend lines act as a support line on the price chart. The price respects these areas by staying inside the price channel. When the opposite party becomes dominates, then we witness the breakout in a channel.

Trading Channel Breakouts

Buy Trade 1

The price chart below represents a channel breakout in the CAD/JPY forex pair.


As we can see, the sellers are getting weaker in the channel, and as a result, soon after the breakout price action changed its trend. So, around 81.55, the price action broke to the north and printing a brand new higher high.

Buy Trade 2

The image below represents the formation of a price channel in the CAD/JPY forex pair.

As we can see, the below price chart represents our entry-exit and stop loss in this pair. So during the downtrend, both buyers and sellers were holding equal power. Near to the 78.00 area, price action broke to the north, and after the breakout, we took a buy-entry. After our entry, the price made a brand new higher high, but the hold at the most recent higher high convinced us to close our trade at the 88.37 level.

Sell Trade 1

The image below represents the formation of a Price channel in a downward trend.


The image below represents our entry, stop loss, and take profit in this Forex pair. The channel is typically formed when there is no trend, or when the trend is about to end. On a lower timeframe, we can trade inside the Channel, but on this timeframe, the break below the 78.30 level indicates that the sellers stole the show, and are ready for a brand new lower low.

Sell Trade 2

The image below represents a channel breakout in the AUD/JPY Forex pair.

Right after the price action approaches the most recent support area, it just got shot down and broke below the Channel. The strong red breakout candle is an indication for us to go short in this pair and right after our entry, we have witnessed a brand new lower low.

Trading channel breakouts is this simple. But minute details like drawing channel lines accurately is crucial. Let’s learn more breakout trading techniques in the upcoming lessons. For now, don’t forget to take the quiz.

[wp_quiz id=”85204″]
Categories
Forex Course

141. Understanding The Concept Of Breakout

Introduction

A price movement can be considered a breakout when the price clears any critical level on the price chart. These levels can be support/resistance, trend lines, Fibonacci levels, etc. Many professional traders wait for the price to hold above the breakout to take long positions. Conversely, they wait for the price to hold below the breakdown level to take short positions.

When the price confirms that the breakout is valid, volatility tends to increase as the price started to move in the direction of the breakout. The reason why breakout trading is popular among the traders is that it sets the future trend direction. This makes it easier for traders to make consistent profits from the market.

Breakout trading strategy is universal, and we can apply it to the hourly, daily, weekly, or even monthly timeframes. Investors, swing traders, and intraday traders prefer breakout trading the most compared to any other form of trading. The longer price action holds inside the breakout, the stronger breakout we must expect, and also, the longer time the price action moves in that direction.

During the consolidation phase, when the price is preparing to break out in any direction, we will notice a couple of price pattern formations such as channels, triangles, flags, etc. These patterns will give us the clues on which side the breakout may occur—using these signals to enter a trade before the breakout is crucial. But if you are a conventional trader, wait for the price to break above or below the price to take the trade.

Trading Various Breakouts

Trend Line Breakout
Ascending Trend line Breakout

The below price chart represents an ascending trendline breakout on the NZD/CHF daily Forex chart.

As you can see in the below image, when price action broke below the ascending trend line, it is an indication of sellers stepping into the game. The hold below the trend line confirms the selling entry. We have placed our stop-loss at the previous high and rode the huge downtrend.

Descending Trend line Breakout

The image below represents the breakout of a descending trend line in the GBP/CHF Forex pair.

As you can see below, we took a buy entry when price action went above the trend line and started to hold above. The hold confirms that the buyers are in control, and they are ready to make a brand new higher high. After our entry, price action blasted to the north and printed a brand new higher high. We chose to close our trade at the most recent higher high. The stop-loss order placed just below the trend line is safe enough.

Range Breakout

The price chart below represents a Ranging market in the NZD/JPY Forex pair.

Most of the time, you would have observed traders taking buy/sell trades when the market moves in a range. But in this strategy, let’s trade the market only when the price breaks the range. Just like any other breakout, Range breakout also indicates the winning of one-party over the other.

The hold above the breakout confirms that the range is broken, and it is a good idea to go long. We choose smaller stops because the hold above the range gave additional confirmation.

That’s about breakouts and how to basically trade different breakouts in the market. In the upcoming lessons, we will be going through many of the concepts related to breakouts.

Categories
Forex Daily Topic Forex Price Action

When a Double Top and an Engulfing Candle Comes Together

In today’s lesson, we are going to demonstrate an example of a chart where the price heads towards the downside upon making a double top. At the second rejection, the chart produces a bearish engulfing candle. Usually, a combination of these two does not usually go wrong. The price does not make a deep consolidation afterward. However, it still heads towards the South with good bearish momentum. Let us have a look at how it happens.

This is a daily chart. The chart shows that the last candle comes out as a Shooting Star. The daily –H4 combination traders may consider it as a bearish reversal candle and flip over to the H4 chart.

The H4 chart shows that the price produces a double top. At the second bounce, the reversal candle comes out as a bearish engulfing candle. This combination may attract the sellers to look for short entries upon consolidation and getting bearish reversal candle.

The chart produces a bullish candle. It finds its resistance and produces a bearish engulfing candle closing below consolidation support. The sellers may trigger a short entry right after the last candle closes by setting stop-loss above consolidation resistance and take profit with 1R. Here is an equation that we may think about that. The price does not make a deep consolidation. Since the price is bearish upon a double top and an engulfing candle, most probably, it will make a strong bearish move. However, if you are in doubt, leave it out. Let us proceed to the next chart to find out what happens.

The next candle comes out as a doji candle. The price heads towards the Stop Loss, but it does not hit, though. It looks good for the sellers since the candle closes below the breakout level. Let us proceed to the next chart to find out what the price does.

The chart produces a long bearish candle and hits the target of 1R. Shallow consolidation may hold the price back a little to hit the target in a hurry. However, in the end, the sellers make some green pips with a combination of a Double Top and an Engulfing candle.

This trade setup does not meet all the requirements for combination breakout trading. The trend starts from a Double top resistance along with a bearish engulfing candle; it continues its bearish journey with more candles even after a shallow consolidation. This is what a combination of a Double Top/Bottom along with an engulfing candle can do. Thus, be keen on a chart if a trend starts with a combination of these two.

Categories
Forex Course

96. Trading Breakouts using Pivot Points

-Introduction

We know that pivot points are no different from the typical support and resistance levels. We also saw how these levels were respected when trading a ranging market. But, could it used to trade breakouts? Let’s find out in this lesson.

Just like your normal Support and Resistance, the pivot levels don’t hold forever. At one point or the other, the price breaks out from these levels. In our range strategy, we always hit buy at the support and sell at the resistance. But there are times the market breaks from these levels and stops us out. When such things happen, we can develop another plan ready for the same and take advantage of it.

In the trading community, there are two types of traders: aggressive traders and conservative traders. And the approach to trade breakouts is different for both. So, we made two strategies to benefit the aggressive as well as the conservative traders.

The Pivot Points Breakout Strategy

Doing it the Aggressive way

The aggressive approach to trade breakouts is very simple. The strategy for such traders is to trigger the trade when the price breaks above resistance or below the support. The logic to this is that the resistance/support which was supposed to hold is now not being respected. It means that the opposite party is showing more strength. Hence, we will also be following the stronger side.

Aggressive traders are the ones to catch the initial move of the breakout. But there is high risk involved in these types of entries.

Trade Example

Below is the chart of GBP/CHF on the 15min timeframe. The pivot points are marked as shown. Initially, we can see that the price broke below S1 support. Here, aggressive traders can get in for a sell after the close of the candle. Later, the price continued to fall down and ended up breaking the S2 support as well. This could be another entry for the aggressive breakout traders.

Placements

As aggressive traders, it is important to have good risk management on the trades. The most basic necessity is the placement of stop-loss and take-profit orders. For the above trades, traders can keep the stop-loss just above the level they entered the trade. However, it would be better to place the stop-loss much higher than that level because we can stay safe from spikes. And a typical TP would be the next Support level. Refer to the above chart to get better clarity on it.

Doing it the Conservative way

The conservative approach is more of a safe approach to trade breakouts. According to this strategy, look to enter the trade when the price retests the level after breaking through that level. In trading terms, this is called the ‘role reversal’ concept. This concept simply means the turning of ‘support into resistance’ and ‘resistance into support.’ For example, when the price breaks below the support level, it is not a ‘support’ anymore; but is now ‘resistance.’ Now, let’s put this into action.

Consider the same chart shown above. We shall be looking if there are opportunities for conservative traders in the same market. In the below chart, we can see that the market broke below the S1. So, now we treat S1 as the resistance and prepare to sell when the price retraces to the S1 level. Similarly, we can enter for a sell when the price breaks below S2 and retests back to S2.

When it comes to the placement of stop-loss and take-profit, one can follow the same approach, as explained in the aggressive traders’ placement.

This brings us to the end of this lesson. Note that the above strategy is only to get an understanding of how to trade breakouts using pivot points. It is highly recommended to apply other technical tools to have more odds in your favor. Cheers.

[wp_quiz id=”69720″]
Categories
Forex Course

85. Learning To Trade By Using The ‘True Strength Index’ Indicator

Introduction

The True Strength Index (TSI) is a technical indicator used to analyze the financial markets. ‘William Blau’ developed the indicator in the mid of 1991. If you are interested to know more about William Blau and the technical tools developed by him, we suggest you read his book – ‘Momentum, Direction, and Divergence.’ The True Strength Index abounds between the +100 and -100 levels, and most of the values fall between +25 and -25.

Typically, the price action moves between these levels, and they are considered as overbought and oversold levels. This indicator also warns the weakening of a trend through the divergence and indicates a potential trend changes via centerline. When the indicator goes above the zero-level, it means the indicator is in positive territory, and the buying market is strong. But if the indicator goes below the zero-level, it means that the indicator is in negative territory, and the selling market is strong.

Below is how the price chart looks when the True Strength Index indicator is plotted on it.

True Strength Index Trading Strategies

Traditional Trading Strategy

Buy Example

We must look for buy trades when the crossover of the TSI lines happen at the oversold levels and hold it until the price action reaches the overbought level. The image below represents a buying entry in the AUD/JPY Forex pair. In an uptrend, when the market gives a decent pullback, the TSI indicator reached the oversold area, which means that the sellers are exhausted now and prepare for the buys. Soon after the exhaustion, the crossover happened on the TSI indicator, indicating a buy trade.

Sell Example

Look out for selling opportunities when the crossover happens at the overbought levels and hold it until the price action reaches the oversold level. The below chart represents the sell trade in the AUD/JPY Forex pair. The TSI indicator reached the overbought level when the price action gave enough pullback; the crossover indicates the failure of buyers to move price action higher, and as a result, reversal happened. We can exit our positions at any of the major support levels, or when the indicator gives an opposite signal.

TSI Breakout Strategy

Buy Example

The strategy is to identify a breakout on the price chart. Once the breakout happens, the TSI indicator must be above the zero-line to take the buy trade. We can see that in the below image when the breakout happened on the EUR/CAD Forex pair. After the breakout, we can see that the TSI indicator was also above the zero line, indicating a buy signal in this pair. We can exit our positions at the higher timeframe’s resistance area or exit when the TSI reaches the overbought area.

Sell Example

In a downtrend, find out a sell-side breakout. After the breakout, if the TSI indicator goes below the zero-line, it indicates a sell trade. As we can see in the image below, when the price action broke the trend line, the TSI indicator also breaks below the zero line, which shows that the sellers are ready to print a brand new lower low in this pair.

That’s about TSI and trading strategies related to this indicator. Make sure to try this indicator and these strategies and let us know hoe did your trades go in the comments below. Cheers.

[wp_quiz id=”67291″]
Categories
Forex Basic Strategies

Trading The New York Breakout Forex Strategy

Introduction

Forex is a 24 hours market, and it is open five days a week. So there are a hell lot of opportunities this market offers to the traders across the world. However, to make more profits and be successful in this market, we don’t have to trade 24 hours on all the days it is open. On any given day, the Forex market shuts down in some continents and opens in some other continents. This leads to the opening and closing of different Forex sessions.

The two most essential sessions are the New York session and the London session. Most of the traders across the globe prefer trading the New York session because, in this session, instruments often have less spread. Also, the markets are quite volatile during this session, and prominent players prefer making most of the significant trades in this session only. In this article, let’s understand different trading techniques to catch the more notable moves that occur during the opening of the New York Session.

We will also be trading the Forex market when the New York session overlaps with the London session. At this point, the volatility will increase furthermore as it is an overlap of the two biggest Forex sessions. The idea is to trade in the direction of the larger players. For each country, the New York session opens at different times. For instance, if you are trading the Forex market from England, the US Session opens for you at around 13:00 GMT. Likewise, if you are trading the market from India, the US session begins at 18:30 IST.

If you are not sure of the exact time of the opening and closing of different trading sessions, you can follow the below link to accurately identify the opening and closing of the New York session according to your local time.

|Forex Time Zone Converter|

Breakout Trading Strategy

During the New York session, all the major, minor, & exotic currency pairs move very fast. Some traders believe that we must trade the currency pairs according to the corresponding session. For example, in the Asian session, we must trade only AUD, NZD, and JPY. In the London and Frankfurt session, we must only trade GBP, EUR, & CHF. Finally, in the New York session, go for USD and CAD currency pairs.

There might be a valid reason behind this, but this shouldn’t be taken seriously. Currency pairs do not move according to the session. Instead, they move according to market circumstances. So in the New York session, we can choose any pair, but we must follow the below rules in order to trade this session profitably.

  1. Before the opening of the New York session, find a currency pair that is in a strong uptrend.
  2. Price action must be held at the major resistance area.
  3. Wait for the breakout to happen in the New York Session.
  4. Let the price action hold above the breakout.
  5. Go long.
  6. Stop-loss below the breakout line.
  7. Take-profit must be at the next major resistance area.

The same is vice-versa for a currency pair if the market is in a strong downtrend.

Buy Example

In the below image, we can clearly see that the EUR/AUD Forex pair is in a strong uptrend.

We can see the price breaking out at the opening of the US session. This indicates that the big players are ready to take over the market. The price action then holds above the breakout line, and this suggests that the breakout is real. Hence we can anticipate buy trades in this Forex pair.

Entry, Stop-loss & Take-profit

We have gone long in this pair as soon as the prices started to hold above the breakout line. The stop-loss is placed just below the support line. We can go for smaller stops when the price action respects the breakout line as it essentially indicates the opposite party giving up. Overall, it was swing trade, and we book the whole profit at the higher timeframe’s resistance area. This entire trade resulted in 150+ pip profit.

Most of the traders believe if they activate the trade in the New York session, they must close the trade in the New York session only no matter what. That’s just another myth. It is always advisable to milk the markets when there’s an opportunity to do so.

Breakout Trading Using Bollinger Bands

In this strategy, we are going to use the Bollinger Bands to trade the New York session. Bollinger Bands, as most of us know, is a quite popular indicator created by John Bollinger. This indicator consists of three lines, which are named as middle, upper, and lower band. These bands expand and contract according to market volatility. Most importantly, this indicator works very well in all types of market conditions.

The below image represents the NZD/CAD Forex pair, which was in an overall uptrend. The price action breaks the major resistance level at the opening of the New York session on the 11th of February 2020. After the breakout, prices started to hold above the breakout line, which tells that the breakout is real, and any long trade anticipated from here will lead to a fruitful result.

Entry, Stop-loss & Take-profit

In the below image, you can see that we have taken a buy entry in the 2nd half of the New York session. Sometimes, the price action breaks the major S&R level in the morning, and it goes sideways for a while before blasting out in the evening. As professional technical traders, we must trust our analysis and be patient enough even when the market is not going in the anticipated direction. We must always let the price action to tell us what is going to happen next and act accordingly.

So right after the breakout, the momentum of sellers is very weak (can be seen in the above chart). So the stop-loss can be placed just below the breakout line. The take-profit was at the higher timeframe resistance area. At first, prices failed to break the resistance line, and during the second try, prices again failed to go higher. The failed second attempt is a clear indicator to close our winning position. Overall it was a good trade, which gave us nearly 90+ pips in just a couple of hours.

Conclusion

Both of the strategies mentioned above are simple and straightforward. Did you observe that in both of our examples, we didn’t choose USD pairs? Instead, we went for minor pairs, and both of the pairs performed really well in the New York session. This proves that it is not about the currency pair of that particular session. It is about what is happening in that pair. It is critical to follow all the rules first and then make a trading decision. It is always advisable to try these strategies on a Demo account and then use it in the live markets. Happy Trading.

Categories
Forex Basic Strategies Forex Trading Strategies

Trading False Breakouts Like a Professional Forex Trader

Introduction

Often there are times in the market when the price breaks a certain significant level, and most of the novice traders immediately jump into the market. But, suddenly, the price reverts quickly, stopping out these traders or putting them in a losing position. Most of the experienced traders would have exited their positions when they realized they are trapped by the big whales like industry or institutional traders.

But beginner traders often become the victims of these false breakouts, and it affects their psychology as well. They will start doubting their trading strategies, and the fear element will surpass their confidence. Instead of falling into the negative state of mind, traders should learn how to use these false breakouts to their advantage so that they can profit from it. In this article, let’s discuss how to trade the false breakouts properly.

Most of the traders often consider false breakouts as a negative thing in the market. The general perception is that, by trading the false breakouts, they are taking the unnecessary risk, or it is not the correct way to trade. Some traders also believe that simple breakouts are more comfortable to trade. It is true, but simple breakouts won’t provide a great risk-reward, and also, it is not a consistent way to trade the market. On the other hand, successful & experienced traders see the false breakout logically and consider it as an opportunity to make some quick profits.

There are a lot of ways to trade false breakouts. Some traders trade them in conjunction with indicators, and some use it with trend lines and support resistance. In this strategy, we will show you the most appropriate way of trading false breakouts.

Trading the false breakout by using the major S&R levels

False breakouts occur in all types of markets, such as Forex, Stocks, Futures, and Options. They also occur in all kinds of market conditions. But the critical thing to remember is that every false break out is not worthy enough to trade. Always consider trading the false breakouts by following the trend of the market. That is, if the trend is up, look for the buy-side false breakout and in a downtrend, look for sell-side false breakouts.

Step 1 – Find the trend of the higher timeframe

This step is simple yet crucial because we need to confirm the trend of the market. Keep in mind that most of the lower timeframes always follow the direction of the higher timeframe. To explain this strategy, we are examining the uptrend of the GBP/USD forex pair.

Step 2 – Look for the significant S&R in the lower timeframe

Most of the false breakouts occur near the support and resistance level. The reason brokers and market movers use these levels is to manipulate the market as is these areas act as a significant supply-demand zone. This makes it easier for the bigger players to fill more orders.

Step 3 – Look for the false breakouts at the S&R level

As we know by now, most of the false breakouts happen at major support resistance area. A trader can set the alarm on the price chart to see when the price action is at a major level. When the price breaks these levels, wait for the false breakout to trade the market.

In the below image, GBP/USD was in an uptrend. On 15 Min chart during the pullback phase, prices started holding at the support area. On 29th Nov, look at the first circle where the price action prints the false breakout. But there is no way to trade that breakout. Because after that, the price action dipped below the support area, which is a sign of a false breakout. So it is an indication to go long on the GBP/USD forex pair.

Step 4 – Entry, Stop loss and Take profit

A trader should be entering the market when the price action holds at the significant support resistance area as it confirms that the levels are active to hold the prices. \

Take profit placement depends on your trading style. If you are an intraday trader, we suggest you close your position at a recent high. If you are a swing trader, look for another false breakout to load more positions. You can also use the recent high or any support resistance area of the higher timeframe to close all of your positions.

Most of the false breakouts are sure shot trades in the market. Place the stop loss just below the recent low, or at the closing of the most recent candle. If you are a conservative trader, then put stop loss bit spacious to your entry point.

In the below image, we have placed the stop loss just below the closing of the recent candle, and we have captured the 4R trade in the market.

Bottom line

It is essential to learn the logic and psychology behind any false breakout. Most of the time, the risk is small in these types of trades, and it is important not to be greedy while placing more extended targets. If there is no momentum in the market, close your positions, and if the trend is healthy to go for longer moves. You can still trade the regular breakouts, but throw relatively less money when compared to the false breakout trades. Also, make sure to practice trading false breakouts in a demo account until you master it. We hope you liked this article. Cheers!

Categories
Forex Basic Strategies

No Breakout Confirmation or No Consolidation Means No Entry

Price Action traders crave for the breakout. Breakout is one of the most important components of price action trading. However, there is another equally important thing, which is breakout confirmation. Since the Forex market is very action-packed, it is often found that the price does not come up to the breakout level to confirm the breakout. It consolidates and produces a reversal candle to offer entry. The question is, does it always consolidate and offer an entry.

Let us find out.

The price headed towards the South and seems to have found its support. It has been heading towards the North now. The price is at the last swing high. Thus, the buyers are to wait for an upside breakout and breakout confirmation to take a long entry.

The price makes a breakout, but at the time of confirmation, it comes back in. Thus, the breakout is void. It goes towards the upside again. This time it gets rejected from the last swing high. Thus, the price does not make any breakout here.

This time it does. A huge bullish engulfing candle breaches the last swing high. That is a Double Top resistance as well. The buyers are to wait for the price to come back at the breakout level and get a bullish reversal candle right there. Alternatively, it may consolidate somewhere in between the highest high and the breakout level.

It keeps going up. Let us not give up but keep eyeing on the pair. It has gone too far up. It may not come back at the breakout level. It may rather consolidate. Let us find out what it does.

It keeps going towards the North. There is no sign of consolidation yet. A swing high on the chart is evident, which is nearby. As things stand, risk-reward is getting less lucrative.

As expected, the price has found its resistance before the level of the last swing high. The price action gets choppy. Traders are to wait for the price to give them the next direction. In a word, price action traders do not keep this kind of chart on their watch list.

The Bottom Line

A chart looked extremely good and was about to give us an entry ended up being a choppy chart. What more frustrating is it went towards the desired direction, but it did not offer us entry. Some traders may think it would be good if an entry is taken. At least some pips can be achieved. Please note, do not even think about it. After breakout, the price must confirm the breakout or consolidate. To sum up the whole equation, no confirmation or no consolidation means no entry.

Categories
Forex Basics Forex Daily Topic

The Simpler the Better

Financial traders follow many charts, patterns, and trading strategies. Each one has its own advantages and disadvantages. Nevertheless, there is a saying, ‘the simpler, the better.’ In the financial markets, especially in the Forex market, a trader cannot deny this truth.

Let us demonstrate an example of this.

The price heads down with strong bearish momentum. The sellers are to wait for an upside correction and a breakout at the support to make it more bearish. Let us proceed with what happens next.

The price has an upside correction, but it did not make a breakout at the support. It instead produces a huge bullish engulfing candle at Double Bottom support. Things are different now. Traders are to look for a long opportunity on the chart.

The price is bullish, but it gets caught within an ascending channel. A breakout at either side attracts traders to trade in this chart. The chart shows that the price makes an explicit breakout towards the upside. Ideally, the buyers shall flip over to their trigger chart to find a long entry. Let us find out whether they find any on the next candle.

The price does not make a breakout at the highest high of the breakout candle. Thus, the traders do not find an entry on the triggered chart. However, see the second candle (bullish candle). It makes a breakout (horizontally) at the highest high of those two candles. The buyers are to flip over the trigger chart again to find an entry. Do they see an entry this time? Let us find out.


Yes, they do. The price heads towards the North with good bullish momentum, and it does not come down to the support of the breakout candle. By flipping over to the trigger chart for an upside breakout to trigger an entry, a trader makes some green pips.

In this chart, the price makes a breakout at ascending channel’s resistance just a candle earlier. That breakout does not create bullish momentum. However, when it makes a breakout at the horizontal resistance, it creates the momentum that the buyers look for. I am not saying a breakout at ascending channel’s support/resistance does not offer entry at all. It does. A breakout at horizontal support/resistance offers more entries than the channel’s support/resistance breakout. It is because; it is simple and easy to be noticed by most of the traders.

The Bottom Line

Does that mean we stop looking entries on a channel or other pattern breakout? No, we shall eye on those breakouts; flip over to the trigger chart and trigger an entry if the trigger candle makes a new higher high or lower low. It is just the probability that a breakout at horizontal support/resistance offers more than any other chart pattern. After all, it is simple, and we know “the simpler, the better’.

Categories
Forex Videos

The Most Powerful Forex Technique – Trading Breakouts

Trading Breakouts


In the area of financial trading and in particular within the Forex market, the movement of a currency pair, or price action, does one of three things: it moves up, it moves down, or it moves sideways. Within these types of moves, especially when the price action is moving up and down, we will find trends forming. We also find pullbacks, or price reversals, continuations, slowdowns in volatility, and pauses and hesitations, which are also known as periods of consolidation. Typically at these times you might see very small movements, where price moves sideways in a narrow range. In other words, currency exchange rates in the Forex market do not travel in a continuous straight line. And this is what makes trading so difficult to predict.
Each time you pull the trigger and execute a trade, and especially as a retail trader, you are up against institutional traders, including sovereign wealth funds, hedge funds, governments and their central banks and high net worth individuals, all of whom might well have a different price move expectation than yourself and be trading in the opposite direction, i.e, against you!

This is why it is so important to learn the peculiarities, twists, and turns, the dynamics and unpredictability of the Forex market. And the best way to do this is to study your charts and to study the markets and to practice on a demo account. In other words, learn the ropes, find the best time of day to trade that suits your trading style and methodology, try to determine when the aforementioned big guns are all likely to be singing from the same hymn sheet, in other words when the majority are trading in the same direction.

One of the most popular and rewarding styles of trading the Forex market is identifying breakouts. This type of trading relates to technical analysis only. That Is not to say that we can take our eyes off of the fundamentals, because these events can be triggered by economic data releases. However, after periods of consolidation, where price action becomes narrow and congested, and show a lack of direction, traders look for potential breakouts to test new levels, and these events regularly occur purely on technical analysis, alone.
Because breakouts are so popular, price action can be extremely volatile at these times. It’s almost as if everybody pounces to trade at the same time and either buys or sells a particular currency pair because their charts tell them so. This tends to cause strong moves, as price breaks out of bottlenecks and where quite often those entities who are trading counter to the breakout may be stopped out of their trades. This is often because breakouts regularly happen at, or close to, round numbers. At these levels, traders tend to place their stop losses or limit orders to buy or sell. This can often result in a spoof breakout, where price action breaks out of a period of consolidation only to reverse quickly and start a trend in the opposite direction. And therefore, some breakouts can be short-lived, and which are also known as false breakouts.

Example A

Let’s turn our attention to example ‘A.’ This is a 1-hour chart of the EURUSD pair. Always read your charts from left to right, because it tells you a story of where price action has been, and where it is possibly going to go in the future.


In this example, we can see that we have drawn a horizontal line at position ‘A.’ This has become an area of support; it is effectively a floor. Although we have a high, as marked at the position marked 1, and where price action moves back to our floor, the second move higher at position 2 becomes a lower high than at position 1. This tells us that the market is running out of momentum to the upside, and where indeed price action returns to the floor after this push higher falters. And then, price action forms a new lower high at position 3. This now tells us that bull traders have effectively thrown the towel in, and then, when price again returns to the floor, we see a breakout, as marked by the X, which punches through the floor, or support level. Therefore, this would have been the breakout candlestick that traders were looking for In order to go short on this pair.

Price action continues to move to the downside. However, we now see a new floor at position C, and a new ceiling at position B. And where price action consolidates in a sideways trading fashion.
In the example ‘B,’ we have moved the charts along to the next session. Price action continued to trend sideways between the ceiling marked ‘B’ and the floor marked ‘C’ until it becomes a second breakout occurs and where price action punches through to a new floor marked ‘D’ and where the previous floor, ‘C’ has now become a ceiling.

Again, price action returns to a consolidation or sideways momentum, until, eventually, at candlestick marked X – a series of strong bearish candlesticks form another breakout to the downside. Had we entered a short trade at the first breakout to the downside in example A, we could have realised a profit of over 180 pips.
An important lesson to learn from this section is that breakouts often occur when price action punches through floors and ceilings, and which are also known as levels of support, being the floor, and resistance being the ceiling.
So keep an eye out for possible breakouts and especially at key technical levels when support and resistance levels begin to fail. They will be far stronger in momentum after extended periods of consolidation.