Introduction
Currently, there is a strategy that is followed by most investment banks around the world, and that is known as Stop Hunting. It attempts to force some market participants out of their positions by driving an asset’s price to a level where many retail traders set their stop-loss orders. The triggering of many stop losses at once generally leads to high volatility, and this can present opportunities to some smart traders who seek to trade in such an environment.
The fact that the price of a currency pair can experience sharp moves when many stop losses are triggered is exactly why many traders engage in stop hunting. Traders who are aware of this fact and have observed this phenomenon of the market try to make of this opportunity by being patient and conservative. The strategy we will be discussing today takes advantage of this sudden rise in volatility due to what is known as ‘stop-hunting.’
Timeframe
The beauty of this strategy is that it can be employed on all timeframes. However, it is not recommended in extremely small timeframes as there is a lot of noise in those timeframes, which may lead to confusion and misunderstanding. Hence, if one wants to profit greatly from this strategy, he/she should trade in 15 minutes or a higher time frame.
Indicators
We will be using just one technical indicator, and that is ‘Simple Moving Average (SMA)’ with 5 or 10 as it’s period. No other indicators are used in this strategy.
Currency Pairs
The strategy is suitable for trading in all currency pairs, including major, minor, and some exotic pairs. However, illiquid currency pairs should be avoided as the price action patterns are not reliable in these pairs.
Strategy Concept
In this strategy, we will be using the concept of previous highs and lows instead of support and resistance to act as our reference points. This is easy to understand and easier to spot in a chart. We will then anticipate these highs and lows as our support and resistance areas, which could break out of. Lows on a price chart are points where the price found support and started to go up.
In other words, this is a price point where there were ready sellers. When price revisits that area, sell orders get triggered, and the price starts to fall. However, during a breakout scenario, the momentum of the price is so much that it breaks the previous high and continues moving south. The Opposite is true for the breakdown of previous lows.
At times it is seen that even when the previous high or low is broken, the price doesn’t always continue in the direction of the breakout or breakdown. The price immediately retreats and bounces off the high or low. We will call these scenarios as fake-out or ‘stop-loss hunt.’ When price retraces back immediately, there is a high chance that it will continue in the same direction, at least until the latest hurdle. Let us explore the steps of the strategy.
Trade Setup
To explain this strategy, we will consider the EUR/USD currency pair and find a trade that fulfills all the criteria of the strategy. In this example, we will be analyzing the 1-hour time frame chart and look for appropriate price action patterns in the pair.
Step 1
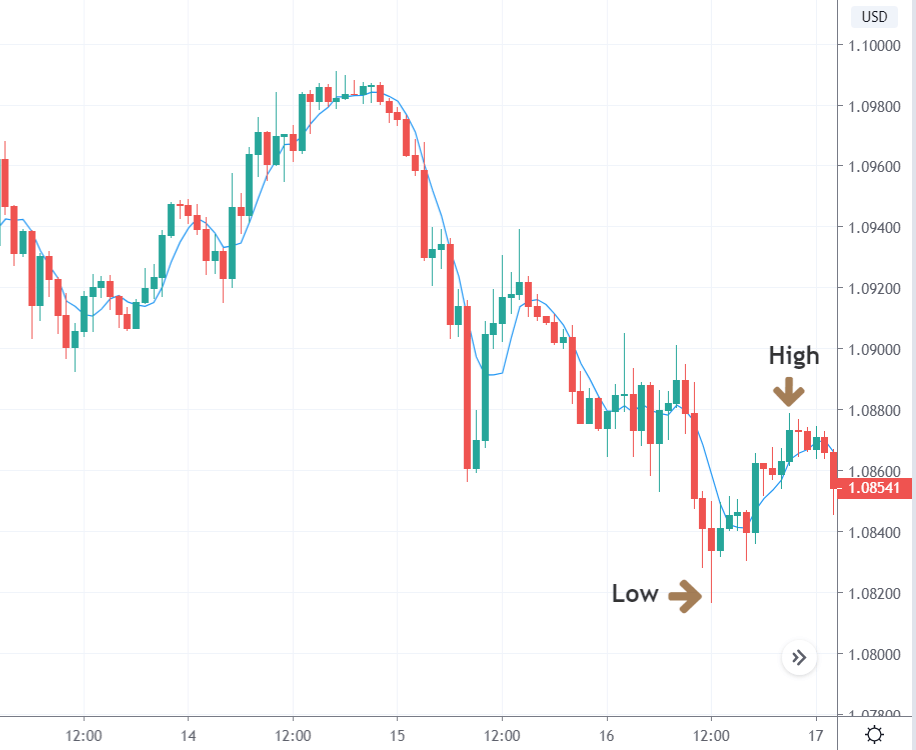
The first step of the strategy is to look for highs and lows from where the market has traveled a fair amount of distance. Spotting for such areas in the direction of the major trend is preferred as the risk is lower in such trade setups. For instance, look for buying opportunities at lows of an uptrend and selling opportunities at the highs of a downtrend. This step is very important from a risk aversion point of view. Thus, one should give a lot of importance to this step of the strategy.
Step 2
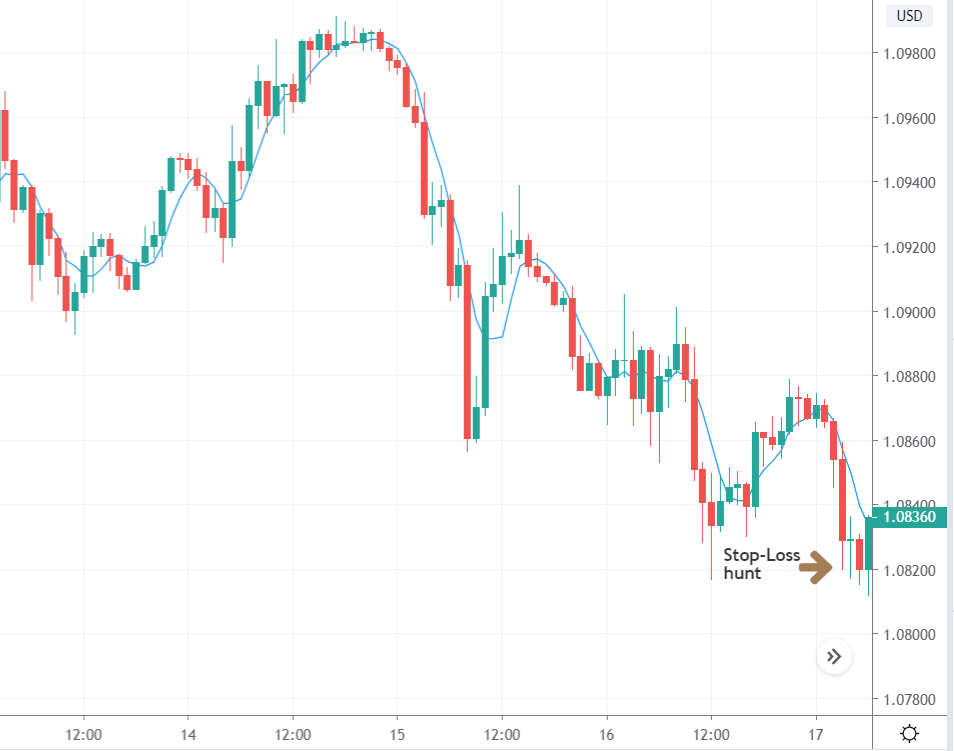
The next step is to look for a fake-out price action pattern at the low, marked in the previous step. This is the first confirmation that buyers or sellers have come back into the market, and the banks have cleared out all the strategies that were placed below the low and above the high.
The below image shows how the price goes slightly below the previous low clearing all the stops of retail traders, and the last candle closes with a great amount of bullishness.
Step 3
In this step, we see where we take an entry in the market. We take an entry right after the price starts moving higher or lower and closes above or below the simple moving average (SMA), respectively. Conservative traders can wait for the price to retrace to the SMA and then take an entry while aggressive traders can enter right at the close of the candle.
The arrow mark in the below image shows that the entry is made at the close of the second bullish candle after the fake-out.
Step 4
We have one take-profit and one stop-loss point for this strategy where we take profit at the high or low as we had marked in the first step of the strategy while stop loss is placed below or above the low and high, respectively. If one is trading in the direction of the major trend, he/she can take profits at new highs or lows. However, one needs to be conservative while taking counter-trend trades.
Strategy Roundup
Stop-loss hunts are becoming as common as breakouts. By including this strategy in our trading arsenal, we will have something that we could use when we notice such patterns in the market where other traders are looking for breakouts. In this strategy, we have put a significant amount of stress on price action, which makes this strategy very reliable and consistent. One can use trailing stop-loss to protect their profit even when the target isn’t reached. All the best!


