Categories
Forex Technical Analysis

Prop Trader’s Use of Moving Averages

Moving Averages are very versatile in ways how you can interpret them for signals. Whatsmore, adding more than one creates a plethora of ideas as many patterns and shapes emerge in conjunction with the chart. Therefore, traders can make complete systems out of these indicators and all of them are unique in their way.

Some MAs are used more often, such as 100-period MA, 20-period Exponential MA, or 9-period EMA, still, signal interpretations are subjective and MAs are used with other indicators and analysis. This article will address how one professional prop trader uses MAs as an element in their trading system and it should give you an idea of what other uses MAs have aside from traditional trading signal generation. We will present opinions that should not be considered as a fact or trading advice, just as an example of how it is used for technical trend-following systems. 

A trader who wants to have a robust and universal system looks to implement measurements of different factor types on the market, covering areas of importance on their trades. According to one such system structure example used by professionals, MA is one element of 6 others. Other elements or tools focus on volume indicators, two trend confirmation indicators, a trade exit indicator, flat markets filter, and volatility measurement for risk management purposes (ATR indicator). Moving Average can double as an Exit indicator when the price cross-closes it but for our example, it is used as a higher probability direction filter. We will go more into this function later, let’s first address the use of the MA as a Trailing Stop.

Trailing Stops

Trailing Stop can be regarded as a trade Exit function with adaptive movement to the price, it will follow the price in real-time and automatically move the level at which a position will be closed if that price level is hit. Most trading platforms or clients like the MT4 have this implemented. Although, Trailing Stops can be calculated based on the moving averages rather than just using the points distance trailing which is a basic Trailing Stop calculation. Now, as there are many types of MAs it means Trailing Stops can also be customized in various ways.

Such tools exist for MT4 and MT5, most of them are a form of Expert Advisor script that expands the way you can use real-time trailing stops for your exits, and more often than not it is more effective than the standard, distance-based trailing stop. Of course, you do not have to use such tools if you do not need real-time custom trailing stops, instead you can just add MA of your choice to your chart and move the Stop Loss order level to it. This is very easy to do if you are on the daily timeframe but gets very demanding if your target timeframe is below M30, especially once you have multiple positions to trail. 

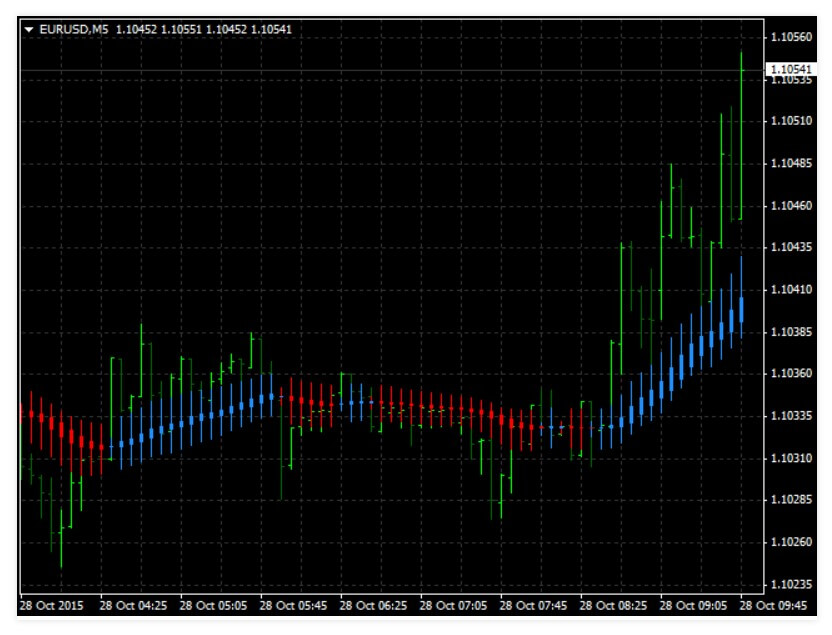
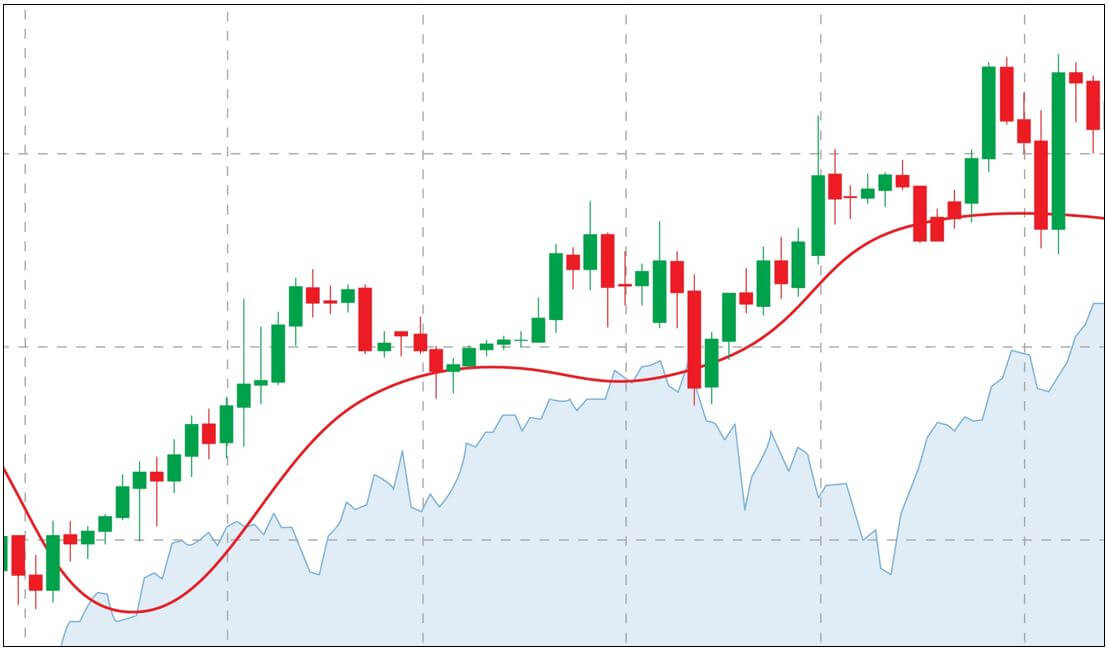
The way we can trail on the daily chart is simple. Once our Take Profit target is hit, we move the Stop Loss to the moving average of choice. Or, we can just wait for the price to cross the MA and close the order manually. There are differences here, the first way is more aggressive because if the currency pair becomes more volatile it is likely your stop loss level will be triggered even though the close price has not crossed the MA. So the second method will not “accidentally” close the position prematurely because of the volatility increase, still, it leaves room for flash crashes or other sudden moves to negate gains we might have got from the trend.

In this case, MA has a trade exit function, while trailing the MA with the stop loss order will ensure our profits from the trend. You should pay attention to the MA period settings and set to single-digit numbers as this is what prop traders recommend for the daily chart systems. Trailing stop or exit function MA should not follow the price to the point it is almost the same, the moving average should average the price value and absorb price volatility to some degree but not lag too much. 

MA Lagging

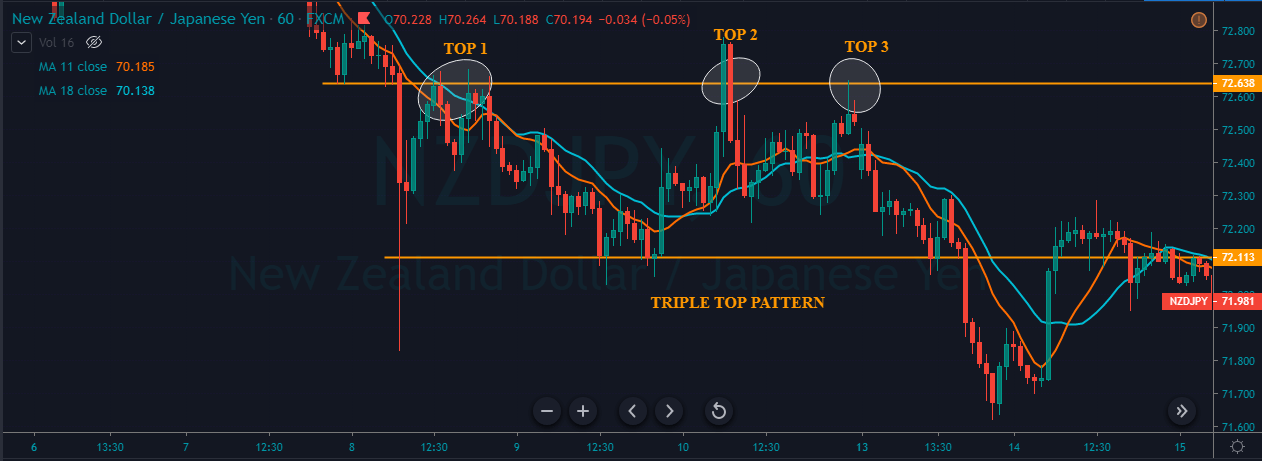
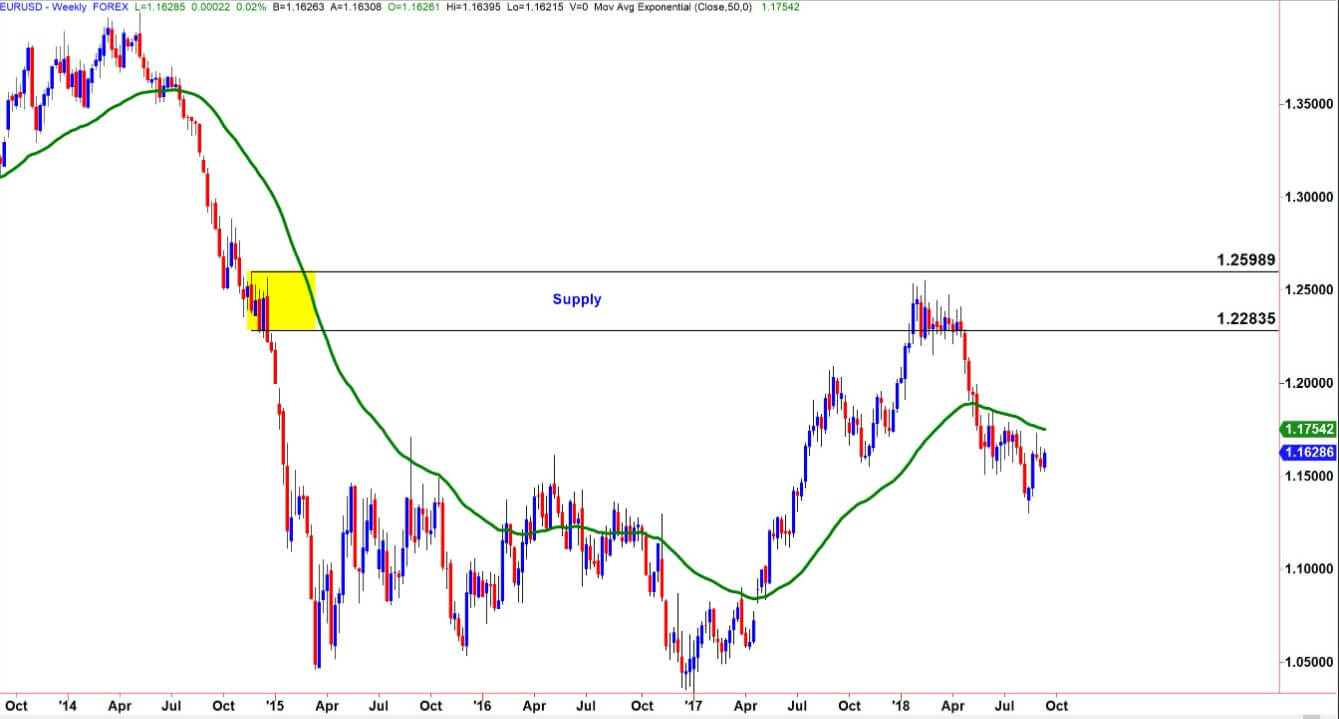
Talking about the MA lag, it leads us to mention why some technical prop traders are not fans of MA crossovers. You probably know that MA crossovers are very common signal generators unless you are just starting to trade. Moving Averages absorb volatility so we have a cleaner insight where the trend is emerging, ending, stalling, and so on. When we use MA crossover as trend confirmation indicators, the signal they generate is not optimal. It either lags or if we set low periods – fake signals are overwhelming. No matter what type of MA you use, they seem to always be late to the party. Using popular MAs mentioned above, you may have heard about the Golden Cross and the Death Cross.

200 EMA (red line) and the 50 EMA (blue line) on the EUR/USD chart

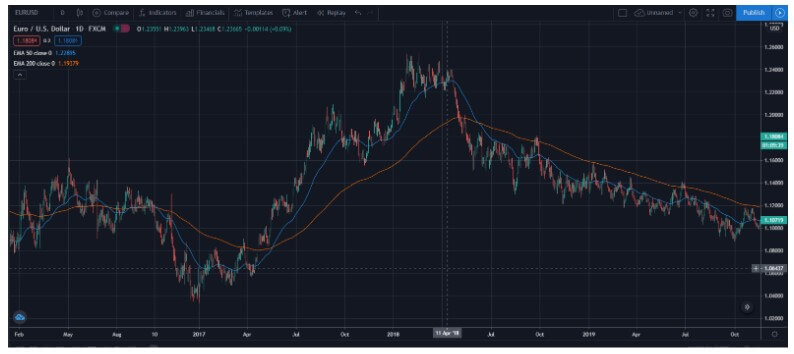
It is obvious from the picture above that these MAs do not cross often on the daily chart our system is using. Golden Cross is a signal when the 50 EMA crosses the 200 EMA and Death Cross is the opposite, short trade signal. These are used often in stocks trading, creating a kind of uniform traders’ behavior once the crossovers happen, putting more pressure on the price momentum. This phenomenon is waited for by investor traders and the strategy has some success because of this coordinated move to dump or hype a stock. Unfortunately, forex is not a good market for these strategies. You may notice trends once the crosses happen but it is not related to the trader sentiment. Whatsmore, the signals are so spread apart you may have to wait for years to happen. If we zoom out the EUR/USD chart you can notice this, meaning even investor-type forex traders will use other trading options for trend confirmations. 

Daily EUR/USD with EMAs zoomed out

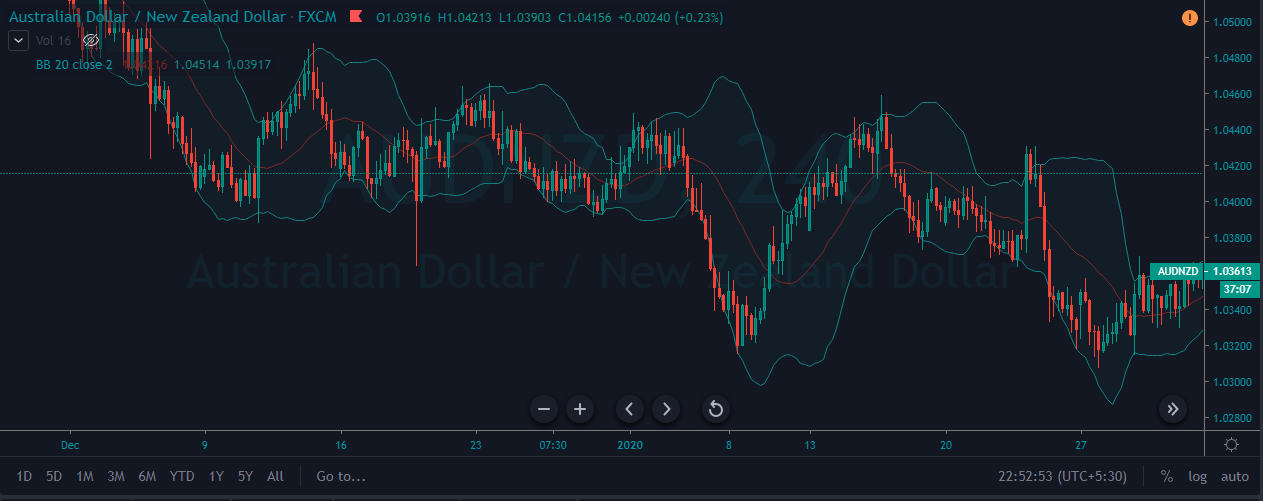
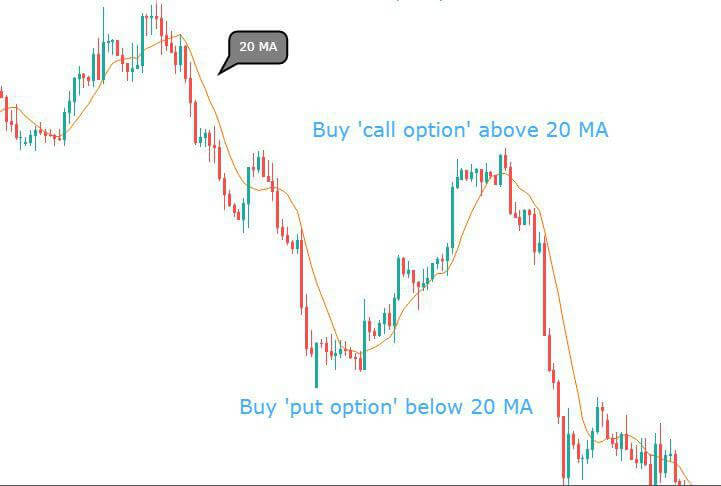
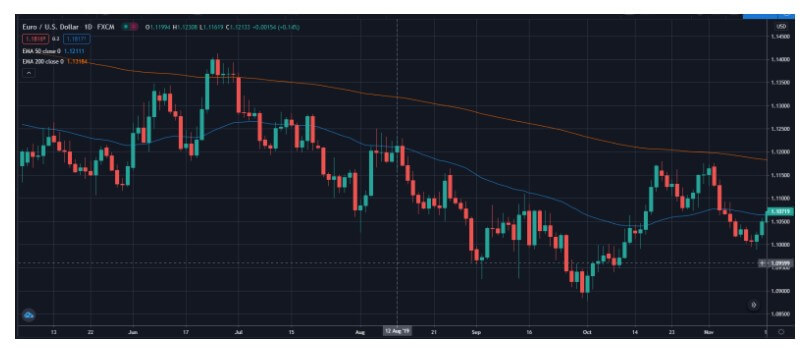
Now we need something that moves faster so we can have signals in a more reasonable time span. We can also use the popular 20 and 50 period EMAs. 

NZD currency basket with the 20/50 period EMAs

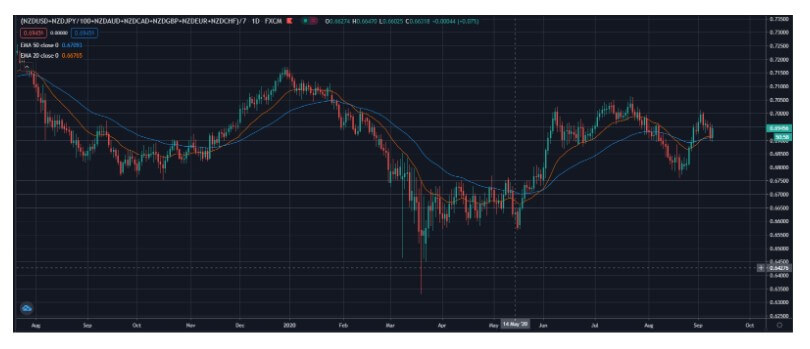
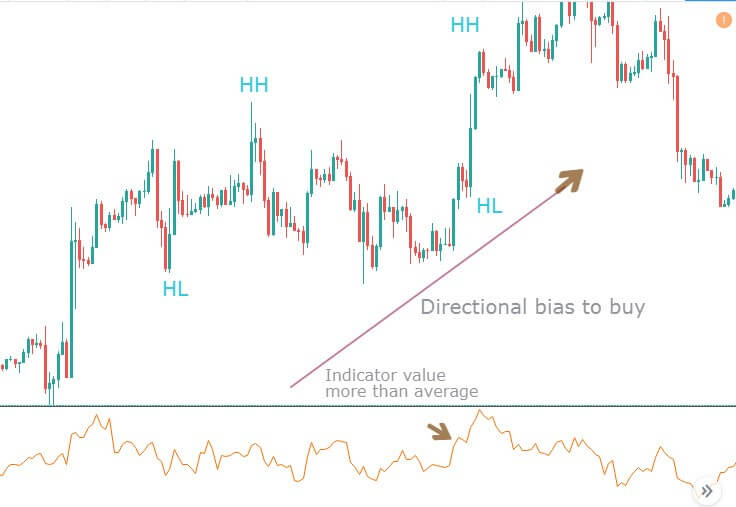
The trend confirmation signals on the MA cross are now more frequent and can be applied to a currency basket, for example, for currency strength analysis. This setup can be used on a currency pair too, however, for a professional, these signals are not good enough. Notice that the cross signals lag to the point they are too late for the bigger trends on the NZD basket picture, entering almost in the middle of the 4 visible confirmations. Smaller trends at the end of the chart are completely off, giving you signals when the trend is over.

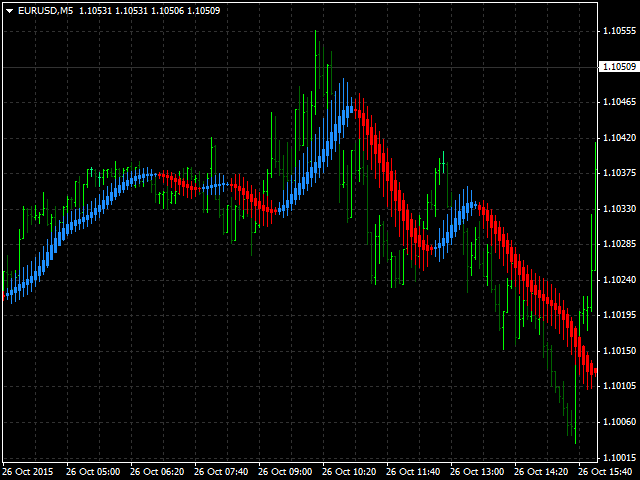
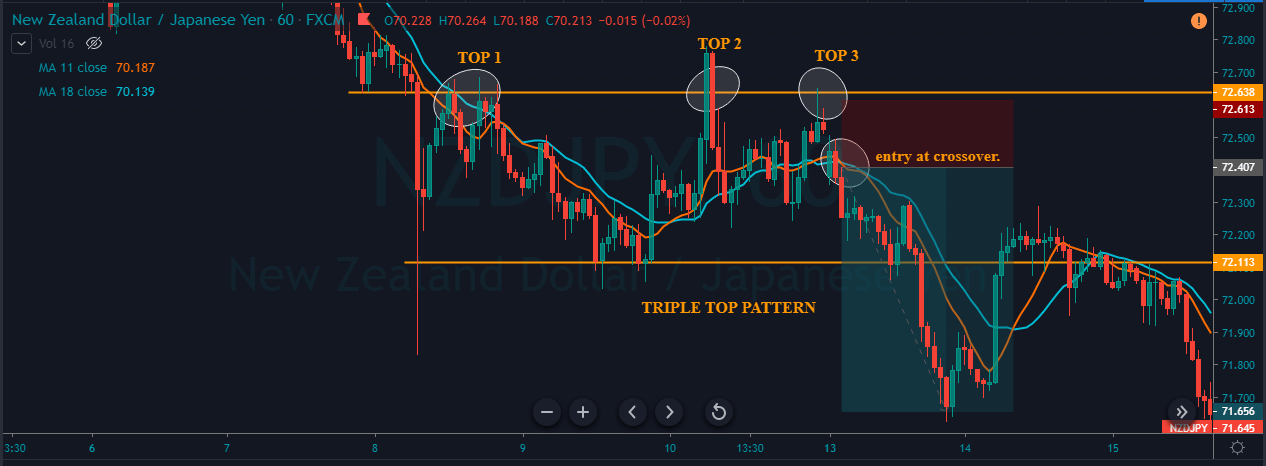
Moving averages have this flaw when facing a directionless market, but your system should have a volume or volatility indicator/filter that should save you from these losses by giving you a signal to stop trading. Sticking to the MAs subject, a better option is a very simple adjustment on how we interpret the signal to enter. Let’s just focus on the 50 EMA and delete the other. The trend confirmation signal is when the price cross-closes the 50 EMA. Now we have a very different and much better entry point, capturing most of the 4 trends in the picture.

NZD basket with only 50 EMA

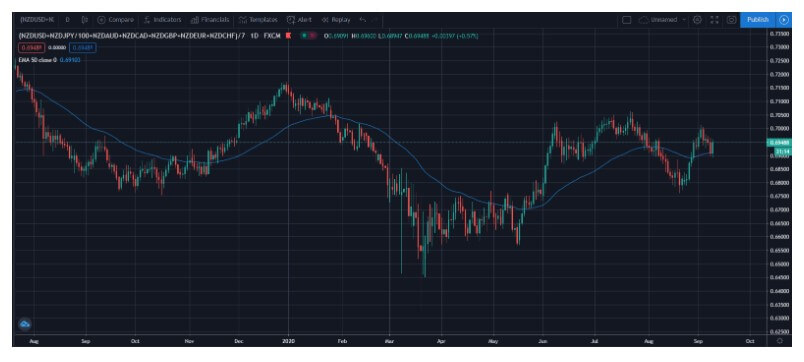
Notice that during the periods of trend exhaustion the signals are not always perfect. If we consider you have an indicator that filters flat periods, each trend entry is at an optimal point, providing you with profits even during smaller trends at the chart end. 

When you find an MA that does a great job crossing the price when the trends emerge, that one is absolute gold. Finding one needs a lot of searching and testing, and the MA element plays an important role in the prop trader systems. They also call it the Baseline. 

The Baseline Concept

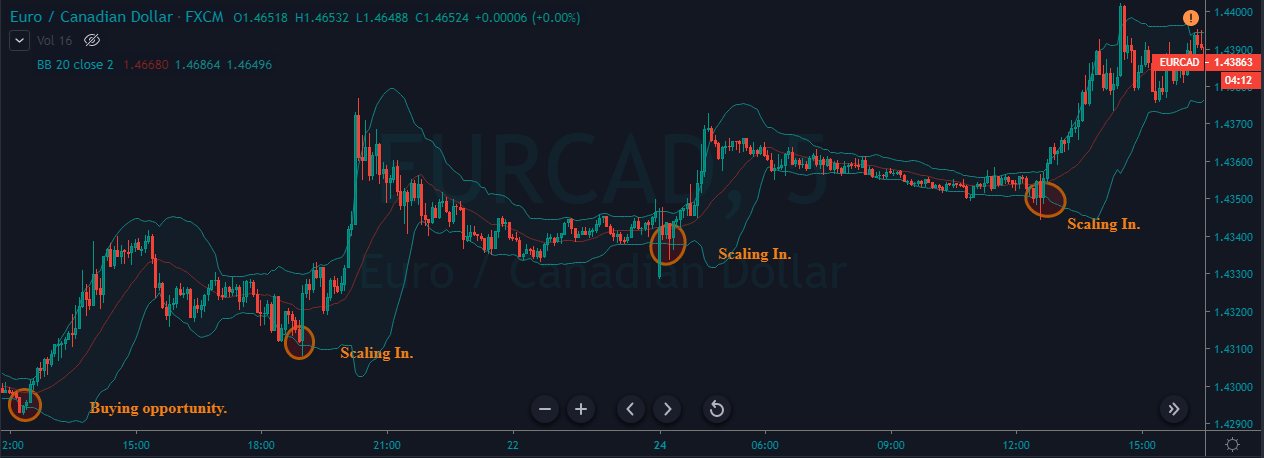
The Baseline concept takes your signals from the first and second confirmation indicators and filters any that are not in line with the MA signal. By doing this, small corrections on the major trends are filtered in case your confirmation indicators are wrong. Once the corrections are exhausted, the major trend continues where you again reenter. This major trend is considered exhausted once the price cross-closes the Baseline and a new one emerges or a period of calm, trendless action is about. Moving Averages are very bad in these flat conditions, so is your baseline, therefore volume or volatility tools need to step in. 

By going short only if the major trend is going down, and vice versa, you add up your odds of having a winning trade. Now, this is only one of the baseline functions. In your quest of finding a good MA as a baseline element in your system, you will find so many options and so many settings you can change you might not be sure it is the right one as something better is just around the corner. If you are not sure, take a zoomed-out approach. Your MA of choice should cross the price action at points where new trends emerge but allow smaller corrections of the major trend without fake cross signals.

It should be sensitive enough to give you optimal signals once a new trend starts, unlike 200 EMA for example, which is just too slow for our trading way on a daily chart. Some traders like MAs that are calculated in a way so they represent an average and signals you cannot see with eyes only by just looking at price action. A number of these MAs are developed by John Ehlers but you should aim for an MA that fits your system and take a holistic approach to it. 

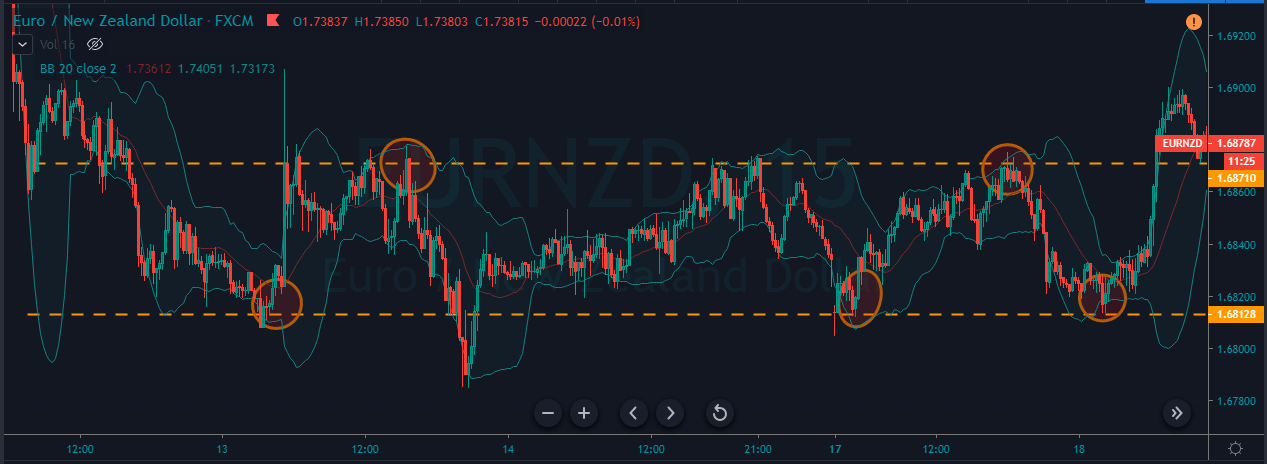
The Baseline serves as a major trend filter but prop traders understand other concepts to it. Price actions always tend to return to the average value, once it deviates. Unless there is a strong driver (news event) to push the price out of the normal deviation range, the correction towards the baseline is likely. Technical Prop traders measure this distance the price has moved away from the baseline. According to it, they create a rule – if the price has moved too far away from the baseline once it crossed it, they will not make a trade. This signal to enter (if other indicators confirm) will not be optimal, the odds are not very good now. Now, how to measure and find out if the price has moved too far? One of the easiest ways is by looking at the ATR indicator. Measuring the price level pip range from the baseline and comparing it to the ATR (14) gives you an estimate if it is too far.

ATR

ATR measures the volatility of the currency pair and it will give you a measure of how much the price can move away from your baseline daily. If the price is above the daily ATR value, it is a mark it deviated from the normal ranges. This point is also where technical traders put their first Take Profit and move Stop Loss to breakeven. Another important baseline role is also measuring the distance where to put your initial Stop Loss when you enter a trade. According to some testing done by prop traders, the 1.5xATR range is most optimal on a daily chart, but this setting should be adjusted to your system as it may be more or less sensitive.

Of course, only back and forward testing can give you an answer to where the best point is for your system and 1.5xATR can serve as a starting setting. To make your testing process faster, there are tools (for MT4 and MT5) that plot ATR lines above and below the price levels so you can easily see if a trade can be made, if it hit the TP or SL, etc. These tools are not available by default in the MT4 so you will need to find one.

As we can see, the baseline is an important element not just for major trend gauging but also a base for your risk management. A combination of these creates a complete solution to your trading, excluding your guesses that are more often than not bad in terms of probability calculations. As MAs are abundant on the internet, the search for them will likely be easier than for the volume tools, for example. The much harder part is the long testing phase with different settings and calculation types.

Know there are interesting solutions on some specialized forum/websites where one tool can hold several MA calculations, such as TEMA, ADX, Athens MA, SineWave MA, DEMA, Jurik MA, many smoothing options, filtering, and other settings that make an incredible array of how you define your baseline. In conclusion, know MA crossover signals are not a very good option as trade entry signals, MAs are not very good in ranging markets and that there are multiple uses for them, you just need to test a lot. 

Categories
Forex Technical Analysis

Using Moving Averages as Professional Traders Do – Here’s How…

Some traders use moving averages as resistance and support indicators or focus on whether a candle has closed above or below a specific moving average. The ability to use moving averages in the same manner as professional traders can make all the difference in the world with regards to your earnings. With that in mind, allow us to explain just how to do this.

Los Cruces

A cross is the most basic type of signal and many traders favor it because it eliminates the emotional element of trading. The most basic type of crossing occurs when the price of an asset moves on one side of a moving average and ends on the other. As we have commented, price crossings are used by traders to identify impulse changes and can be used as a basic output or input forex strategy. A crossing below a moving average can signal the beginning of a downward trend and will probably be used by traders as a signal to close any existing long position. On the contrary, a closure above a moving average from below may suggest the beginning of a new upward trend.

The second type of crossing occurs when a short-term average crosses through a long-term average. This signal is used by traders to detect when the momentum is changing in one direction and a strong movement is likely to approach. A buying signal is generated when the short-term average crosses above the long-term average, while a selling signal occurs when a short-term average crosses below a long-term average.

These methods are not the best way to use moving averages. In fact, they can be used much more cost-effectively if we use moving averages as impulse indicators, indicating the absence or strength of a trend, in company with other factors that recommend entry. This is how moving averages are often used by Forex market professionals.

Types of Moving Socks

There are several different types of moving socks and we should know each one before using them. Almost all graphics platforms offer all kinds of moving socks. Firstly, you should know that moving averages can be applied to the closing price, the opening price, or to high or low prices in a timeframe. They are usually applied to closing prices, and this is logical since closing prices are of great importance, and each opening price is also a closing price or a previous candle. Closing prices weigh heavily on the samples because it is often a level at which the price has settled.

At this point, let’s take a look at each type of moving average.

The simple moving average (SMA) is only an average of all the periods to which it refers.

The exponential moving mean (EMA) is calculated by giving more weight to the most recent value. In other words, we say that, for example, if the price has not moved, but starts to go up, an EMA will be demonstrating a higher level than an SMA for that same review time period.

The linear weighted moving average, sometimes referred to simply as a weighted moving average (LWMA or WMA), is like the EMA, being also calculated by giving more weight to the most recent value, but the weighting is proportional throughout the data series, while EMA only gives more weight to the most recent sample.

There are other types of moving stockings, but you don’t need to worry about them. These three types can provide you with everything you need.

Important Moving Stockings

There are some specific moving averages that are used by many traders. I will describe them here, but I do not suggest that much attention be paid where the price is related to any of them as if this were something very important in itself. The important moving averages are:

  • 20 EMA
  • 50 SMA
  • 100 SMA
  • 200 SMA
  • 200 EMA

Using Moving Stockings as Impulse Indicators

One of the best occasions to use moving socks like professionals is to use them as impulse indicators to determine if there is a trend and how strong it is. The best advantage that retail traders can take advantage of is to be able to trade in the direction of the trend if there is one.

One way to do this is to observe the slope angle of a moving average. For example, in a strong bullish trend, many traders will be looking at the angle of EMA 20. If the angle is consistent and strong, it is a sign that we have a trend in place. Note how, in the graph below, the EMA 20 is showing a rather strong angle, and also note that the price has remained largely below it in the graph. This is a sign of a downward trend.

Crosses of Moving Averages as Impulse Indicators

A more sophisticated way to do this is to check if a faster moving average is above a slower moving average and check this in several time frames. When you have bigger time frames that show a good trend, but a regression in smaller time frames, this could give you a chance to get in the direction of the trend, when moving averages cross again in the same direction as the time frame greater or smaller.

A combination of moving stockings that I like to wear is EMA 3 as a fast-moving average and SMA 10 as a slow-moving average. There is nothing especially magical about these numbers – beware of traders who swear that something like the LWMA 42 is a magic indicator -, but the difference between them tends to offer us an early warning of a change in the direction of the market. In fact, when we use this combination, I not only check several time frames, but I also need to see that the 10-period RSI indicator matches the address. This type of trading strategy using the moving average in various time frames can be very profitable.

In the example graph below, these two moving averages in all upper time frames are showing EMA 3 below SMA 10. In this 5-minute graph, while this quality existed within the larger time frames, EMA 3 retreated twice before crossing again below SMA 10 as indicated by the blue arrows. These two crossings could have provided profitable operations in the short term.

Deviation From Moving Averages

It is generally not sufficiently appreciated that almost all trend indicators are based on some sort of moving averages. For example, the Bollinger Band is simply the EMA 20 in the center with statistical deviation channels based on the historical price range.

Another way to use a mobile average is to take high probability quick pips following the following strategy. Let’s say that a very short-term moving average like EMA 20 is showing a strong angle and the price generally staying above it. If the price falls suddenly hard enough to get below the moving average, there is a high probability that the price will go back quickly to get back above it.

Another strategy is to look for a candle that is not touching the moving stockings at all, but that is indicating a movement back towards the moving stockings area. 

Frequently Asked Questions

How is the moving average calculated?

Basically, a moving average can be calculated by adding the last closing prices of “X” periods and then dividing that number by “X”.

What is EMA trading?

One type of essential tool for assessing trends in markets is the exponential moving average (EMA). In this article, we will present a specific type of stockings called Exponential Moving Media.

What is a mobile media filter?

Using statistics, a moving average is a calculation that is used to analyze a data set in point mode to create averages series. Thus the moving averages are a list of numbers in which each is the average of a subset of the original data.

Categories
Forex Service Review

Heiken Ashi on Moving Averages Indicator Review

This indicator, created by Sergey Efimenko in 2015, analyses the price using the Heiken Ashi candle generation principles. However, moving averages (instead of prices) are used as input data. In addition, the result is further softened by the average. Up to 26 types of moving averages can be used to obtain input data.

The trading system with the indicator Heikin Ashi (HA) allows you to trade in the direction of the trend and should not leave prematurely because HA filters out primarily noise and lower price fluctuations that are not useful. This system uses a chandelier whose direction of movement is the same as what occurs on the market, but there are differences:

1- In the table of price movements, each candlestick contains 4 different prices: the opening price (open), the lowest price (low), the highest price (high), and the closing price (close). Every candle that happens afterward has nothing to do with the previous candle.

2- In the chandelier Heikin Ashi (HA) each candle is calculated on the basis of the quantities of the previous candle, namely: HA opened = (previous open candle HA + previous closed candle) / 2 HA close = (current open candle price + current closed candle price + current highest candle price + current lowest candle price) / 4 HA high results the highest between the highest candle price now, open or closed HA low = the lowest between open or closed. The use of the HA candelabra is the same as the ordinary candelabra.

The Gap prices are also removed to make the reading clearer. Also, all price action rules also apply to HA candlesticks.

  • Time frame: 15 minutes or longer
  • Pairs of currency: Any
  • Single moving average 9

Heiken Ashi Trading Rules with Moving Stockings

Long entrance ticket: When the curve of ema 9 is crossed with ema 18 from the bottom, wait for the rally price above the ema curve. After some time the price movement will pass a correction (scroll down) to cut one or both corners of the indicator ema (A) The purchase signal occurs when the quote rises again at the end of the corrective period, marked with an HA bullish candle (in blue). It can be purchased at market price (market price), with a stop loss to a few pips at the bottom of the lowest entry-level of the candle.

Short entrance ticket: When the indicator curve ema 9 intersects ema 18 from above, wait until the price falls below the ema curve. After some time the movement of the prices will pass a correction (rise) to cut one or both curves of the indicator ema (B) The signal to be able to sell will occur when the price is again bearish at the end of the corrective period, marked with a bearish HA candle, of red color. The sale of the ticket can be made at the market price (market price), with a loss of stop on several pips above the highest entry-level of the sail.

This is one of the many indicators that exist and that Heiken Ashi uses. We cannot offer the consensus of the users because this indicator has no reviews. It is a simple indicator and can be used by beginner traders as a trend indicator. Besides, its price is only 10 USD, and it also offers a free demo version.

Categories
Forex Education

Getting Started with your First Historical Simulation

Introduction

In the previous section, we learned the steps to create a trading strategy. At this stage of the trading strategy development, we will focus on the strategy’s simulation process using historical data.

What is the Historical Simulation?

The simulation is defined as a mathematical representation that describes a system or process, making it possible to generate forecasts of such a system.

As the years have advanced, computational technologies have evolved to allow many processes simultaneously performed.  Compared to what a processor could do 40 years ago, a mere smartphone outruns any of them. In this context, the trading strategies simulation has also done so, moving from the simulation using printed paper charts to the current computer systems we observe today.

By running a historical simulation on a trading strategy, the developer should be able to estimate the gains and losses the strategy would have generated under historic market conditions within a given period.

However, while the benefit of executing a historical simulation enables one to estimate the profits and losses and whether the strategy is profitable or not, this statement should be analyzed by the developer throughout the trading strategy developing process.

Getting Started

Once the developer has completed a trading strategy, including entry and exit rules, as well as the definition of risk management and position sizing, it is necessary to formulate the rules of the strategy using a computer language. This way, the trading simulation software will execute the rules algorithm and apply it to the study’s financial dataset.

Several programming languages are able to carry out the trading strategy simulation, such as MQL4 of MetaTrader, Easy Language of Trade Station, or Python. However, for this educational article, we will continue to use the MetaTrader MQL4 language.

First Steps in the Simulator

MetaTrader 4 offers its Strategy Tester to simulate trading strategies. In the following figure, we observe the Strategy Tester terminal, in which we can develop a historical simulation of any trading strategy under study. 

The figure highlights that Strategy Tester has a user-friendly and intuitive interface for the developer, who can select the Expert Advisor that will contain the trading strategy to simulate. Similarly, the user can choose both the financial market, the timeframe, and the date span in which the simulation should run.

Running the First Simulation in Strategy Tester

In this example, we will continue using a moving-average-crossover-based trading strategy. To recap, this strategy is based on the following rules:

  • A buy position will be opened when the 5-hour weighted moving average (LWMA) crosses above the 55-hour simple moving average (SMA). 
  • A sell position will be activated when the 5-hour LWMA crosses below the 55-hour SMA.
  • The buy position will be closed when the LWMA 5-hour has crossed below the SMA 20-hour.
  • The sell position will be closed when the LWMA 5-hour has crossed over the SMA 20-hour.
  • The position sizing will be a constant 0.1-lot.
  • Only one trade at a time is allowed.

The criteria for the execution of the historical simulation are as follows:

  • Market to simulate: GBPUSD pair.
  • Timeframe: 1 hour.
  • Simulation range: from January/02/2014 to October/02/2020.

From the simulation’s execution, we observe the following result provided by the Strategy Tester at the end of the simulation.

From the above figure, we note that the balance line was reduced by $2,230.63 from the initial balance of $10,000, reaching a final balance of $7,769.37. This result leads us to conclude that the average-crossover strategy is not profitable. However, this is just a preliminary result.  It is still possible that we could make this strategy profitable through an optimization process, where we will assess what parameter values perform the best.  We could also add stop-loss and take-profit targets that statistically boost the system into profitable territory.

Conclusions

In this educational article, we have seen the first steps to perform a historical simulation. This process provides the developer with an overview of the strategy’s performance in a given financial market under certain conditions. We highlight that the performance conditions could repeat in the future. For this reason, once evaluated the strategy feasibility in terms of profitability, the developer should test the trading strategy during a specific period with paper money in real-time.

On the other hand, the profitable or non-profitable result is just a snapshot of the strategy’s performance. During the optimization process, the developer will investigate the parameters that provide higher profitability or lower risk for the investor.

The next educational article will review the simulator’s information in detail once the historical simulation has been executed.

Suggested Readings

  • Jaekle, U., Tomasini, E.; Trading Systems: A New Approach to System Development and Portfolio Optimisation; Harriman House Ltd.; 1st Edition (2009).
  • Pardo, R.; The Evaluation and Optimization of Trading Strategies; John Wiley & Sons; 2nd Edition (2008).
Categories
Forex Course Guides

Forex Course 3.0 – Complete Guide

Hello everyone,

Firstly, we want to thank you guys for following us throughout the course so well. We feel privileged that we are helping you guys in becoming better traders. Especially in Course 3.0, we have discussed some of the most crucial aspects of technical trading, which are essential for every aspiring technical trader to know. We have seen the quiz results for all the course articles that you guys have taken, and that gave us a gist of how well you’ll be following the topics discussed.

However, for the people who want to revisit a few topics, we would like to make their lives easier. So we are putting up a list of topics that we have discussed in this course. Also, this article will act as a quick revision guide for all the basics involved in Technical Analysis.

In this course, we have started by discussing the concept of Candlesticks and its fundamentals. Then we learned how to trade various candlestick patterns along with their importance. Introduction to Fibonacci trading has been done, and we also have paired the Fib levels with various indicators to generate accurate trading signals. We extended that discussion to Moving Averages and its types. Finally, we have learned the principles of indicator-based trading, where at least 10 of the most popular indicators have been discussed.

Below are the corresponding links for each of the topics that we have discussed in this course.

Candlestick Charts

Concept of CandlesticksIntroduction | Anatomy | Fundamentals

Trading Candlestick PatternsSingle Continuous | Single Reversal | Dual Continuous                                                   Dual Reversal | Triple Continuous | Triple Reversal

Deeper InsightCandlestick Patterns Cheat Sheet | Candlestick + S&R

Fibonacci Trading

Introduction | Entry Using Fib Levels | Challenges of using Fib levels | Fib + S&R Candlestick Patterns + Fib Levels | Fib + Trendlines | Fib for TP & Fib for SL | Summary

Moving Averages

Introduction | SMA | EMA | SMA vs. EMA | MAs to identify the trend | MA Crossover Strategy | MA + S&R | Summary 

Indicator-Based Trading

Introduction | Pros & Cons | Bollinger Bands | RSI | MACD | Donchain Channel | RVI | TSI | Stochastic | Ichimoku Cloud | Parabolic SAR | ADX | ATR 

With this, we have ended our Course 3.0, and soon we will be starting our Course 4.0, where we will be discussing some of the advanced topics in Technical Trading. So stay tuned and watch this space for more interesting and informative content. Cheers!

Categories
Forex Course

80. Indicator Based Trading – Bollinger Bands

Introduction

In the previous course lessons, we understood the importance, types, and various pros and cons involved in indicator-based trading. From this lesson, let’s start learning some of the most widely used indicators in the market. We will be starting with Bollinger Bands, which is arguably considered as one of the most widely used indicators in the Forex Market.

What are the Bollinger Bands?

They are a technical analysis indicator, which was developed by one of the famous technical trader John Bollinger in the 1980s. This indicator consists of three lines, which are simple moving average (the middle band), an upper and a lower band. In a volatile market, the bands of the indicator expand, and it contracts in tight market conditions.

Most of the traders think that the Bollinger bands indicator is similar to the moving average envelope, but it’s not true, because the calculations of both of the indicators are different. For plotting the upper and lower bands of the Bollinger Bands indicator, the standard deviation is considered. On the other hand, for moving average envelopes, the lines are calculated by taking a fixed percentage.

Bollinger Bands Indicator Plotted on a Forex Price chart

Using The Bollinger Bands Indicator To Take Trades

Most of the market experts and chartists believe that when the price action continuously touches the upper band, it means that the market is in an overbought condition, triggering a sell signal. Conversely, the closer the price action moves towards, the lower band, the more oversold the market is, triggering a buy signal.

This is the most common way to trade the markets using the Bollinger Bands. As much as this is true, we don’t suggest to use this approach to trade the markets where traders just blindly follow this one single rule. As we all know that the trend is our friend, we must first figure out the trend. Then it is advisable to trade only buy opportunities in an uptrend and sell opportunities in a downtrend. This is one of the most reliable ways to identify the trades on any trading timeframe.

The below image represents the buying opportunities on the EUR/CAD 5 min Forex chart. As we can see, the market was in a strong uptrend. We have identified four buying opportunities in just a couple of hours. The chart clearly represents how many times the price action touched the upper band and didn’t drop instantly. This is the reason why most of the professionals use this indicator to trade the market.

Trading Ranges Using The Bollinger Bands

One more crucial applications of the Bollinger Bands indicator is while trading ranges. This is because the bands of the indicator act like dynamic support and resistance levels to the price action. Higher the timeframe we use to trade the ranges, stronger are the bands will be. That is, price relatively respects these brands than the bands in the lower time frames. Many successful traders ace the market by using this strategy alone.

As we can see in the below chart, the market generated three buying and two selling opportunities when the market is ranging. Do not place the buy or sell orders blindly when prices reach the upper or lower level of the consolidation phase. Instead, wait for the prices to hold there for a couple of candles to activate your trades. In the below image, we have activated our trades only when we saw the confirmation candles. In this way, we can filter out whipsaws and false trading signals.

Conclusion

This lesson is an attempt to give you a basic idea of the working of this indicator. There are many more aspects to this, and you will be learning them once you start exploring Bollinger Bands on the price charts. You can refer to this and this articles to get advanced trading strategies using this indicator. Bollinger Bands can also be combined with technical tools like chart patterns and other reliable indicators to generate more accurate trading signals. One such example can be found here. Cheers!

[wp_quiz id=”66529″]
Categories
Forex Course

79. Is Indicator Based Trading For You or Not? (Pros & Cons)

Introduction

In the previous course article, we have briefly discussed the basics of indicator-based trading. We have also understood the different types of indicators. Before considering how to trade using these indicators, let’s see if indicator based trading is for you or not. For that, we will be listing down some of the significant pros and cons involved in indicator-based trading. After going through this article, we will know why we should be using indicators to trade the markets and what we should be cautious about while using these indicators.

Pros of using Technical Indicators

Simplification

As discussed in the previous course article, Indicators mainly present the existing price and volume data on the price charts. For novice traders who have less knowledge of reading this data, can take the help of indicators to understand the price charts in a more precise way. Also, indicators act as a great tool to identify market strength.

For instance, using the Moving Average indicator, the direction of the trend can be found. By using the stochastic indicator, overbought and oversold areas can be found. These cannot be easily identified by the novice traders if not for these indicators.

Swift Decision Making

Since you aren’t entirely aware of most of the indicators, we would like to give you an example of the indicators we have learned till now. If you remember trading Fibonacci levels, we have taken our entries right after the price bounces after touching the respective Fib levels. It is impossible to make such swift decisions in the absence of these indicators. Hence we can say that indicator based trading allows us to make quick decisions comparatively.

Confirmation Tool

Indicators act like an excellent confirmation tool for experienced traders as well. For example, a technical trader identifies a candlestick pattern and wants to take trades based on that pattern. To confirm if the signal provided by the pattern is accurate or not, he can take the help of any technical indicator like RSI or Stochastic. If the indicator supports the signal provided by the pattern, the trader can confidently make trades.

Combination Capability  

Indicators can be combined to understand the market more clearly. For instance, Moving Averages can be combined with Fibonacci levels, and Stochastic can be combined with many other reliable indicators to generate accurate signals. If we wish to, we can even add an end number of indicators, but these additions should able to simplify the price chart rather than making it more complex.

Cons of using Technical Indicators

Unawareness of the complete picture

Novice traders who get used to trading with these indicators can never get an entire background on what’s happening behind the charts. If they get used to this, they can never become a professional technical trader. Also, they won’t be able to identify if the signal generated by the indicator is accurate or not. Hence, it is always crucial to understand why the indicator is moving the way it is so that we can make better trading decisions.

Not for pure price action traders

Price action trading is also a part of technical trading. It is purely based on the price movements of the asset alone. So price action traders might find indicator based trading a bit redundant because they know why the price is moving the way it is moving. Hence we can say that indicators don’t add more value to pure price action traders.

Lag Issue

By now, we know that there are lagging indicators that portray what has already happened in the market. These indicators do add significant value to indicator based trading, but they can’t be completely used to take the trades.

Final Word

These are some of the pros and cons involved in using indicators for trading the markets. So the answer to the question ‘If the Indicator based trading is for you or not?’ is yes. It is for you. But we have to be cautious and understand the entire picture instead of blindly following the indicators. In the upcoming articles, we will start learning how to take trades using various reliable indicators in the market. Cheers!

Categories
Forex Course

74. Using Moving Averages To Identify The Trend

Introduction

In the previous lessons, we have understood the two types of Moving Averages and the difference between them. We have also seen which Moving Average should be used in different market conditions and the one that must be preferred most of the time. From this crouse lesson, let’s explore the real-time applications of Moving Averages and how we can find accurate trades using this indicator.

One of the simplest, yet important use of Moving Average is to determine the direction of the trend. This can be done by plotting the indicator on the chart and then deciding the position of candlesticks with respect to the line of Moving Average.

The ideal way of identifying a trend using MA is this – If the price action tends to stay above the moving average line, it usually signals an uptrend. Likewise, if the price action remains below the moving average line, it indicates a downtrend.

This approach of establishing the trend is too simplistic and also has a significant drawback. Let us understand that with the help of an example.

Below is the EUR/USD price chart, and we have added a 10-period MA line to it. According to the rules of MA, since the price is above the MA, we should be going ‘long’ in this currency pair.

Due to a news event, price drops suddenly and closes below the MA (in the below chart). So, this changes our plan, which means now we should be thinking of going ‘short’ in the currency pair. But before we do that, let us see what happens to the price in the next few candles.

The below image shows that the price fakes out and does not continue its downward trend. Hence, if we would have gone short, that would have resulted in the price hitting our stop-loss resulting in a loss. Let’s understand the problem with this setup.

The strategy mentioned above is right, but the problem is that we are using a single period MA line stand-alone and not combining it with any other indicator. The best way to use MA for determining a trend is by plotting an extra Moving Average line on the charts instead of just one. It will give us a clearer idea if the pair is trending up or down depending on the sequence of the MAs.

The best way is to check if the ‘faster’ moving average is above the ‘slower’ moving average for an uptrend, and vice versa for a downtrend. In the below chart, we can see that the ‘faster’ SMA is above the ‘slower’ SMA, and this shows the strength of the uptrend. Also, the fake-outs that happen because of news releases will also have less impact on the indication given by the Moving Averages. Combining this knowledge with trendlines can help us decide if we have to go ‘long’ or ‘short’ in the currency pair.

Conclusion

Moving Averages can be useful for establishing the direction of a trend, but it should never be used stand-alone. If not other indicators, additional moving averages itself can be combined with an existing moving average to decide the direction of the trend. In the next article, we will be discussing how we can enter a trade using moving averages and profit from this indicator.

[wp_quiz id=”65733″]
Categories
Forex Basic Strategies

Most Profitable Ways To Trade The Triple Top Chart Pattern

Introduction

The Triple Top is a bearish reversal pattern that helps traders in identifying the peak areas of the market. This pattern occurs when the market prints three consecutive tops nearly at the same price level of any underlying asset. The areas of the touchpoints are the resistance levels, and the pullback between these points is known as the swing lows. After the third high or third touchpoint, if the price breaks the support and goes below, the pattern is said to be complete.

Traders can then activate their positions on the sell-side. Most of the traders try to be extra conservative and wait for the exact pattern to occur. But it can be challenging to find the Triple Top Reversal pattern with all the three highs at the same in size. We should always remember that the technical analysis is more of art and less of science. So even if 80% of the pattern rules are met, we can take the trades by confirming those signals with other credible technical indicators.

The Psychology behind the Triple Top Pattern

The appearance of a Triple Top Pattern implies that the buyers are slowly losing momentum in the market. It might also mean that the buyers are not willing to push the price higher. At the same time, the sellers are interested in taking the price lower. The Triple Top pattern is a way more powerful pattern than most of the other credible patterns in the market. This is because the third failed attempt of the buyers implies that the sellers are way too aggressive than the buyers. Hence we can expect stronger downward moves.

Triple Top Pattern – Trading strategy

The Triple Top pattern occurs very rarely on the higher timeframe. Even if it occurs, this pattern often takes a lot of time to develop fully. However, on an intraday timeframe, this pattern can be observed quite often.
Step 1: Identifying the TTP on a price chart

In the below AUDCHF Forex chart, we can see the market printing a clear Triple Top chart pattern.

Step 2: Entry 

The strategy is to wait for the breakdown to happen so that we can activate our short positions. On the 27th of January, we can observe the breakdown that occurred in this pair, and that can be considered as a clear Sell Signal.

Step 3: Stop-loss & Take Profit

We can activate our sell positions as soon as we see a bearish confirmation candle. We can go for two different targets in this trade. Both are at the higher timeframe’s support area. Most of the traders believe that their target must be double as compared to the size of the Triple Top pattern, but it’s just a myth. Always book the profit according to the market circumstances.

If the trend is super strong, go for the deeper targets. Contrarily, if the market momentum is fading, book the profit at any significant area. Traders who are well versed with pattern trading can add positions when the market goes back to the entry point so that they can ride the whole show again. While trading the breakout or break down patterns, always place the stop-loss near the recent low.

Triple Top Pattern + Double Moving Average

In this strategy, we have paired the Triple Top pattern with the Double Moving Average to identify accurate sell signals. A moving average will help us in identifying significant trends, trading opportunities, and entry/exit levels. Many traders believe that if they find the magic number of the period, then they can easily beat the market, but it’s not true. There are infinite numbers of periods available, and traders should practice only 3 to 4 periods, to use this indicator effectively.

Step 1: Identifying the TTP on a price chart

In the below chart, we can observe the market printing the Triple Top pattern on the NZD/JPY 60-minute Forex pair. We have applied the double MAs on to the price chart.

The traditional way to trade this pattern is to wait for the break down to happen and then go for sell just like we did in the above example. But in this strategy, let’s tweak things a bit by adding the double moving average to the plot. In this strategy, we are using the 14 and 9-period average. This strategy is purely for the intraday traders only.

Step 2: Entry, Stop-loss & Take Profit

After price action printing the third top, if we observe an MA crossover happening, we can activate our sell positions even before the breakdown. By following this approach, we get to enter the trade ahead of time, while the breakdown traders wait for the break down to activate their position. Most of the professional traders use this approach to maximize their profits.

There are many ways to close our positions. We can book profit at a significant support area. The placement of stop-loss depends on the trader’s trading style. If you are an aggressive trader, the smaller stop-loss is good. But expect more hits before the trade performs. If you are a conservative trader, use an extra spacious stop-loss.

Bottom line

A pattern is said to be paramount when it offers the best risk-reward ratio trades. Also, the pattern must have a higher probability of occurring in intraday timeframes. The Triple Top is one such pattern that offers both of these demands to every trader. Also, remember that the Triple Top is a bearish reversal pattern, so only take short positions when you see this pattern on the price charts. Apart from the ones mentioned above, there are different other ways to activate our position in the appearance of this pattern. But the above ones are the safest and most profitable ways to trade.

Try identifying and trading this pattern on a demo account before trading on the live charts. We hope you find this article informative. If you have any questions, please let us know in the comments below. Happy Trading.

Categories
Forex Basic Strategies Forex Trading Strategies

How To Trade Options With a Directional Bias Strategy

Introduction

A challenging question every trader comes across in his trading career is: whether he should be buying a call option or a put option? Traders establish directional bias by studying high-level charts, support and resistance levels, price action, and fundamental indicators. Dow Theory suggests that the market will continue to move in the same direction until an external force causes a reversal or break in the trend.

Directional bias plays a major role in the ‘trend-reversal’ strategy than in the ‘trend following’ strategy. Directional bias will help a trader decide if he should be going long or short in options. You can also identify the direction of the market trend. Once you establish a directional bias, you will have greater confidence in executing your trading strategy. During the process of execution, none of the actions are emotionally driven.

How to develop a directional bias?

Any trade which includes thorough preparation should consist of establishing directional bias, and it is a two-step process.

  1. Predicting the direction of the price move and overall trend.
  2. Identifying the trigger points and trading rules that will confirm our directional bias.

Determining a directional is just one step towards making a successful trade. There are many more things we need to put together before taking a trade. After backtesting a few strategies, establish some trading rules. Remember to include only those rules that confirm your directional bias. Confirming directional bias is an excellent habit that improves the success rate of trades.

A successful trading strategy is more about the right planning and psychology rather than a single entry technique or trading system. Options trading is said to be complex, hence requires a lot of knowledge before one can trade it. Other than that, you need to consider factors that are specific to options like time decay, option theta, option beta, and option gamma. We explain here how it is to be done correctly.

Directional bias through momentum indicators

The easiest way to establish directional bias is by using momentum indicators and price action analysis. If prices are trending in an upward direction, making higher highs and higher lows, traders should look to buy. On the other hand, if prices are making lower lows and lower highs, traders should look to sell. In this strategy, momentum indicators can be used as an additional confirmation tool.

Example of buying a call option

In the above picture, the orange line graph represents the momentum indicator. The price action pattern shows a formation of higher highs and higher lows, with the indicator pointing towards the buy-side. The candlestick pattern should be such that there is no opposing force that could possibly reverse the current trend.

Point of entry: The exact point of entry would be after the formation of at least one higher high and higher low. This is confirmed by the momentum indicator, which shows a sudden rise above the average value. This is a low-risk entry with maximum reward.

Take profit and stop loss: When the momentum indicator no longer makes higher highs and higher lows with the main trend, it is a sign that the trend might be coming to an end. Hence, you should book profits here. Stop-loss in this strategy should be placed below the previous higher low.

Note: All the trades discussed above are to be executed using a call option and not using the cash segment. It is advised to choose the strike prices accordingly. There could be some differences in the entry price and stop loss of options when compared to spot prices.

The same rules apply for sell trade as well, but here a put option needs to be bought, and you would essentially want to look for lower lows and lower highs.

Directional bias through Moving averages

We would like to conclude our methods of establishing directional bias with the use of ‘moving averages.’ This is one such technical indicator, which can be used to develop any new strategy. For this strategy, we use the 20-day moving average as it is considered to be one of the most powerful moving averages.

In the above figure, we have plotted the 20-day Moving average using the yellow line. This is a simpler strategy as compared to the momentum indicator strategy. Here, if you see the price trading above the 20-day MA, you should form a directional bias to buy. And if the price is trading below the 20-day MA, you should form a directional bias to sell.

Point of entry: When price crosses the MA line on any side and stays there for more than four candles, you should be taking entry in that direction of the trend. More the number of candles better will be the entry.

Take profit and stop loss: You can continue to hold on to the trade until the price reverses and crosses the other side of the MA line. If it crosses, book out your profits. Stop-loss can be placed at the high or low from where the market reverses.

Conclusion

If you use any other way of developing directional bias, make sure that it needs to be simple. If it becomes complicated, it can increase the complexity of your trading strategy. Having a directional bias will make you trade in the direction of the dominant trend, which is less risky. Finally, a trader needs to abstain from opening positions that have no directional bias.

We hope you find this article informative. If you have any questions regarding this strategy, please let us know in the comments below. Happy Trading!