Introduction
The MACD indicator was developed by Gerald Appel in the late 1970s. It stands for Moving Average Convergence and Divergence. MACD is quite popular, and it can be considered as one of the safest and most effective momentum indicators in the market. As the name suggests, this indicator is all about the convergence and divergence of the two moving averages. When the moving average moves away from each other, the convergence occurs. Likewise, the divergence occurs when the moving average of the indicator moves towards each other.

MACD fluctuates above and below the zero lines, unlike the RSI indicator that we discussed yesterday. Also, since MACD is an unbound indicator, it is not useful to find out the overbought and oversold market conditions. Instead, traders can look for the signal line crossovers, centerline crossovers, and divergence to trade the market.
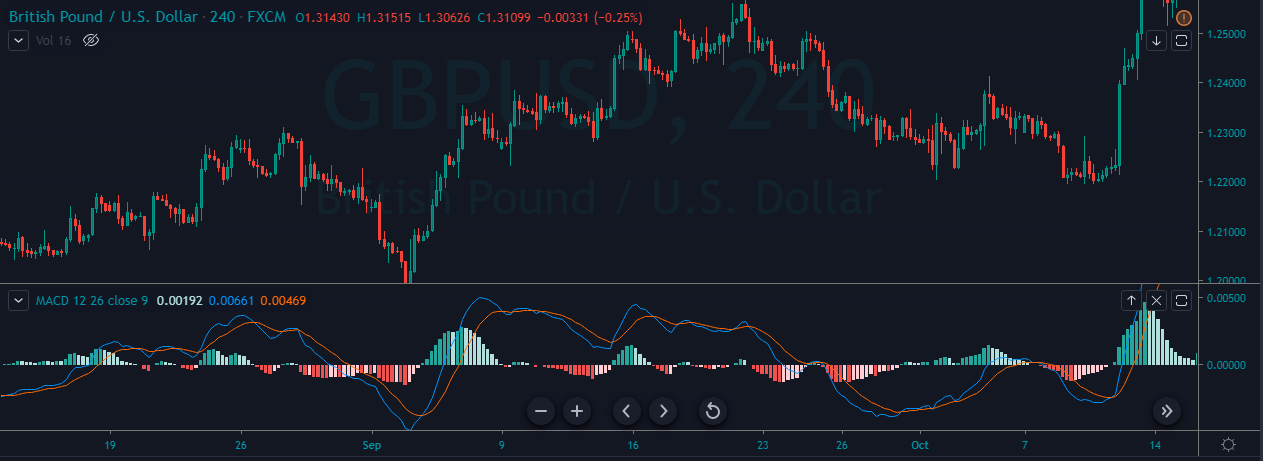
The image below represents the MACD indicator on the GBP/USD Forex chart.
How To Trade Using The MACD Indicator?
Signal Line Crossovers
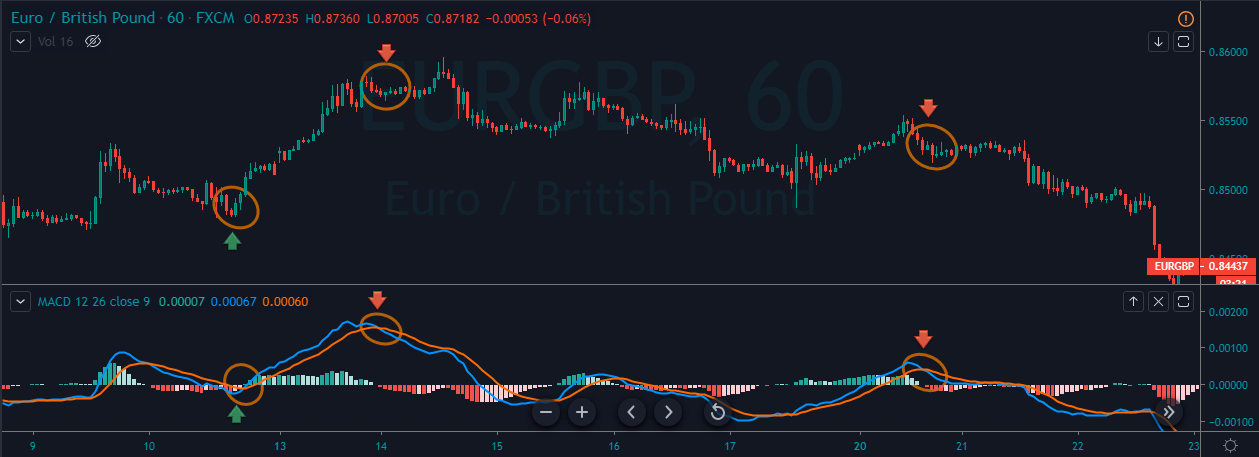
The signal line crossover is one of the most popular trading strategies designed around the MACD indicator. A bullish crossover occurs when the indicator prints a crossover below the zero-line. Contrarily, A bearish crossover occurs when the MACD prints a crossover above the zero-line.
If you are trading the lower timeframe, these crossovers last for a few hours. But if you are trading the higher timeframe, these crossovers can last a few days or even weeks. In the below chart, we can see a buy and sell signal generated by using the MACD indicator. In simple words, crossover below the zero-line indicates a buying trade, and the crossover above the zero-line indicates a selling trade.
Trade The Zero Line By Following The Trend
When the MACD line goes above the zero-line, it means that the trend of the instrument is gaining strength. When this happens, any buying anticipation will be a good idea. Conversely, when the indicator goes below the zero-line, it indicates a strong downtrend, and going short in the market is a good idea at that point.
If we plan to go long, it is advisable to trade with the trend. In a buy trend, if the MACD line indicates a selling signal, try to ignore that signal and wait for the buy signal. The same applies to the sell-side as well. If we find any breakout or breakdown supporting the MACD signal, that increases the probability of our trade performing in our desired direction.
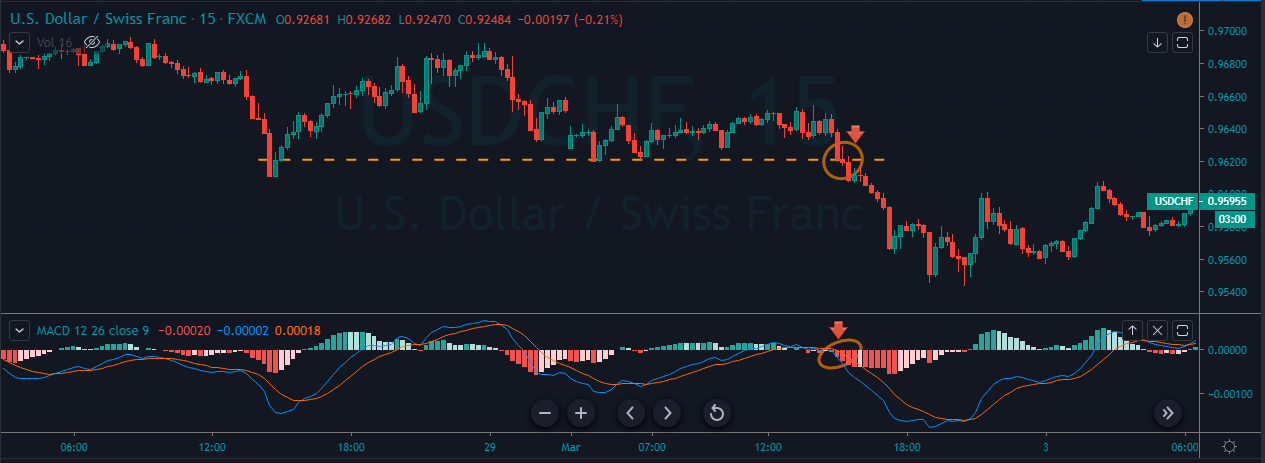
The below image represents a sell signal by using the MACD indicator. In a downtrend, when the price action broke the major resistance line, we can see a crossover on the MACD indicator below the zero-line. This clearly indicates the gained momentum by the sellers,, and going short from here will be a good idea. Make sure to book the profit when the MACD indicator gives the crossover to the buying side.
MACD Indicator + Double Moving Average
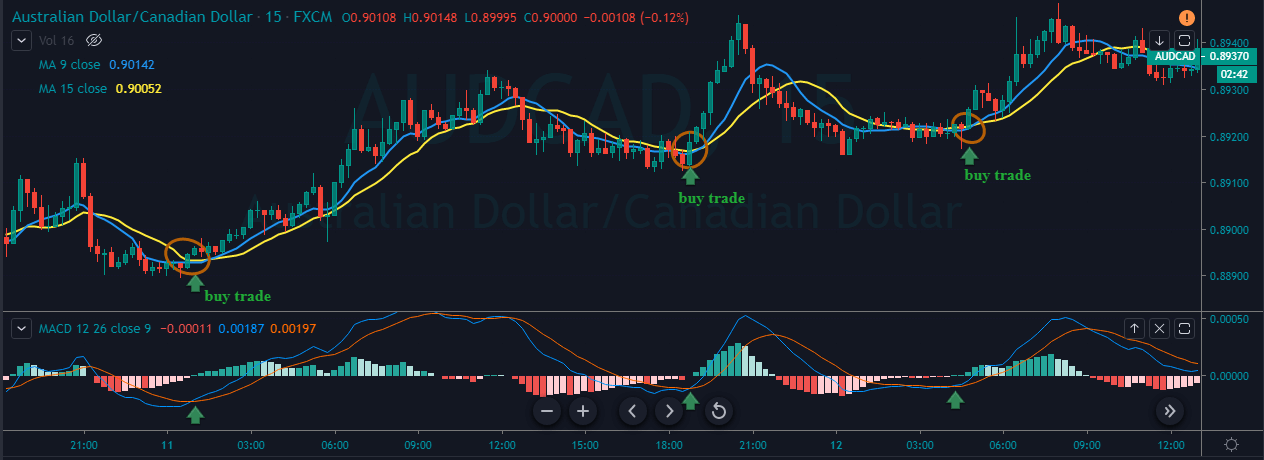
We have learned what Moving Averages are and how to use them on the price charts. In this strategy, we are pairing the MACD indicator with 9-period and 15-period moving averages to identify potential trading signals.
The strategy is to go long when the MACD gives a crossover below the zero-line and the moving averages crossover below the price action. Conversely, go short when the MACD indicator gives the crossover above the zero-line and the moving averages crossover above the price action. It is advisable to use this strategy in healthy market conditions, and the lower period averages work fine for intraday trading only.
As you can see in the below chart, the market was in an uptrend. Using this strategy, we have identified three buying opportunities. All of these three trading opportunities have gives us 70+ pip profit in just two days. As we know that the moving averages act as dynamic support and resistance to price action, it is safe to put the stops just below the moving average indicator and exit our position when any of the indicators give an opposite signal.
That’s about the MACD indicator and how to trade the Forex market using this indicator. If you have any questions, let us know in the comments below. Stay tuned to learn about many more technical indicators in the upcoming sections. [wp_quiz id=”66874″]