Introduction
Momentum indicators are those indicators that determine the rate of price changes in the market. These indicators are helpful in determining the change in the market trend. In this lesson, we shall be talking about the MACD indicator, which is one of the most extensively used momentum indicators.
Moving Average Convergence Divergence – MACD
Moving Average Convergence Divergence – MACD is a momentum indicator that primarily works on the relationship between two moving averages of an instrument’s price. Precisely, it takes Exponential Moving Average into consideration for its calculation.
A misconception in the industry is that MACD is a lagging indicator. There are a set of people considering it as a leading indicator, while some see it as a lagging indicator and use it as a confirmatory tool. Note that MACD is both leading as well as lagging indicators.
MACD is said to be a leading indicator when it is used to identify oversold and overbought conditions. It indicates the possibility of a reversal when the market is actually moving in the other direction. However, this form is not widely used. On the other hand, it is said to be a lagging indicator if it is used for crossovers. One will be aware of the market trend when there is a crossover on the indictor. But when this happens, the market would have already made its move.
Also, that’s not it. The real element of momentum is added by the histogram. This true aspect of MACD reveals the difference between the MACD line and the EMA. When the histogram is positive, i.e., above the zero-midpoint line but is declining towards the midline, then it indicates a weakening uptrend. On the contrary, if the histogram is below the zero-midpoint line, but is climbing towards it, then it signifies a slowing downtrend.
Apart from this, it is also used for identifying divergence in the market. That is, indicates when there is abnormal motion in the market, hence, indicating a possible change in direction.
What is the MACD indicator composed of?
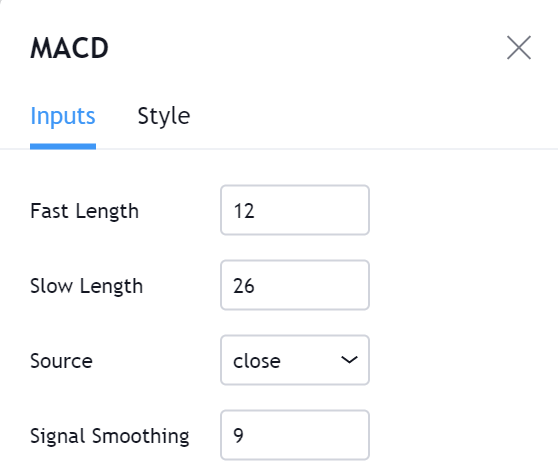
The MACD is made up of two moving averages. One of them is referred to as the MACD line, which is derived by finding the difference between the 26-day EMA and the 12-day EMA. The other is the signal line, which is typically a 9-day EMA. And there is a zero-midpoint line where the histogram is placed.
MACD as a Momentum Indicator
To understand how momentum works in MACD, consider the example given below.
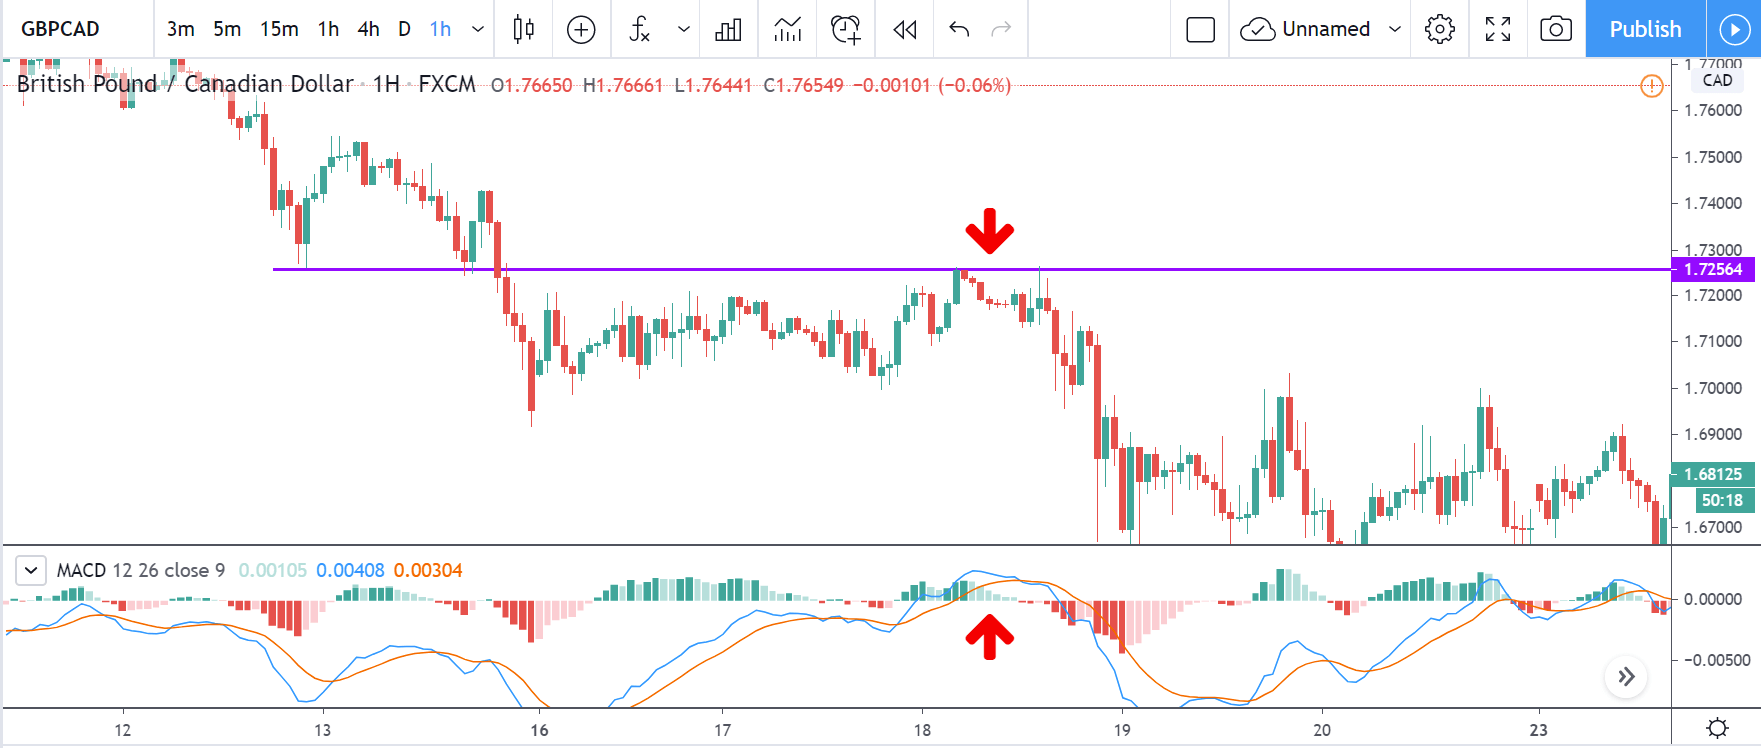
Firstly, the market is in a downtrend where the purple line represents the Support & Resistance level. In other terms, this line indicates a potential sell area. Below the price chart, the MACD indicator has plotted as well. Observing closely at the histogram at the marked arrow, it is seen that the histogram was falling towards the zero-midpoint line indicating the weakness of the buyers. Also, this situation happened in the area where the sellers are willing to hit the sell. In hindsight, the MACD gave the right signal solely from the histogram.
This hence concludes the lesson on momentum indicators. We hope you found this lesson very informative. If you have questions, leave us a comment below. [wp_quiz id=”71030″]