Introduction
In our previous two discussions, we enlightened you with different strategies for using the pivot points. If you noticed, there we focused only on the pivot support and resistance levels. We didn’t really touch base on the Pivot Point (P) level. So, in this chapter of pivot points, we shall understand how the pivot point level is useful.

The usefulness of Pivot Point
The pivot point is used to measure market sentiment. Yes, with pivot points, we can even gauge the sentiment of the market. In other words, the pivot point helps us determine the direction of the market. It tells us in which direction is the money flowing in the market. So, basically, it indicates the trend of the market. Now, let’s take a few examples to understand the use of pivot points.
What does a Pivot Point tell us?
We know that the pivot point determines the type of market we are in. Inferences are made when the price falls below or above the pivot point.
- When the market breaks below the pivot point (P), it indicates a bearish market or a market where the sellers are under control.
- When the market breaches above the pivot point (P), it indicates a bullish/buyer’s market.
Bearish Example
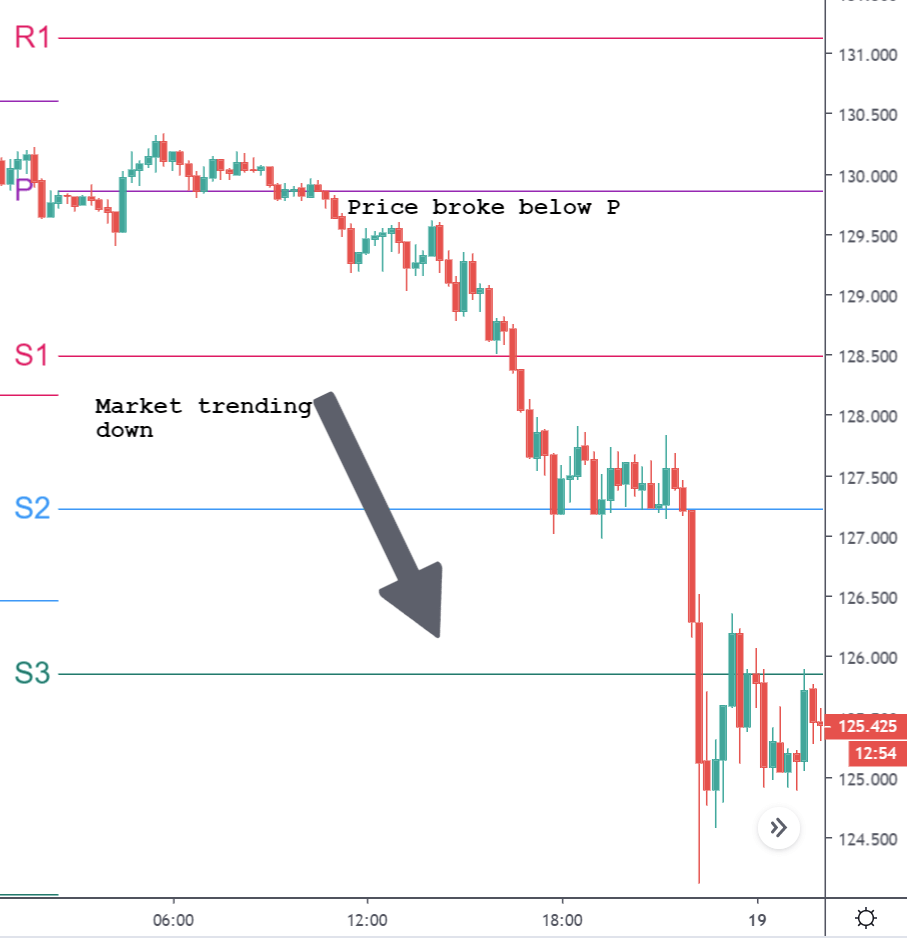
Consider the chart below representing the GBP/JPY on the 15min timeframe. The pivot points are indicated as shown. Initially, we can see that the market was holding above the Pivot Point (P). Later in the day, it broke below the pivot point and then continued to move south. Also, it didn’t even respect the support levels. From this, we can conclude that the support levels do not work every single time. It perfectly fine when it is combined with other tools of analysis. However, a breakout trader would’ve profited the most from it.
Most importantly, one must not use this pivot point level as a tool to enter a trade. It is only an indicator that determines the sentiment of the market. It only tells us if the buyers are showing interest in the currency pair or the sellers. And with information in hand, we use other trading techniques to time the market.
Bullish Example
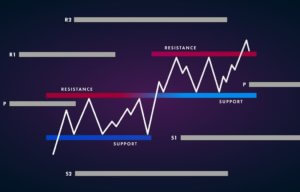
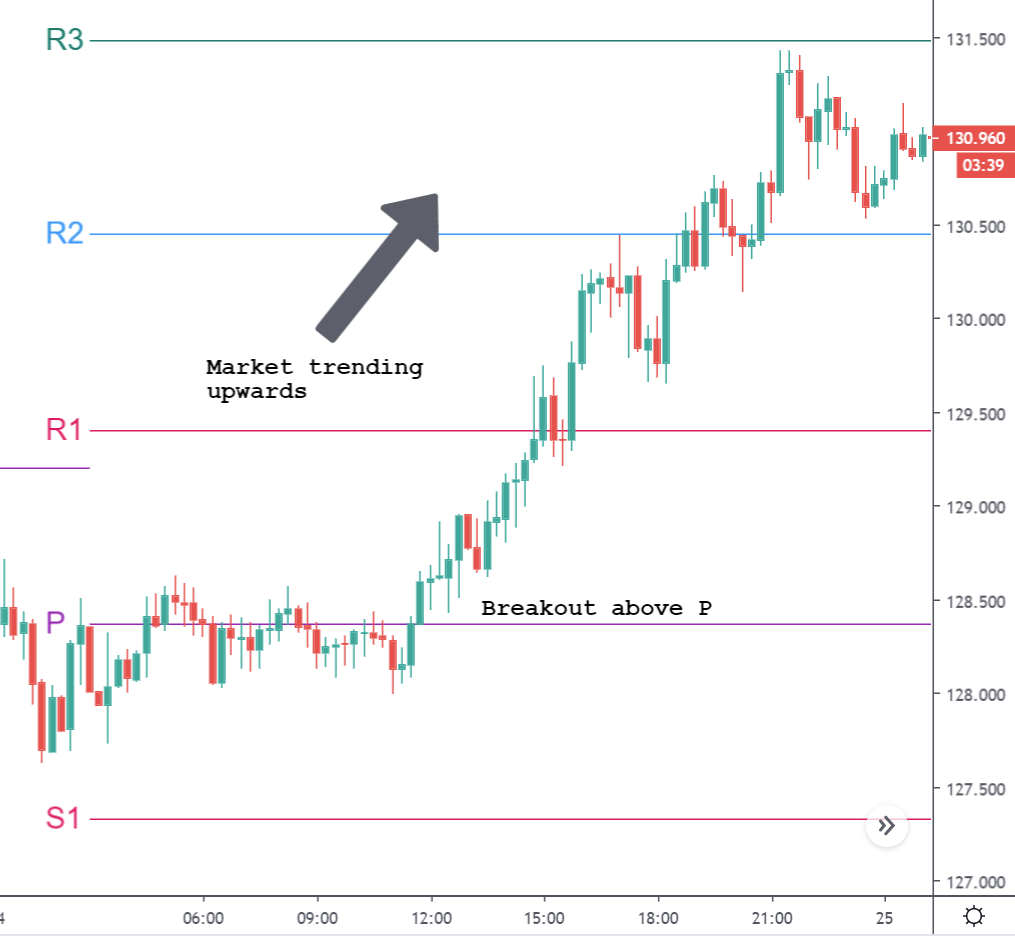
In the below chart, we can see that the market was trading below the pivot point level. Then it shot up and broke the pivot level as shown. This marks the start of an uptrend. And it is clearly visible that the market headed north by breaking through R1 as well as R2. But at R3, it found resistance. Now since the market is trending up, one can look at the price drop from R2 as a discount and anticipate buying at the R2 level, which is ‘resistance turned support.’
Similarly, traders can determine the direction of the market using the pivot point level and time their entry based on other technical tools and ideas. We hope you found this lesson informative and interesting. Cheers! [wp_quiz id=”69915″]