Introduction
Measuring volatility enables traders to accurately identifying the significant trading opportunities in the currency pairs. An increase in the volatility of a currency pair occurs due to any of the major changes in the economy of that country. Market volatility measures the overall price fluctuations over a specific period, and this information is used to identify the potential breakouts.
In the Forex market, the higher the volatility, the riskier is the currency pair to trade. A higher volatility means that the asset value can be spread out over a larger range of values. A lower volatility means that an asset does not fluctuate dramatically and tends to be more steady. A few indicators help us in measuring the volatility of the currency. Using these indicators will show us the accurate representation of the market’s volatility when looking for trading opportunities.
Bollinger Bands
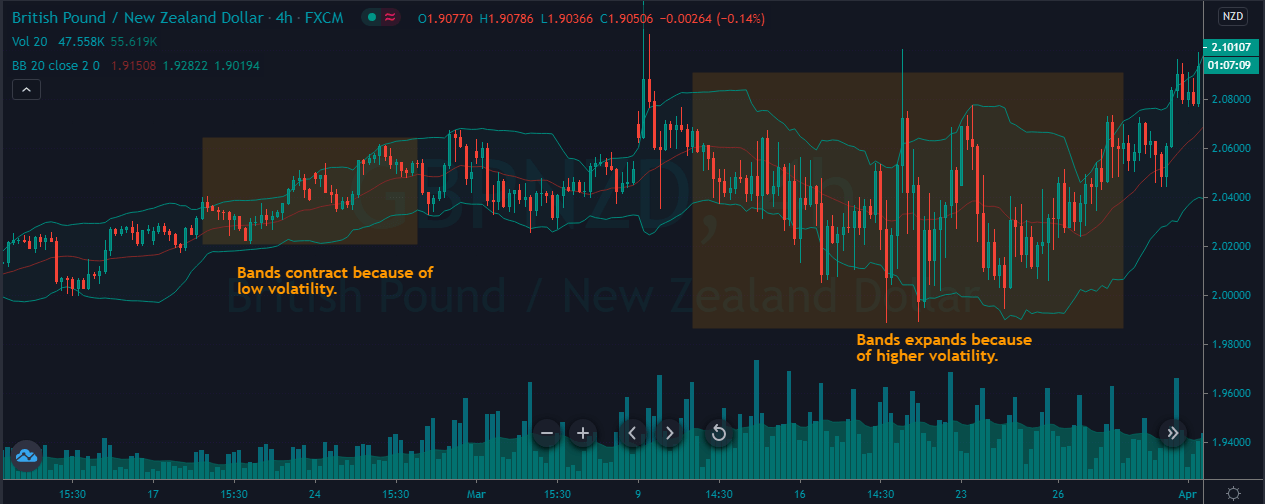
We have discussed a lot about Bollinger Bands in our previous course lessons. This indicator is specially designed to measure the volatility of an asset. In this case, any currency pair in the Forex market. This indicator consists of two lines (bands) plotted above and below the middle line, a moving average. The volatility representation is based on the standard deviation, which changes as an asset’s volatility increases and decreases. Both these bands contract and expand according to market volatility. When the bands’ contract, it tells us that the volatility is low, and when the bands widen, it represents an increase in volatility.
Moving Average
Moving Average is the most common indicator used by traders across the globe. It measures the average amount of market movement over a specific period. If we set the moving average to 30 periods, it shows us the last 30 days’ average movement. In short, any Moving average tells us the average price movement over a specific period. If the MA line is above the actual price, that implies the market is in a downtrend and vice versa.

Average True Range (ATR)
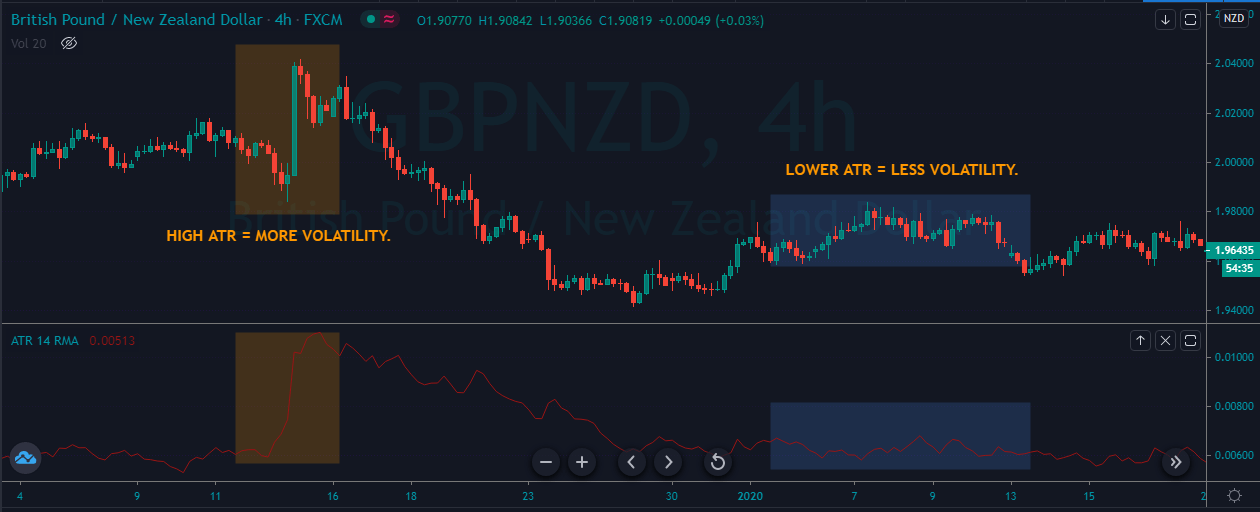
The ATR (Average True Range) is another reliable indicator used to measure market volatility. This indicator takes the currency price range, which is the distance between the high and low in the time frame, and then plots that measurement as a moving average.
If we set the ATR to 40 range, it will tell us the average trading range of the last 40 days. The lower the ATR reading means, the volatility is falling, and we can expect fewer trades. On the other hand, the higher the volatility means the ATR reading is rising. It is an indication that the volatility is on the rise, and by using any directional indicator, we can gauge the potential trading opportunities.
These are the three best tools you need in your arsenal to measure the market’s volatility accurately. Make sure to take the below quiz before you go. Cheers! [wp_quiz id=”92111″]