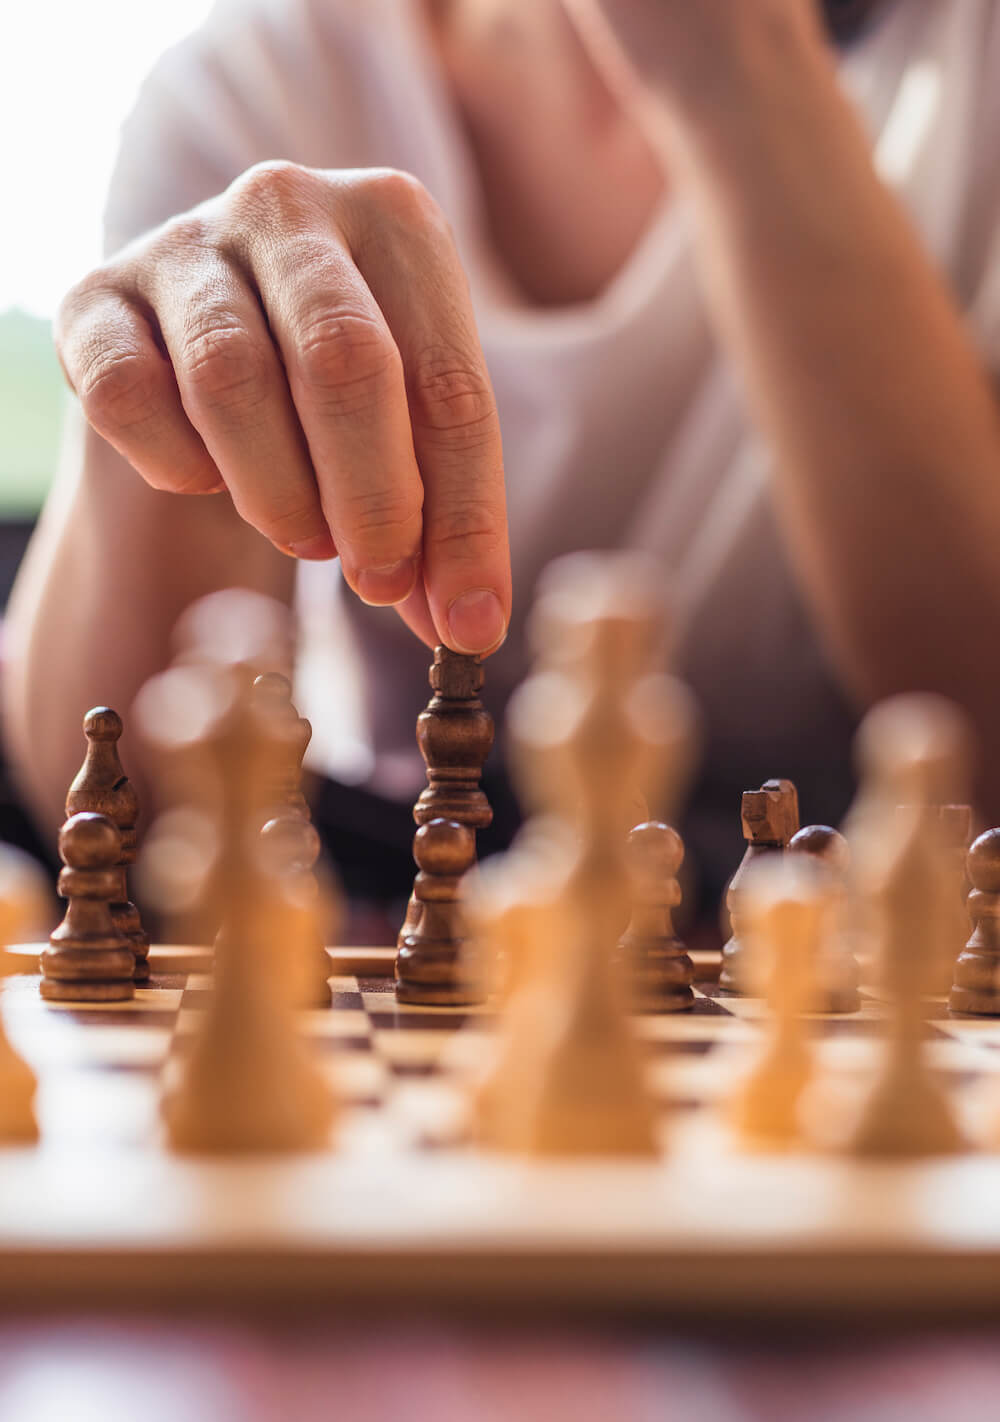
The necessity of a trading system has been discussed many times. Still, new traders don’t consider it important when, in fact, it is a crucial element. Could you conceive building a bridge without a project, playing tennis, or chess, with no strategy?

The trading profession is alike. If you take this business seriously, you’ll need to have a plan. Else, you’ll be in the loser team, in which are 90 percent of traders.
Reasons for a trading plan
1.- The financial markets are not deterministic

A market is a strange place where you cannot predict an outcome. An engineer can design a bridge, knowing that he can predict the bridge’s strength and behavior under heavy loads with proper calculations. In the financial markets, you don’t have the benefit of an analytical formula to success. All you can expect is a small edge. Not following your plan is comparable to random trading; thus, losing the edge.
2.- Not following a plan weakens you psychologically
When you buy a lottery ticket or play roulette, you’re entering a bounded game. You know the cost of your ticket, the reward associated with a successful bet, and you don’t need to make any other decision. All parameters of the play, including the exit time, are fixed.
The financial markets are different. Everything there is unrestricted. The trader decides when, how much, exit time, stops, and target levels. With so many parameters, a trader needs to define his rules and stick to them. Otherwise, he will be shattered by his emotions and lose money.
3.- The need to measure
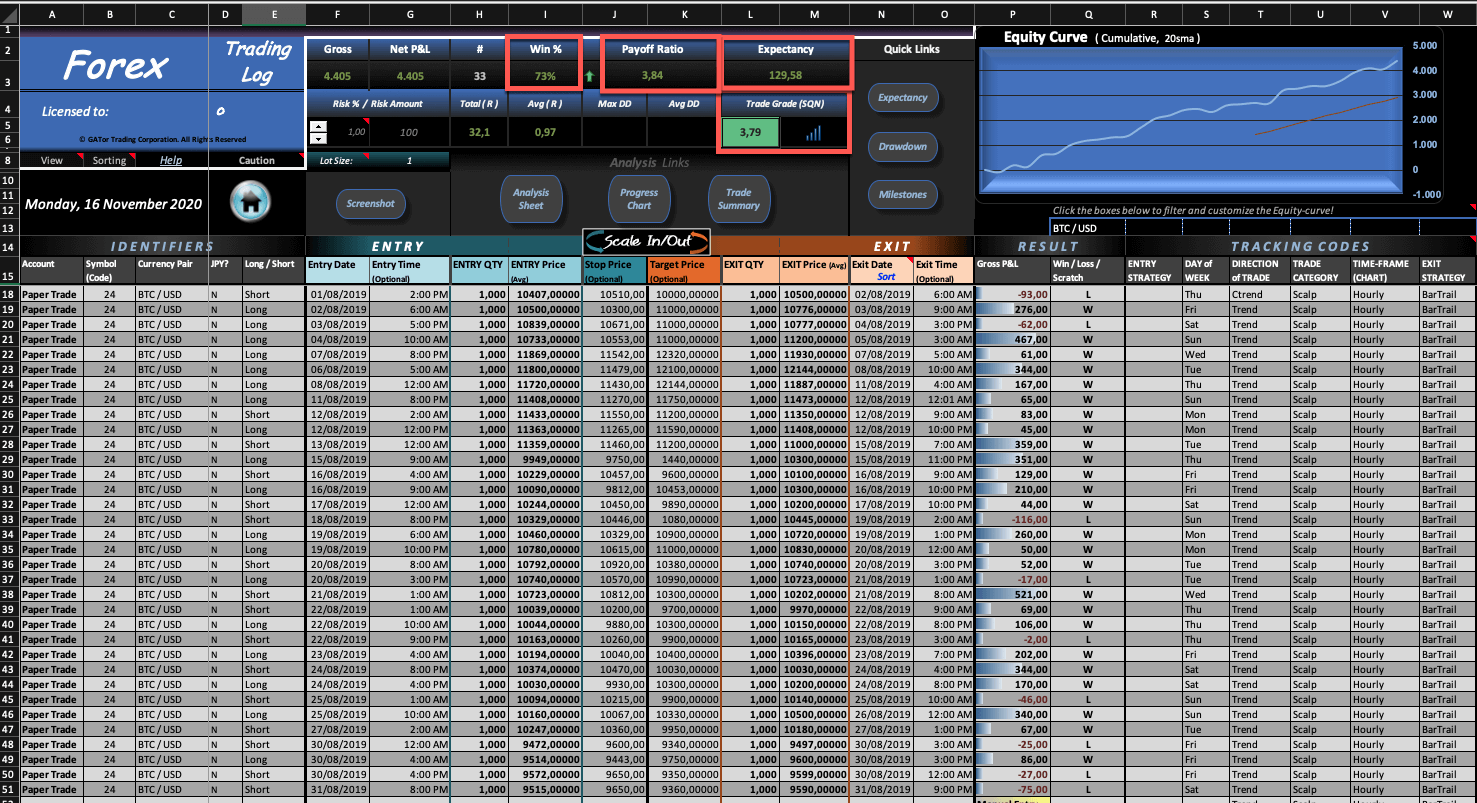
Traders need to record and analyze their trades for many reasons. The first is the need to analyze their performance and see if it has improved or not. Also, if the system performs as expected or lags its past performance. The most important reason is that traders need to know the strategy’s main parameters: percentage of winners, reward/risk ratio, the average profit and its standard deviation.
A trading plan that fits you
 New traders don’t know much about statistics, and trading is about odds and their properties. One of them is streaks. There are winning streaks and losing streaks. The point is, streaks are mathematically linked to the ods of the system.
Let’s think of a system as a loaded coin, in which the odds of a winner can be different from 50 percent. Let’s say the odds of a system is 60 percent instead. That means there is a 60 percent chance the next trade is a winner, and, consequently, a 40 percent chance it is a loser.
But what are the odds of a loser after a previous losing trade (a two-losing streak)? For the second trade to be a loser, the first one should also be a loser. So the odds of two consecutive losing trades in a row is 0.4 x 0.4 = 16%. The odds of three successive losers would be 0.4×0.4×0.4 =6.4%, and so on.
The general formula for the probability of a losing streak is
n-losing-Streak = prob_lossn
which is the probability of one loss to the power of n, the size of the losing streak.
What we have shown here is that streaks are inherent to trading. In fact, inherent to any event with uncertainty. Golf pros, football players, and spot teams are subject to streaks, which are entirely expected. Trading systems are no different.
So, what’s the problem?

There are a variety of trading systems. Some, such as the well-established Turtles Trading System, which is trend-following, have less than 38 percent winners, although with average reward/risk ratios over 5. Other systems show over 70 percent success but reward/risk ratios of less than 1.
The odds of a 10-losing streak on the Turtles system, assuming 38% winners or 62% losers, is about 0.84%. That means we can expect ten losers in a row every 120 trades.
On a 70% winner system, the odds for ten losers in a row are one every 200 thousand trades.
The rationale behind the turtle is to lose small and profit big. When a Turtle trader sees they are right, they add to their position, and on and on, following the trend.
People who use the later system are scalpers that jump for the small profit and get our fast before the movement fades.
Nobody is wrong. They trade what best fits their psychology. You need to know your limits, as well. Many wannabe traders move from system to system after only a five-losing streak, discarding a sound strategy when its first perfectly normal streak occurs. Also, most traders use sizes inconsistent with the expected streaks and lose their entire account.
By now, you should have learned the importance of having a plan that fits your psychology and trading tastes.
In the coming article, we will discuss the components of a trading strategy or system. Stay tuned!