Chances are if this is the first time you’ve heard that square R, you have no idea what exactly I mean or where the thing is going. It is normal, there is much written about supports, resistances, chartist figures. but not so much about more objective indicators. The subject is a bit technical, based on mathematics and statistics, but I’m going to (try) explain it in a practical and straightforward way. In the end, everything is easier than it looks.
What is the R Square?
First, let’s start by defining and understanding the concept of R Square. R Square is a coefficient of statistical determination, also represented as R2, which allows us to predict some results or test a hypothesis. In other words, when we analyze a statistical model, the square coefficient R determines the efficacy of the model (which is so good) and also expresses the percentage or proportion of variation results that are explained by this model.
With this definition clear, in order to use this coefficient R square in practice, it is necessary to understand two important concepts:
Linear Regression: In statistics, a linear regression, also known as linear dependency, is a mathematical model used to approximate the dependency relationship between a dependent variable (for example Y), independent variables (X1,X2,X3,ǐ.Xn) and a random term ɛ (associated with any process whose outcome is only foreseeable in the intervention of chance).
Pearson correlation coefficient: Speaking of statistics, the Pearson correlation coefficient is a linear measure of the degree of relationship between two quantitative random variables, that is, two variables that can be measured or observed and also represented by numerical quantities.
Now, defined these concepts, you may be wondering: How to use this to evaluate my trading system? Step by step.
Each trading strategy or system needs an objective assessment of its effectiveness. In order to achieve this goal, we could get to use an extensive range of ratios, some more complex than others, both in their calculation process and in their interpretation. Despite all this variety, there are very few quality metrics to evaluate something very important: the regularity of the system’s balance line or trading strategy.
To do this, let’s manage the coefficient of determination, R square, to calculate the quantitative estimate of that ascending straight line that all traders want to see in our results.

Characteristics of an Assessment Criterion for Trading Systems
Each criterion or ratio used to evaluate the effectiveness or robustness of a trading system has its limitations in application. There are no ideal or pre-established criteria that allow us to determine with absolute certainty the robustness of a trading system. However, some properties or characteristics may be formulated that must have:
Independence in relation to the duration of the probationary period: Many parameters of the trading strategy or system depend on the duration of the trial period, for example: the longer the trial period for a profitable strategy, the greater your net profit. Independence from the time period is necessary and essential to compare the effectiveness of different strategies in different trial periods.
Independence of the end point of the test: For example, if the strategy «plays» with which simply exceeds the losses, the end point of the test can considerably change the final balance. The criterion or indicator should be immune to such machinations and provide a clear picture of the trading system’s work.
Simplicity of interpretation: All indicators of a trading system must be quantitative, that is, they must be represented by a certain number. It is important that this number is intuitively understandable. The simpler the interpretation of the value obtained, the easier the parameter to understand. It is also desirable that the value of the indicator is within a set range or a defined range, as it is more difficult to understand the meaning of extremely large numbers.
Representative results with few transactions: This is probably the most complicated requirement to meet in the list of features for a good metric because all statistical methods depend on the number of measurements. The higher the measurements, the more stable the statistics obtained. It is virtually impossible to fully solve this problem in a small sample, but you can soften the effects that arise due to a lack of data.

Linear Regression Application
To calculate the coefficient of determination R square, we must calculate or determine the linear regression. As explained above, there may be several independent variables, however, for a better understanding we will use the simplest case: A single independent variable.
In the case of an independent variable, the linear regression or dependence of a dependent variable (Y) on an independent variable (X) can be expressed by the formula Y=aX+b. This formula graphically represents a line in the XY plane, hence the name linear regression.
Now we will choose on our trading platform a chart of a currency pair, of our preference, with a clear upward trend in a given period of time. We download and save this data, then build a chart in Excel with closing prices. On the Y-axis we will have the closing prices and on the X-axis the dates that we will replace by order numbers (for convenience: 1, 2, 3, A). In doing so, we’re going to get a chart with a clearly bullish trend, but we’re interested in a quantitative interpretation of that trend.
The easiest way to reach the target is draw a line that will be more precisely adjusted to the trend obtained in the chart. This line is linear regression. If the graphic is fairly uniform one or more straight lines can be drawn that fit or describe our bullish graphic. Then a question arises: which of these lines is correct? The correct line shall be that straight line where the sum of the distance of the existing points to the line is the minimum distance.
It is also important to note that the regression line must always pass through the center of gravity of all the data that make up the point cloud. The coordinate of this point of gravity would be on the x-axis, the mean of the x-variable, and on the y-axis, the mean of the y-variable. Knowing a point of the line we can use the slope point equation to determine the line equation. By getting the correct line we can calculate the coefficients of the linear regression.
Pearson Correlation Coefficient
Once the linear regression is calculated, we have to calculate the correlation between the line obtained above and the data on which the line was calculated. Let us remember that correlation is the statistical relationship between two random variables. The correlation can take values ranging from -1 to +1. A value close to zero means that there is no relation between the measured values, a value of +1 (or very close to it) means a direct relation of the variables and a value of -1 (or very close to it) means an inverse relation of the variables.
The Pearson correlation coefficient could be calculated by means of the following formula:
Where: XY – is the covariance of (X, Y)
X: is the standard deviation of the variable X
Y: is the standard deviation of the variable Y
Covariance is a value that indicates the degree of joint variation of two random variables with respect to their means. In other words, it is the common variance between the variables and the standard deviation is the square root of the variance.
The Pearson correlation coefficient shows how far the line describes the data. If the data points are at a large distance from the line, the dispersion is high and the correlation is low and conversely, if the data points are at a small distance from the line, the dispersion is low and the correlation is high. A value of zero says there is no relationship between linear regression and data.
Importantly, in Metatrader there is a metric called LR Correlation and shows the correlation between the balance line and the linear regression found for that line. However, in the statistics, they do not usually directly compare the data and the regression that describes them.

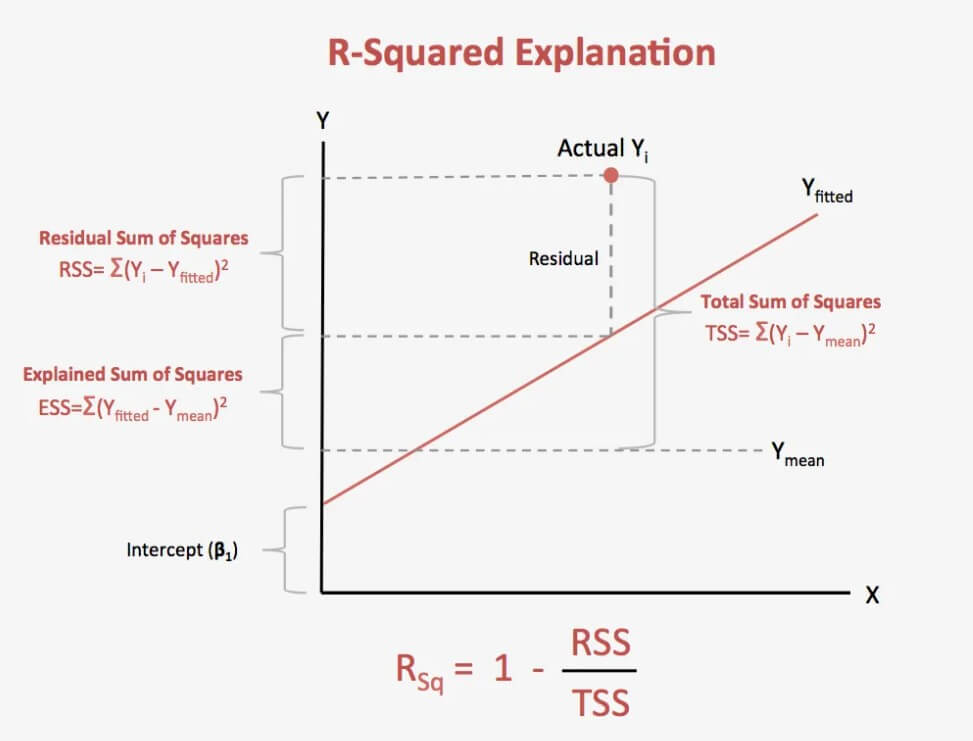
Calculation of the Coefficient R Square
In the case of linear regression, to calculate the coefficient of determination R squared is sufficient by squaring the Pearson correlation coefficient that we calculated in the previous step.
This coefficient can take values ranging from 0 to +1, being a result equal to zero or very close to zero pure random unpredictable and a result equal to or very close to one a market in which all quotes are placed on the line. R square shows us what percentage of the price movement follows a definite trend, while the rest of the percentage will be due to random movements.
Limitations On Use
Each statistical metric has its advantages and disadvantages and the coefficient of determination is no exception. Some disadvantages are:
- They depend on the number of trades. Exaggerate indices with few trades.
- For calculation, complex mathematical computations are required.
- It is applicable exclusively for the estimation of linear processes, or systems trading with a fixed lot.
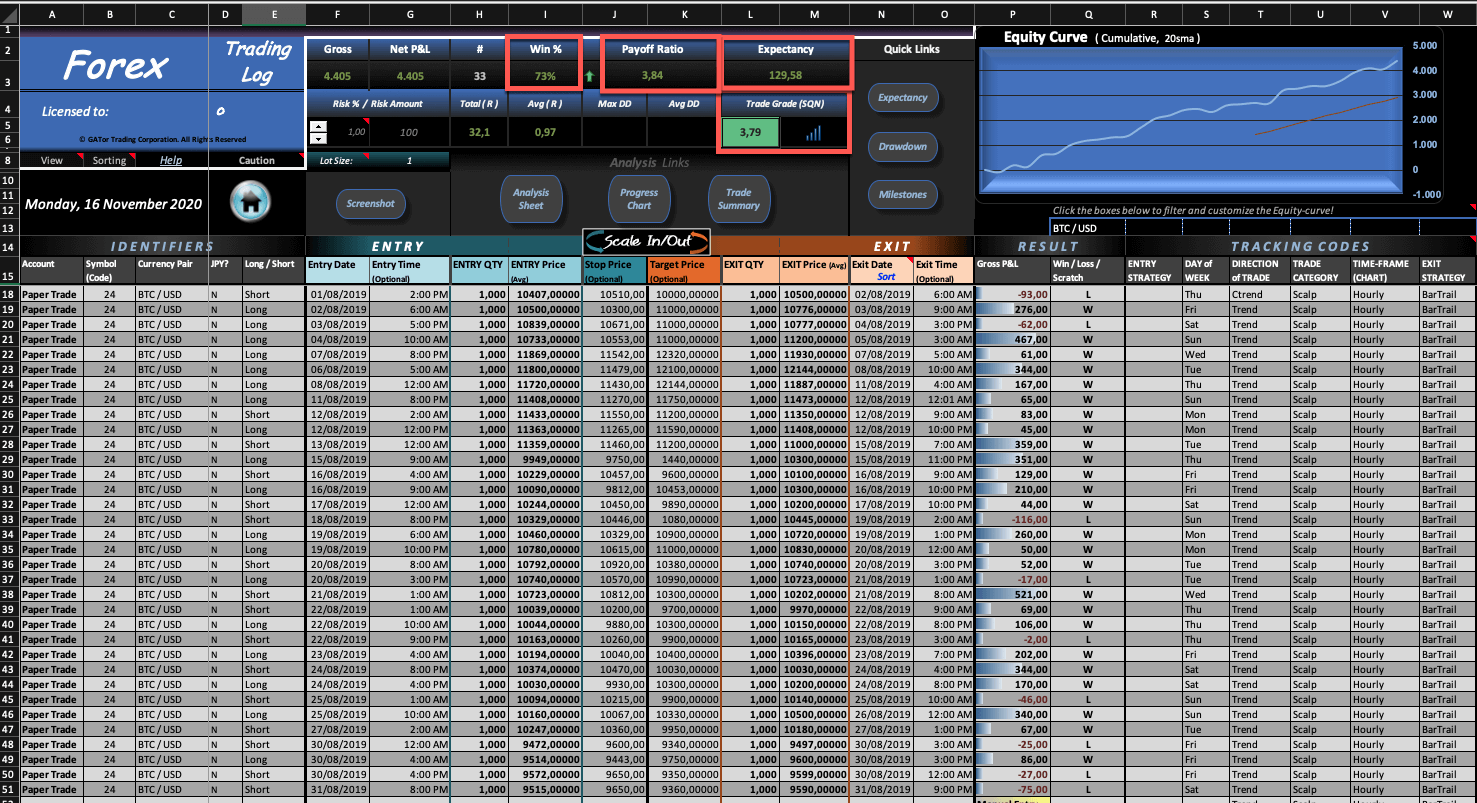
Application in Trading Systems
In trading systems you can see this ratio represented in percentage, which the closer to 100% the better (in theory) is the quality of our system. In my experience, a system with a score above 65 usually has a fairly stable performance over time. It’s one of my favorite filters.
Conclusions
After analyzing and studying the process of calculation of the coefficient of determination R square I can tell you that this coefficient is one of the few measures that calculate the regularity of the curve both of the line of the balance sheet, and of the unrecorded benefit of the strategy (among others).
R² is easy to use because its range of values is fixed and is within the limits of -1 to +1. Values close to -1 alert us or warn us of the negative trend of the balance of the strategy. A value close to zero warns us of the lack of trend in the balance sheet of the strategy. Values close to +1 warn a positive trend.
As I have told you, the square R, like any other ratio, has its limitations that you must take into account. In my case I use it as a top 3 ratios to measure if I have a valid trading strategy or if instead it goes to the trash.


 New traders don’t know much about statistics, and trading is about odds and their properties. One of them is streaks. There are winning streaks and losing streaks. The point is, streaks are mathematically linked to the ods of the system.