Categories
Forex Risk Management

Are Risk and Volatility One In the Same?

According to the dictionary, someone or something is volatile when it changes or varies easily and unpredictably. Speaking of a financial asset, its volatility or standard deviation is a statistic that describes simply with a number how much the price moves over time. That is the more volatility an asset exhibits, the faster and more extreme its unpredictable fluctuations are.

“That morning no one could imagine that John Appleseed would decide, instead of going to his office, to go to the mall with his AK-47 and murder for no apparent reason a dozen of his neighbors. Later, a friend of his commented in tears to the news channel: We don’t understand what happened to him, he seemed so normal, so non-volatile…”

The adjective “descriptive” here is key, as volatility only gives us observable information of past price variations. It tells us nothing about the nature and risk of the underlying process that produces it. This distinction is essential and is often ignored, mistakenly identifying risk with volatility. The adjective “descriptive” here is key, as volatility only gives us observable information of past price variations.

Risk is a difficult, complex, and multidimensional concept. Meanwhile, volatility and other descriptive statistics are a comfortable attempt to reduce their many faces to a simple number. As if the speedometer of the car gave us all the necessary information regarding the risk of driving. Even the CNMV uses a risk scale between 1 and 7 depending on volatility to classify IFs. Thus, a “1” fund has virtually no risk, and a “7” fund is very risky.

“Even the CNMV uses a risk scale between 1 and 7 depending on volatility to classify investment funds… This doesn’t make any sense.”

This doesn’t make any sense. If we imagine a fund that loses exactly -2.00% every month, its volatility according to the standard deviation formula would be zero (it has no volatility) and could be considered “risk 1” on the scale. Perhaps avoiding these contradictions, on the CNMV website they heal in health and hide saying that even if a fund is classified as “1”, it does not mean that it does not have risk. But they don’t explain why.

The Volatility of the Crocodile

Investors seized on the back of a financial product of low volatility. To better understand why it is a mistake to make equivalent risk and volatility, let’s look at the example of the pelican and crocodile. If we observe for a long time the quiet movement of a crocodile by the river, it transmits to us the information that there is no danger, that its movements are slow (little volatile) and we can predict and adapt to them easily.

So, our sympathetic pelican can ask the crocodile to take him to the other end of the shore and trust that he will continue to behave as he has done so far. In this example, the pelican is equating the very low observable volatility of the crocodile with very low risk.

Why does the pelican think there’s no danger? Because if we do not know its underlying nature and only know its volatility (which is observable), the risk of not getting safely to the other shore should be minimal. But all who know the nature of the crocodile know that there is a great and silent (unobservable) danger.

“Why does the pelican believe there is no danger? Because if we do not know its underlying nature and only know its volatility (which is observable), the risk of not getting safely to the other shore should be minimal.”

Crocodiles move most of the time very slowly (they are very few volatile), but occasionally and unpredictably, their behavior changes radically: they move extraordinarily fast (much faster than its past volatility could even make us imagine) to trap in its jaws its trusting victim. Therefore, the mere empirical observation of the behavior of an asset, product, or strategy (its track record) is not sufficient to know the risks we face when investing.

The volatility of a fund or product is not a good measure of risk because it only tells us how much it moves over time, not about the nature and risks of that movement or where the underlying strategy can take us. Risk is too complex and profound a concept to be reduced to a simple and comfortable (for clients and quantitative analysts) number.

The volatility of a fund or product is not a good measure of risk because it only tells us how much it moves over time. It is in the nature of the underlying strategy that the risk of investment funds and products lies, not in their volatility. There are very risky and non-volatile strategies (investment crocodiles). An extreme example is the sale of options out of money.

This strategy produces positive monthly returns over long periods with hardly any volatility, which makes them very easy to pack and market (its track record of continuous increases without volatility, for example of approximately +1% per month, sells very well). Eventually, a crash happens in the markets, causing the investor to lose, if not all, virtually everything previously invested and earned in the fund.

High volatility stock market investment, but harmless in the long run. On the other hand, there are very volatile strategies with little risk, which we might call the Chihuahua investment in our zoo: They move a lot and make a lot of noise, but they are totally harmless.

The trivial example is the investment in diversified stock exchange globally through ETFs or low-cost fund, considered as very risky because of its high volatility (we can temporarily lose half of the investment), but that in the long run will give us a return around double the world’s GDP growth. Paradoxically, it is the risk-averse investors who give up profitable and low-risk long-term investments, preferring low-volatility products that sometimes hide crocodiles.

The reason is more psychological than rational: they can’t bear to see that they are losing money for a while (a key point I already talked about in Volatility and Emotional Accounting). The industry knows this and gives the customer what he asks for, even if it’s not what’s best for him. That is, mostly crocodiles of low volatility instead of (noisy) chihuahuas of high profitability.

Categories
Forex Market

Five Ways to Survive and Thrive in Extreme Volatility

Market volatility can be both a blessing and a curse, Many traders out there trade only in the most volatile of conditions, while others get hit pretty hard when it takes them by surprise. The volatility of the markets at what give us our profits as well as our losses, so it is important that we have an understanding of how to control our trading during times of volatility and also how to potentially predict it to help us get through it with as little damage as possible. Volatility has caused a lot of accounts to blow in the past and it will cause a lot more to in the future to, so that is why we are going to look at different ways that you can help prevent it from happening to you.

Limiting Trade Sizes

The first thing that you can do to help protect yourself and your account during these volatile times is to limit your trade sizes. The larger your trades are the more danger you will be putting yourself in. During extreme volatility, the markets can jump up and down in pretty large chunks. This is something that can be pretty deadly when it comes to an account that is using larger trade sizes. So in order to combat this, we need to ensure that we are either using the appropriate trade sizes for our account or if we often use larger ones, to try and reduce them during these times. This will then prevent any larger losses should the markets jump in the opposite direction. It will, of course, reduce any profits should go the right way, but during these extreme times, it is important that you protect your account above all else.

Sit Back and Watch

Sometimes you just need to step back and watch. The markets can be a dangerous place to trade, and knowing when things might be a little too much can be a great trait to have as a trader. Not every situation will merit a trade. In fact, when times are really extreme, it can often be better to simply not trade at all. Why risk what you currently have in order to make a bit more when the conditions are so volatile? Protect what you currently have and sit out the markets this time. You will have plenty of time to make some more profits once things have settled down again. You also need to consider that your trading plan probably didn’t take these extreme conditions into consideration, so you will be kind of trading blind, which is an increased risk in and of itself.

Always Use Stop Losses

When it comes to managing risks, ensuring that you have stop losses in place is vital. You should be using stop losses anyway, as this is an integral part of trading. If you aren’t using them, then you are trading wrong and are putting your account at risk with every single trade. This risk is multiplied tenfold when it comes to volatile conditions. If you are going to be trading during these conditions then you have to have them in place and you have to have them with every single trade that you place. I know we are repeating things, but you should not be placing any trades without a stop loss being in place. Protect your account before you think about making any additional profits.

Monitor the News

Monitor the news. Often, during times of extreme volatility, there is a real-world event that is causing it. This could be something like an economic news release, or it could be a disaster such as an earthquake somewhere in the world. Whatever it is, there will be news about it, and being on top of this and understanding what is going on can give you a big advantage. Normally when there is a lot of volatility, people are jumping in trying to make a quick profit, not really knowing or understanding why the markets are behaving the way that they are. This can be used to your advantage. By understanding what is happening, you are also able to gauge when the sentiment may change, allowing you to trade in that direction and profiting from people trading the current movement. Of course, this comes with risks and you may be potentially trading against the trend. The markets do not always react the way that you would expect, but it can be an advantage to understand what is happening with the news nonetheless.

Diversify Your Portfolio

Something that you probably would have been told at some point is to diversify your portfolio. When it comes to trading forex, this would simply mean that you are trading more than one currency pair. This is a way of helping to protect your account as you are not putting all of your money on a single trade or currency pair. Volatility can of course affect all markets, but it can also be concentrated on certain currencies, meaning that while one pair may be going a little crazy, some of the others may be more stable. This could then mean that you are unable to trade the less volatile pairs while the volatile ones are doing their thing, or it could mean that you can counter some of the risks of the volatile pairs with trades on the more stable ones. Either way, it is good practice to ensure that you are diversifying your portfolio and expanding into more than just the single currency pair.

So those are five of the things that you can do to help you survive the markets when they are going a little crazy with volatility. There are other things that you can do, and your own style of trading will help you to get through it and to better understand what it is that you need to do in order to prevent the risks, but the five things we have mentioned are a good start and are generally relatable for everyone. We wish you the best of luck once the markets start picking up their volatility levels!

Categories
Forex Market

Insane Volatility: Tips for Trading Forex In a Hyper-Active Market

Sometimes currency markets can become extraordinarily volatile. In fact, any market can, depending on what’s been going on. You can be on a good bullish trend, just so a headliner crosses the wires that turn things upside down, causing massive losses. In this article, I will look at the special challenges when it comes to trading in a volatile market.

First Things First: Managing Your Risk

The first thing you need to do is to pay attention to your risk. In that case, it should be the first thing to pay attention to in any business environment. Ultimately, if you do not manage your risk, you will come out of commercial bankruptcy and lose all your capital trading. That’s always gonna be the first thing that comes to mind when you put money into an investment.

If situations continue to become very volatile, then you are considering a situation where protecting your risk becomes even more important, and then you should consider the size of your trade. For me, one of the most effective ways I’ve found to protect capital trading in a volatile situation is to reduce position. In other words, if you normally trade with 0.5 lots, then you may want to trade with 0.25 lots because of the inherent risk in a market that can move very quickly.

Understand that risk managers will also force professional traders to reduce their position. In this sense, professional traders tend to trade with much less leverage than retail traders. It is not uncommon for a professional trader to use leverage 1:6 instead of the 1:200 that many retail traders will use. Part of this is because the trader who trades professionally has an account with a lot of balance, which sometimes has millions of dollars depending on the situation and/or the bank they are working for. When you earn 5%, it means much more in that account than in a 2000 USD trading account in a volatile market.

The Trend Becomes Even More Important

When trading in a volatile market, the general trend becomes much more important. While volatile markets usually indicate some change in trend, the reality is that the long-term trend tends to be what the market is generally set. With this situation, if you are trading in a volatile market, you can want to trade only in the direction of the longer-term trend, which means you should sit on your hands from time to time. I think at this point, it’s probably best to wait for the bigger money to come in and push in the right direction, in addition to keeping your trading position smaller, because of the potential for losses.

Usually, a lot of volatility comes into the hands of fear and possible occasional traders, but when you look at a Forex card, the vast majority of the time the trend is for years. There are times when things come and go drastically, but overall, I think most of these movements end up being value propositions for those who are willing to jump into the fire. That does not mean that it should do so vigorously, it only means that the long-term trend remains largely valid. However, it must have a “line in the sand” when it comes to the longer-term trend and recognizes that a breakdown below or above that line represents a change.

Once the long-term trend changes, the overall strategy changes when it comes to transactions, but this as a rule should be something based on monthly graphs. Knowing that this could cause a lot of short-term pain, the truth is that over time the long-term trend is reaffirmed most of the time.

Sometimes It’s Best to Stay Out of It

Unless there is some kind of important geopolitical or global event, the reality is that you can almost always find a pair for trading that is much less volatile. Ultimately, many traders marry a particular pair of currencies, without understanding that they all operate the same. In other words, if you are normally a trader of the EUR/USD pair, then perhaps you should look in another market if you have become too volatile. Exactly what prevents you from changing the pair and starting to use the EUR/CHF pair? Just stay away from the too volatile currency pair, because it’s not worth it. At the end of the day, he’s simply trying to make a profit, not become a genius in a particular currency.

Higher Frames of Time

Another thing you can do when things get a little volatile is simply going to higher time frames, which will naturally make you reduce the size of your position. For example, you can usually change the graph per hour and risk something like an average of 50 pips. However, if you are forced to exchange the daily graph, you probably have to risk 100 pips on average. Despite everything, you still want to risk the same amount of money for each trade, so it is advisable to start with a smaller position for the market to work its magic over time. This will force you to focus on a more general overview and pay attention to the overall market attitude rather than the everyday noise.

Turn Off the News

You should be careful when paying too much attention to headlines, as they don’t matter. What matters is where prices go, not what a politician says in Brussels, says Donald Trump, or no one else. The markets are true, and the truth can be found in the prices. Beyond that, when things become too volatile, the analysis is much more likely to be deficient, as even the best analysis of the world can be of very little use after a few hours. You should look at the big picture in these situations and just relax.

Categories
Forex Indicators

The ATR Indicator and Volatility in Trading

Have you ever considered how to use volatility in your trading? How to apply some filters according to their behavior? The ATR indicator can help you with this. In this article you will be able to show you a lot of information about the Average True Range (ATR), an indicator unfairly forgotten in trading systems.

Index
  • What are technical indicators and how can I use them?
  • What is the ATR?
  • How did ATR come about?
  • How to calculate the ATR – Average True Range
  • Find true range (True range)
  • Calculation of the ATR indicator
  • Graphic representation of the Average True Range
  • Uses of ATR
  • More frequent strategies using ATR
  • Momentum strategies
  • Böllinger bands
  • Supports and resistors
  • Conclusion
What are technical indicators and how can I use them?

The technical indicators, among those found in Average True Range (ATR) is based on a series of calculations on price action (some also on volume). I am sorry to say that the use of technical indicators does not always work. But they can be useful tools for detecting patterns of market entry and exit.

There are a number of technical indicators that have been developed, some show us when the market enters an overbought or oversold situation, others show us when a trend can be exhausted, if a movement is reliable and how much travel it can have.

The ATC shows us the volatility in a market, as well as its variations.

What is the ATR?

ATR stands for the name of this technical indicator: Average True Range. This indicator was developed by J. Welles Wilder. It is no more than an average of the price ranges (in fact, its name in Spanish corresponds to the average of the true range). A true range is the measure of volatility that can exist between two successive time periods (for example, two stock market sessions, two weeks, two hours, etc.).

To the point, it is a technical indicator of volatility. Volatility shows the strength they have, have had and can have (based on estimates) price movements. This can be useful both to calculate the risk and to filter market entries and exits (later we will delve into the importance of all this for our trading). The ATC simply reflects the periods in which the market has behaved more violently (is more volatile) and whether volatility increases or decreases.

How did ATR come about?

Wilder, the creator of this and other technical indicators (such as the Relative Strength Index; RSI or the Parabolic SAR, among others), was a commodity market operator. This trader used financial futures for its operations. Futures are leveraged instruments (like trading with Forex and CFDs) and are therefore very sensitive to strong price movements. For this reason, he discovered that it would be useful to have a tool that would allow him to know the range in which the market can move in a day.

However, it may be that the market opens at a different price than the previous session (what is known as a gap or gap) and does not move much further during the present day. In this case, the behavior in a day is not very volatile, but if we take into account the variation with respect to the previous closure, in fact, there may have been volatility.

For this reason, Wilder developed a calculation formula that allowed not only to see the volatility of a single day but in contrast to the previous day. Similarly, by averaging this calculation, you can observe how volatility in the market evolves over a period of time. His idea, which remains in force, was that after a period of high volatility he was continued from a period of low volatility; and vice versa.

All the technical indicators developed by J. Welles Wilder can be found in his book “News Concepts in Technical Trading Systems” (1978).

How to calculate the ATR – Average True Range

Like all other technical indicators, the Average True Range (ATR) is based on calculations of past price movements. To calculate this volatility indicator we must start from the True Range of the current period (True Range). The periods to be taken as the basis for the calculation (i.e., the number of immediately preceding sails or rods taken into account) must also be configured.

As a general rule, the period used is 14 (can be daily, weekly or monthly periods). Wilder, its creator, used this value for its development (in addition, on a daily basis). However, there are traders who use a very different trade from the father of the ATR and for this reason, the period is configurable.

Find true range (True range)

As I mentioned before, the ATR indicator is only an average of the true range calculated over the periods indicated. It is taken as a value to define the range (True Range), the highest value of these three:

  • The maximum price for the current period – minimum price for the current period.
  • The maximum price for the current period – closure of the previous period.
  • Previous period closure – the minimum price for the current period.

The difference between prices (in other words, the range of movement they have had) shows whether the market has been more or less volatile. The higher the range means the more volatility there has been.

Thus, the true range includes gaps that may arise in a market. This price difference, by taking the stock exchange session, better reflects the strength of the swings and helps us measure volatility in a more reliable way. As a last point, when creating an average on these values, we can observe the volatility changes. In other words, whether it goes up or down.

Calculation of the ATR indicator

The formula for calculating the ATR indicator is as follows:

ATR= [(previous ATR * n-1) + True range of the current period]/n

Wherein is the current period.

In any case, the default configuration of the ATR, which Wilder left us, was done over a period of 14 days. As discussed above, periods are taken on a daily basis (i.e., to calculate the ATR we take the price movements from the previous 14 sessions).

Thus, the original ATR would read as follows:

ATR= [(ATR previous period *13) + True range of current period] /14

Although this is the formula that its creator used to operate in the commodity market and know its volatility, the ATR can be configured according to the market, your trading style (scalping, swing, etc.), or strategy that you can use.

Graphic representation of the Average True Range

To make it easier to use the ATR indicator, it is graphically displayed at the bottom of our quotation chart (although there are platforms that allow you to place it at the top). The vast majority of trading platforms have this indicator and you just have to select it in the corresponding section and insert it. They also allow configuring of the number of periods on which we want to do the calculation. The ATR is represented by a linear graph, in which you can see the peaks and valleys of volatility. Increases and decreases in value are seen at a glance.

Uses of ATR

ATR has different uses in our trading. It can be useful both in designing strategies and in calibrating risk. As I mentioned at the beginning of this article is one of the most useful technical indicators, but, curiously, the least used.

Some of the uses we can give the Average True Range (ATR) are:

To calculate the size of the position in our trading account: dividing our risk according to the existing volatility (taken as a multiple of the ATR), we are in a position to limit the size of our trade.

Define the stop loss level: this is one of the most widespread uses of the ATR indicator. Sometimes you don’t know if the stop-loss order is too close to the price. Volatility can give you the answer. Knowing the violence with which the financial asset can move, we can calculate a safety margin to place our stop.

Set profit targets: just as we can limit risk based on the potential range of price movements. The ATR indicator will be useful to determine how far a movement has traveled. This way we will have an idea of what we can gain with an operation and set our take profit order.

To create strategies based on breaks: when the price goes through a trend, a channel, support or resistance, we must ask ourselves is this break reliable? If the price breaks with force, that is, with an increase in volatility, the break is more likely to be valid.

Select assets to trade: with the ATR you can create a filter to select which assets to trade on. You may want to exclude those in which volatility has been low and an explosion in price is expected. Assets that have excessive or very low volatility can also be discarded. To be able to compare the volatility of the assets, you just have to divide the ATR by its price and get a percentage (multiply it by 100).

More frequent strategies using ATR

Another of the most common uses of ATR is to use it as a criterion or filter within our trading system. For example, we can define that market entries occur “when volatility is greater than… (Usually a multiple of the ATR is taken).

Momentum Strategies

The ATC may indicate a change in the direction of prices. Bullish trends tend to occur in a less volatile way than market declines. If it is applied in an uptrend (in the long run) and there is an increase in volatility, it is possible that there will be a possible increase in panic and, therefore, a change in the direction of prices. Similarly, it is possible to exploit a bearish trend that is ending if we observe a decrease in volatility.

Böllinger Bands

A trading system could be, for example, combining the ATR with Böllinger Bands. If the price reaches the upper band and there is an increase in volatility, it is possible that we are facing a variation.

On the contrary, given that price falls occur with greater volatility, when the price reaches the bottom band and there is a decrease in the price, it could be interpreted as the end of the decline. As always this should be seen through a backtest. But I can tell you already that some of my strategies use ATR as an entry and exit criterion.

Supports and Resistors

This strategy has been outlined above when discussing the uses of ATR. However, it should be recalled that a strong price movement is more reliable as it better reflects market sentiment. The ruptures of supports and resistances must be validated and this indicator can help us to confirm it.

Conclusion

As you will have seen, the ATR (Average True Range) is a complete technical indicator that can be useful to exploit inefficiencies or improve your trading systems. Volatility is one of the most important aspects of the market and should be taken into account in your strategies. The ATR indicator can be incorporated into other systems and strategies. But it can also be an important element in determining risk and establishing proper risk management.

Categories
Forex Course Forex Daily Topic

150. The Easiest Way To Measure Market Volatility

Introduction

Measuring volatility enables traders to accurately identifying the significant trading opportunities in the currency pairs. An increase in the volatility of a currency pair occurs due to any of the major changes in the economy of that country. Market volatility measures the overall price fluctuations over a specific period, and this information is used to identify the potential breakouts.

In the Forex market, the higher the volatility, the riskier is the currency pair to trade. A higher volatility means that the asset value can be spread out over a larger range of values. A lower volatility means that an asset does not fluctuate dramatically and tends to be more steady. A few indicators help us in measuring the volatility of the currency. Using these indicators will show us the accurate representation of the market’s volatility when looking for trading opportunities.

Bollinger Bands

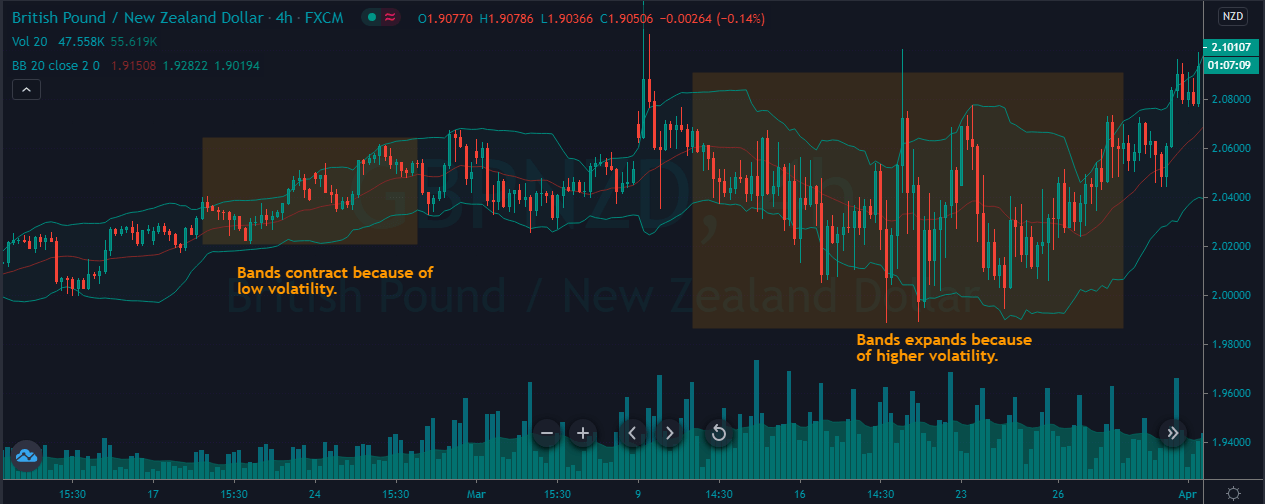
We have discussed a lot about Bollinger Bands in our previous course lessons. This indicator is specially designed to measure the volatility of an asset. In this case, any currency pair in the Forex market. This indicator consists of two lines (bands) plotted above and below the middle line, a moving average. The volatility representation is based on the standard deviation, which changes as an asset’s volatility increases and decreases. Both these bands contract and expand according to market volatility. When the bands’ contract, it tells us that the volatility is low, and when the bands widen, it represents an increase in volatility.

Moving Average

Moving Average is the most common indicator used by traders across the globe. It measures the average amount of market movement over a specific period. If we set the moving average to 30 periods, it shows us the last 30 days’ average movement. In short, any Moving average tells us the average price movement over a specific period. If the MA line is above the actual price, that implies the market is in a downtrend and vice versa.

Average True Range (ATR)

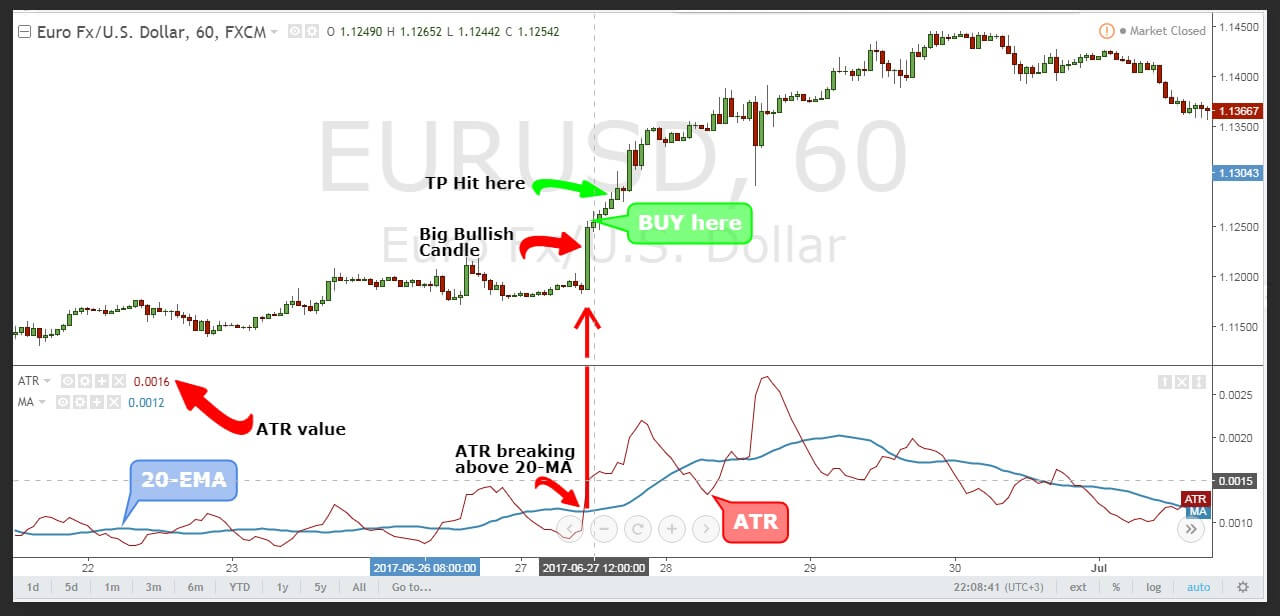
The ATR (Average True Range) is another reliable indicator used to measure market volatility. This indicator takes the currency price range, which is the distance between the high and low in the time frame, and then plots that measurement as a moving average.

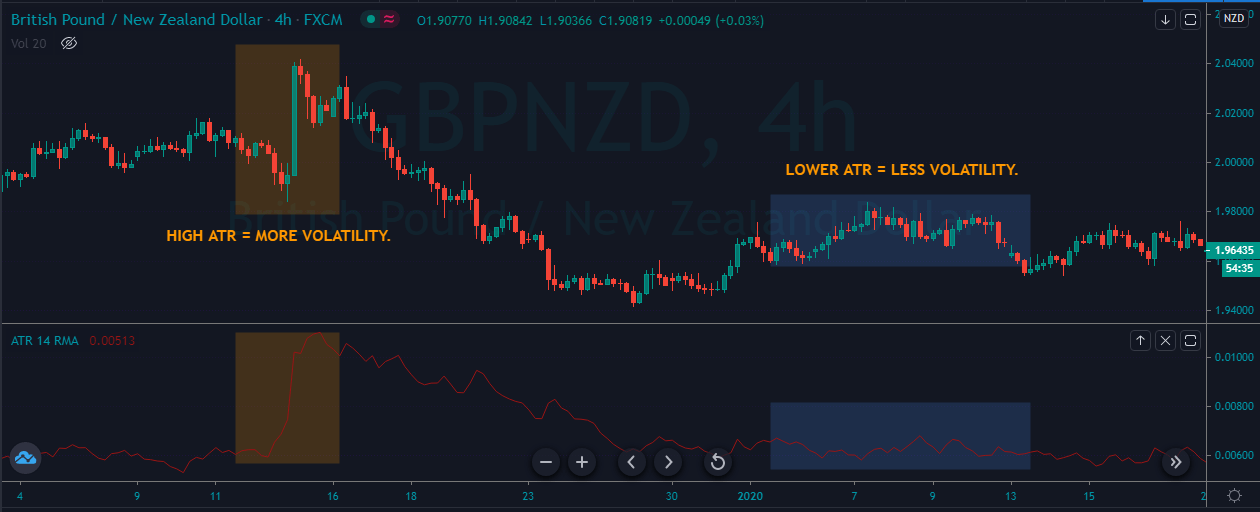
If we set the ATR to 40 range, it will tell us the average trading range of the last 40 days. The lower the ATR reading means, the volatility is falling, and we can expect fewer trades. On the other hand, the higher the volatility means the ATR reading is rising. It is an indication that the volatility is on the rise, and by using any directional indicator, we can gauge the potential trading opportunities.

These are the three best tools you need in your arsenal to measure the market’s volatility accurately. Make sure to take the below quiz before you go. Cheers!

[wp_quiz id=”92111″]
Categories
Forex Basic Strategies

The Most Simple Yet Effective Scalping Strategies You Must Know In 2020

Introduction

The Forex market consists of are several types of traders. They are broadly classified based on the time frame traded. For example, swing traders use time frames like 1H or 4H, while positional traders analyze the 1D or 1W time frame. Similarly, there are “scalpers” who trade the 1-minute and the 5-minute time frames. Note that scalpers are different from day traders, as they do not consider the 15-minute or 1H time frame for their analysis.

What is Scalping in Forex?

Scalping is a type of real-time technical analysis, where traders make several trades in a small period. Scalping involves entering and exiting from the market within a few minutes and moving on with the subsequent trade. This type of traders aims for tiny profits rather than home runs.

Scalping is usually most popular among forex traders than those trading stocks and commodities. This is because the FX market is the most liquid and volatile market. Thus, traders make use of this benefit by extracting 10-20 from the market in a short time. Since scalping involves making of few pips on a trade, they are traded with big volumes.

Getting Started with Scalping in Forex

Now that we know the basics of Forex scalping, let’s discuss the analytical side of it and then understand some powerful scalping strategies as well.

Timeframe

The ideal time frame to the scalp is either 1-min or 5-mins. However, some traders get an outlook from the 15-min time frame too.

Take Profit and Stop Loss

The most critical part of scalping is to have a take profit and stop loss on every trade. Since you will be using the 1-min time frame, the profit or loss level should be within 5-10 pips. It is risky to keep the TP and SL greater than ten pips when the analysis is based on the 1-min time frame.

Volatility and Liquid

Volatility and liquidity are other vital points of consideration before scalping any market. Forex is indeed the best market to the scalp as it offers the needed volatility and liquidity. However, you must select the right pair to trade because not all currency pairs offer enough market volatility. There are pairs that barely move on the 1-min time frame, and thus traders must end up waiting several minutes on a trade. Hence, it is recommended to trade only major pairs and a few minor pairs.

Spread

Spread plays a major role in scalping as it greatly affects the P/L of the trade. For instance, let’s say the spread on EUR/USD is two pips. The pip value of the pair is $10. If one lot is traded, the expense of the trade would be $20. Now, if a trade yields you four pips, then the net profit would be $40 – $20 = $20. We infer that 50% of the profit gets deducted as a fee. Thus, scalpers always have an eye on the spread.

Forex Scalping Strategies

Scalping strategies are unlike strategies used by swing and positional traders. Scalpers do not wait for several confirmations before entering a trade. Instead, they aggressively enter after a couple of confirmations. Here are some scalping strategies made for non-conservative traders.

Scalping using Moving Average

This scalping strategy, two moving averages – the 5-period MA and the 20-period MA is used applied onto the 3-min charts. Let us understand the strategy with a couple of examples.

Firstly, we must have a look at the overall direction of the market. Note that this strategy is only for trending markets, not ranging markets. In the below chart of AUD/USD on the 3-minute time frame, we see that the market is in a clear downtrend.

Secondly, the five period MA must be below the 20-period MA. When the price action tries to break above five-period MA (yet below the 20-period MA) and falls back into MA, we can open short positions.

The stop-loss must be placed above the high of the candle that broke below five-period MA. One must exit the trade when the price reaches up to 1:1 risk-reward or at a profit of 5 pips.

Scalping using price-volume charts

Indicators are not a must to scalp in forex. Scalping is possible solely using price action concepts. And here is a strategy for the same. This strategy works on a small time frame used on any currency pair. However, we’ll be sticking to the 3-min time frame for all the strategies.

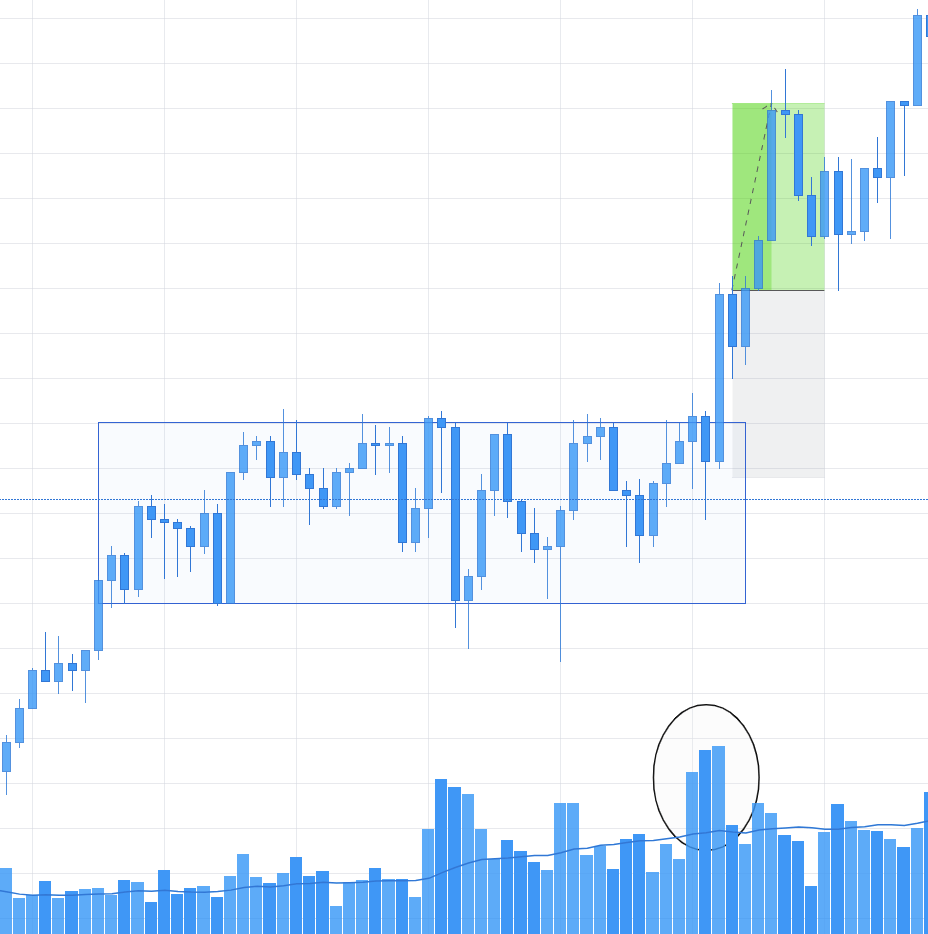
Below is the chart of AUD/USD on the 3-minute time frame. According to the strategy, we can take entry when the market breakthrough a range strongly with high volume. In the below example, we see that the price fiercely broke above the range with high volume too. This is a confirmation that the big buyer is back into the market. Thus, we can take a long position right after the candle closes above the range.

The stop-loss can be placed below the low of the candle that broke through the range and places the take profit at a 1RR ratio. Note that, the stop-loss and take profit must exceed above 10-12 pips.

Scalping using Support and Resistance

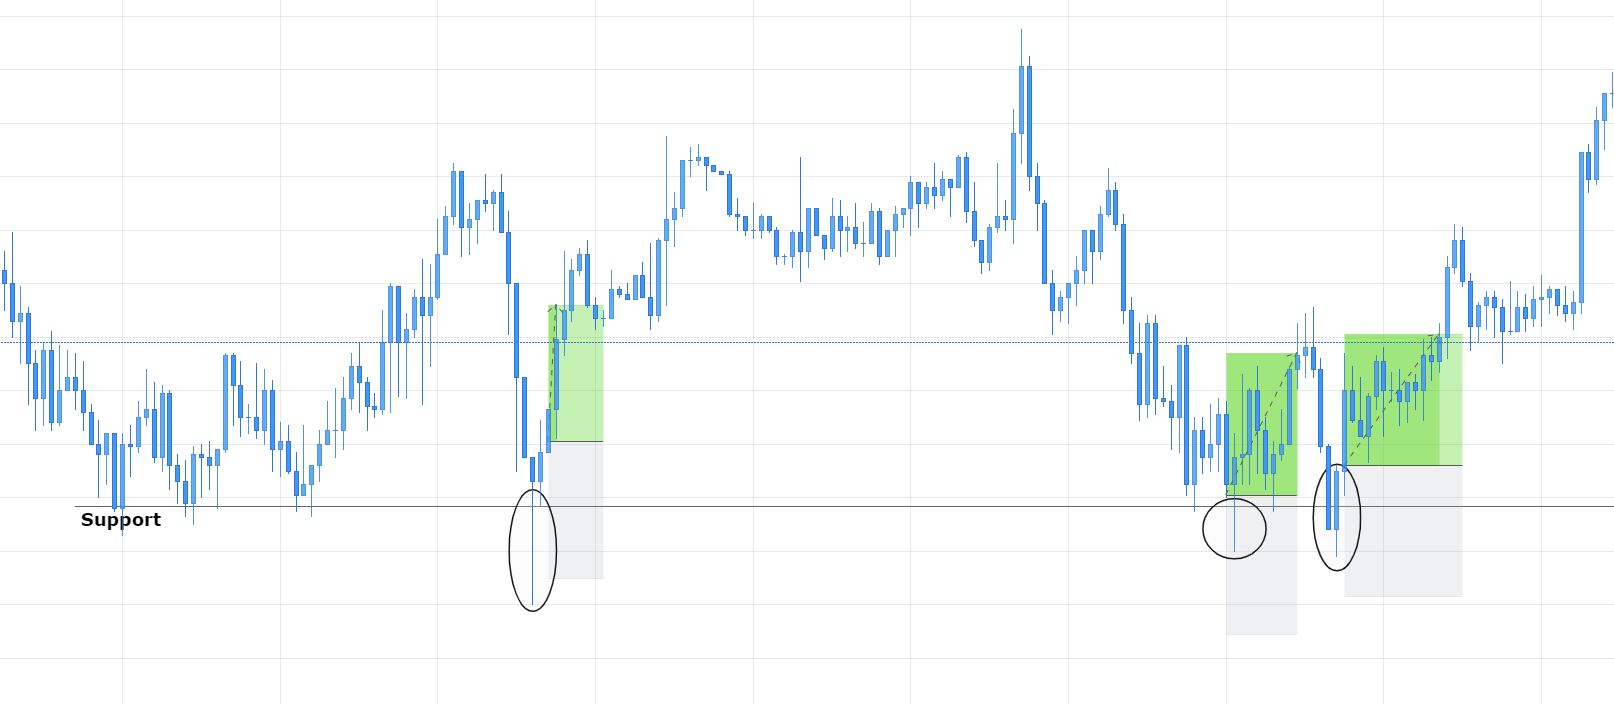
Scalping at support and resistance levels is the most popular technique in the forex industry. Yet most traders apply it illogically. Even though the textbook says to buy at the support and sell at resistance, it cannot be applied practically incorporated in the market as there is a pinch of psychology in it. According to this strategy, one must buy at support and sell at resistance only if there is a false breakout prior to it.

Consider the below chart of NZD/CAD on the 3-minute time frame. The gray ray represents the support level. It is seen that the price broke below the support thrice and came right back above it. Thus, one can enter when the price is holding above the resistance post the fake-out. The stop-loss and take-profit for all such trades much be a maximum of 5 pips.

We hope you found these strategies interesting and helpful. If you are an aggressive trader, do try them out and let us know the results in the comment section below.

Categories
Cryptocurrencies

What are Pegged Cryptocurrencies? 

The violent price swings witnessed in the crypto market is part of the reason why virtual currencies haven’t found favor in the public’s eye. While the volatility can result in quick gains, unexpected losses are also inevitable. This explains why digital currencies are more speculative investments than a store of value. It’s even harder for merchants to accept cryptocurrencies as payment due to their dynamic prices. 

However, the recent entry of pegged cryptocurrencies is proving to be a solution to the crypto market’s volatility. In fact, they have the potential to win more investors into the virtual currency space, making digital assets acceptable across the world. But what exactly is a pegged cryptocurrency? 

Pegged Cryptocurrency Overview 

Pegging is a financial concept whereby an unstable asset is tied to a more stable asset to mitigate volatility. 

Similarly, when a digital currency’s value is tied to that of some other medium of exchange, it is said to be pegged. Usually, the coin is tied to a stable fiat currency such as the US dollar, gold, or any other bank-issued currency. Tether is an ideal example of a pegged cryptocurrency whose value is tied to the US dollar. 

In addition to being an alternative store of value, pegged cryptocurrencies help compliment the typical cryptocurrency trading.

If, for instance, you made huge gains from trading volatile cryptocurrencies but fear that the gains might evaporate soon, you can safeguard your gains by trading them for Tether tokens, usually denoted as USDT. This way, even if the dollar loses its value, the price decline won’t be as huge as that experienced in the digital currency market. 

Also, in a bearish market, pegged cryptocurrencies can be used to increase the number of tokens/coins in your portfolio. This is especially true because a pegged currency’s value isn’t affected when the market dips. But since it’s still available in the crypto market and has not been exchanged into fiat currency, you can leverage on the dip by making more purchases to increase your coin/token holdings. 

How Crypto Pegging Works

Cryptocurrency developers wishing to peg their tokens to a stable asset must at all times have the actual asset in reserve as proof of pegging. This is to say that if a cryptocurrency is backed by gold or the US dollar, the project developers should have vast amounts of gold/dollars in vaults to guarantee the pegged value of their tokens. 

In the case of Tether, each token of the coin is tied to the value of one US dollar. Should the coin fail for some reason, investors can then go to developers to claim a refund that is proportional to the number of tokens that they held.

Benefits of Pegged Cryptocurrencies

There is more to pegged cryptocurrencies than just being an alternative hedge against market volatility. 

  • Improved Liquidity 

Compared to typical cryptocurrencies, pegged tokens can be liquidated easily and faster. This is especially true for coins pegged to a fiat currency. They serve as a liquidity vent through which other digital currencies can be swapped for more stable assets. 

  • Offer Affordable Remittance Transaction Cost

Sending remittances overseas is characterized by high transaction costs. If you are sending the funds in the form of digital currency, for instance, Bitcoin, the process is overly slow and sometimes expensive. It becomes even more expensive when you factor in the volatility of the coin, which may result in the recipient receiving less than the amount expected. At the same time, sending fiat currencies overseas has its own challenges, such as an amount limit which you can send at any given time, as well as accumulating transaction costs. 

Pegged cryptos, on the other hand, offer the best of both worlds. First, they are less affected by the market movements, which helps minimize transaction fees. Also, since they are virtual currencies by nature, they aren’t affected by remittance transfer limits.

As such, they can be transferred to various jurisdictions in an affordable process compared to money transfers. Once you consider the foreign exchange-swapping hurdles that plague fiat currency transfers, it becomes even clearer as to why pegged cryptocurrencies are the most viable option. 

Risks Associated with Pegged Cryptocurrencies

One of the biggest risks associated with pegged cryptocurrencies is investors can never be sure if a coin is backed up by real funds. For this reason, before investing in a pegged cryptocurrency, note that it is not enough for a developer to simply claim that their coin is pegged. They must be transparent with their reserves by providing physical proof that the backup funds are available. Ideally, the developers should be open to third-party audits of their financials to verify that indeed the coin is backed up by a stable medium of exchange. 

Also, the fact that a coin is backed up by physical funds stored in large amounts is a problem in itself. It means that the funds are prone to theft and can even disappear for some other reason, causing a decline in the token’s value. Such cases mainly affect gold-pegged cryptocurrencies. Therefore, investors should examine the credibility of who stores the gold of a particular coin and where it is housed. 

For coins pegged to a fiat currency, the government doesn’t take kindly to developers linking a product to the value of a central bank currency. To successfully peg their currency, the developers are required to obtain the necessary paperwork and license as well as maintain a public record of their holdings. So, be sure to check the whitepaper of a pegged crypto to ascertain whether it maintains compliance. 

At the same time, it is pretty hard to make profits from a pegged cryptocurrency. This is because the buying and selling price of the digital coin has the same value as that of the fiat currency. It’s probably the reason why developers fail to convince investors to store their assets in digital tokens instead of fiat currency. 

Conclusion

Unfortunately, there have been only a handful of successful pegged cryptocurrencies in the market. Nonetheless, it’s undeniable that they play a vital role in bridging the gap between the crypto-space and the traditional economy. With time, as more developers continue to launch pegged cryptos, their role will be appreciated and eventually bring in more investors in the market.