Categories
Forex Basic Strategies

Trading the Forex Market Without Using the Stop-Loss Order

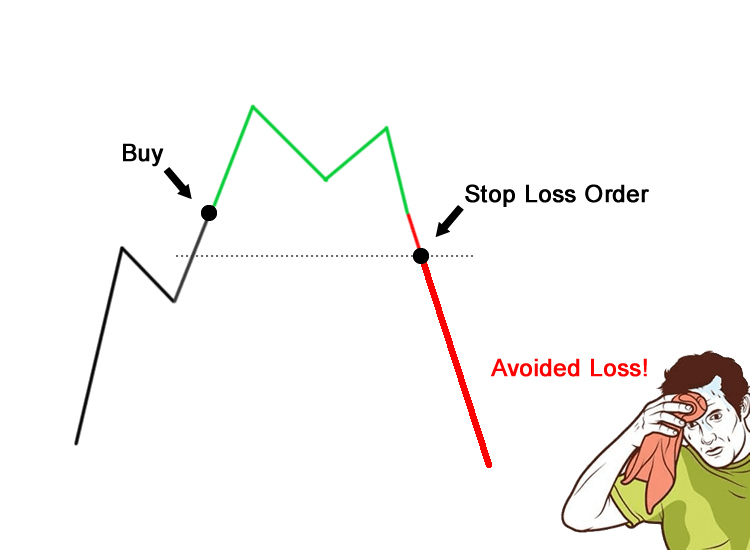
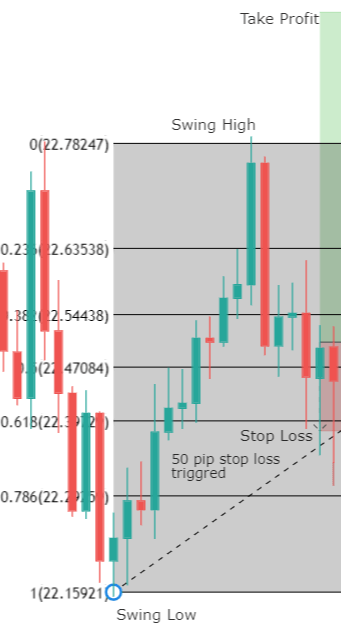
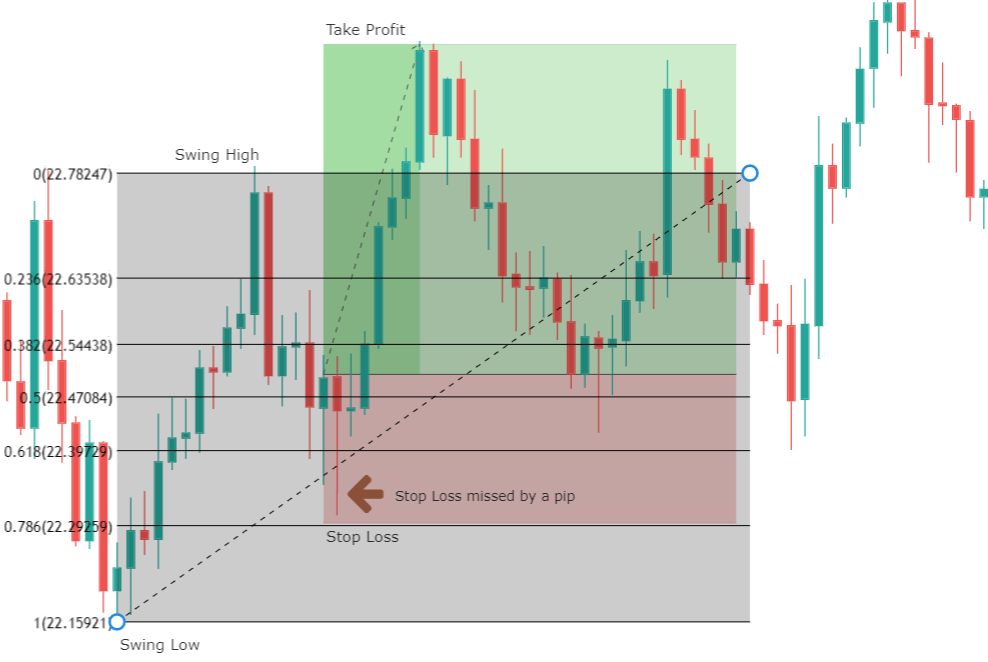
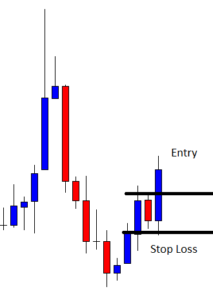
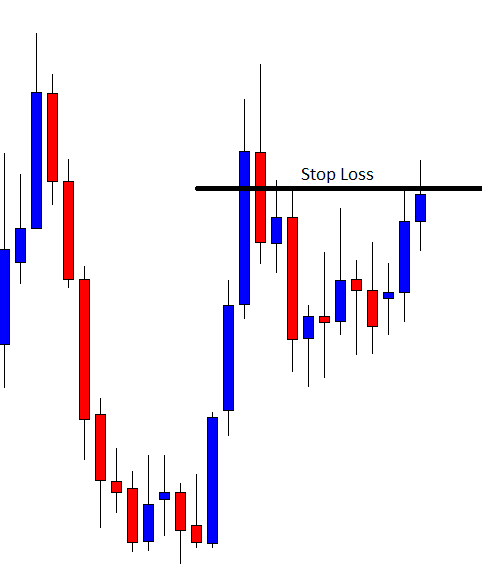
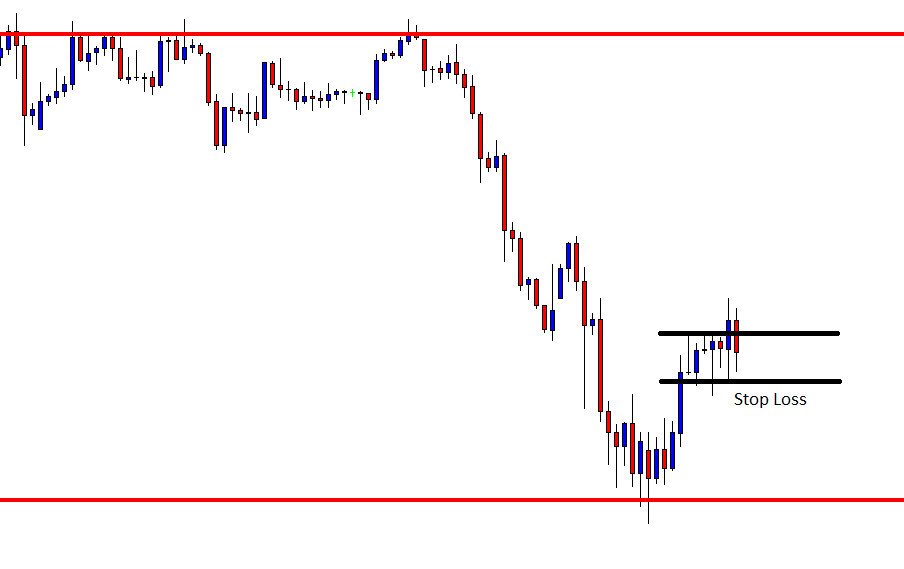
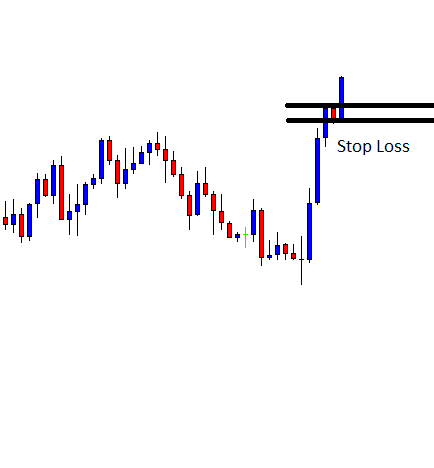
A stop loss is an order placed by a trader on any underlying asset, the order remains until the price action reaches that specific point, then it automatically executes a buy or sell order in the market. Trading the markets without a stop loss is dangerous. However, by placing the stop loss, traders can easily eliminate the emotions from their trading decisions. In your trading carrier, you will often hear about the traders who never use the stop-loss orders, and they continually make money in the market. They rely on the no-stop loss forex trading strategy, and some of the traders succeed, and some don’t. The traders who win consistently in the markets are emotionally intelligent; also, they spent an endless amount of hours on demo trading to master the strategy well. Another most critical skill they learn is Accurate Thinking, and they don’t see things the way they are, they see things the way things are.

Not Using The Stop Loss Have Some Advantages In The Market

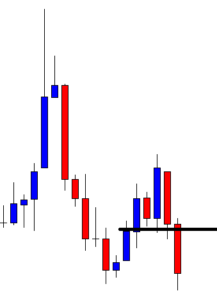
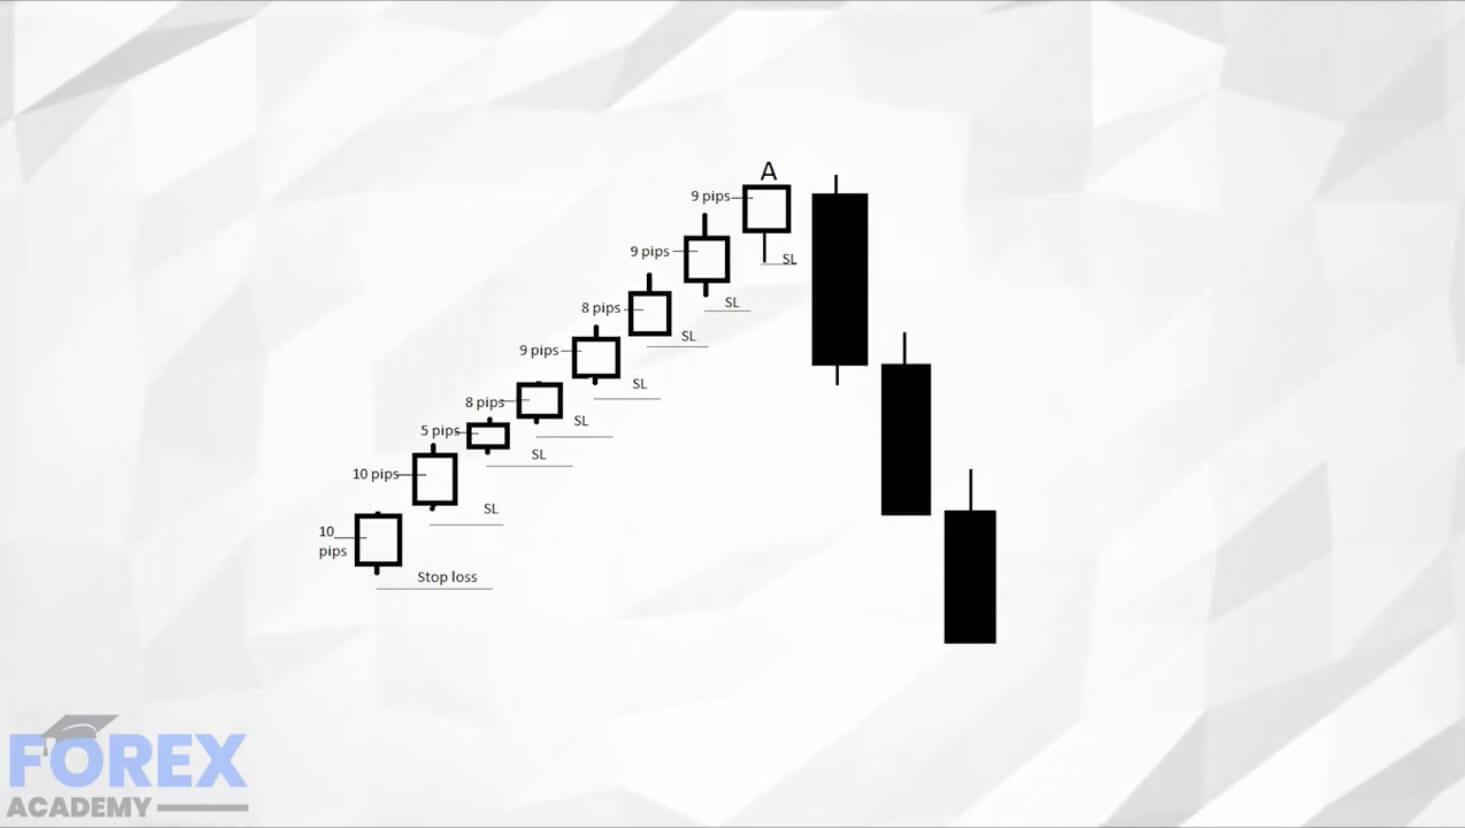
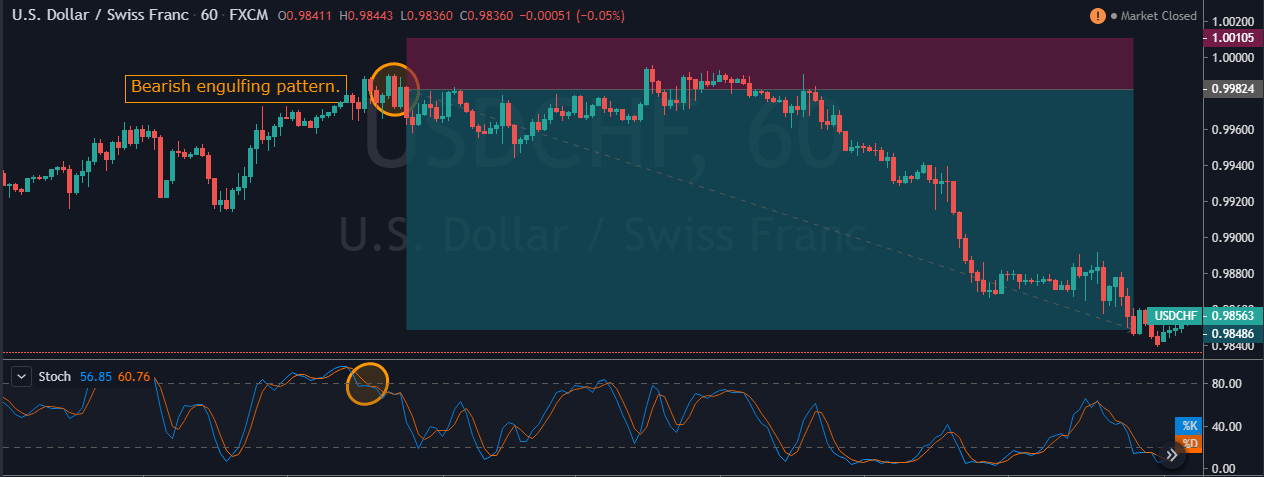
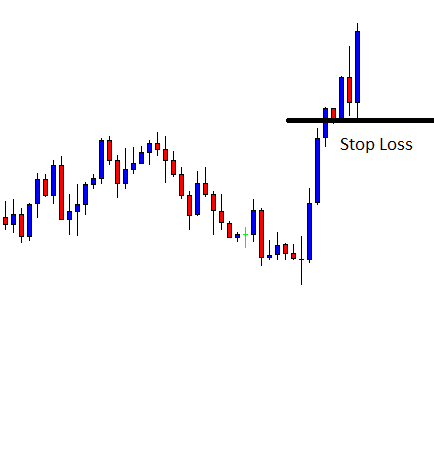
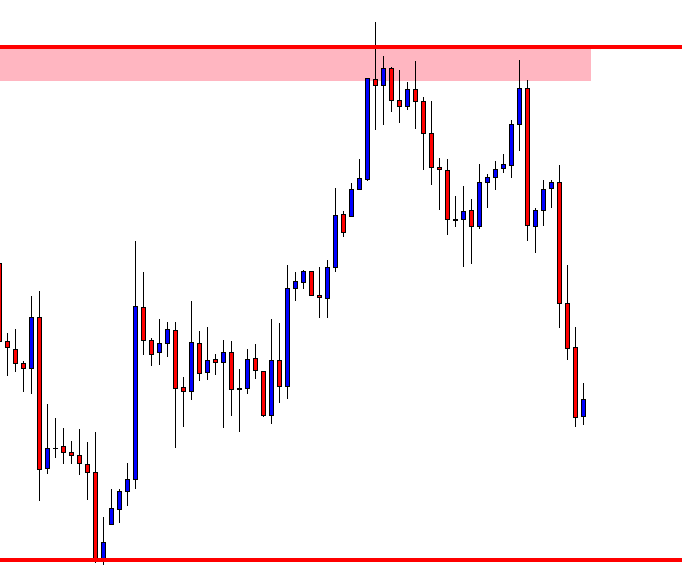
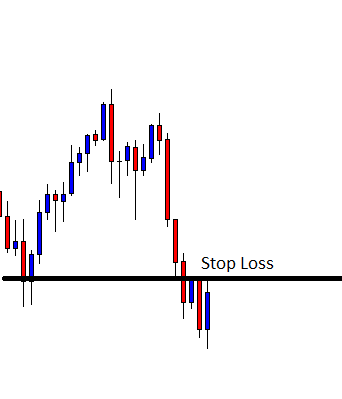
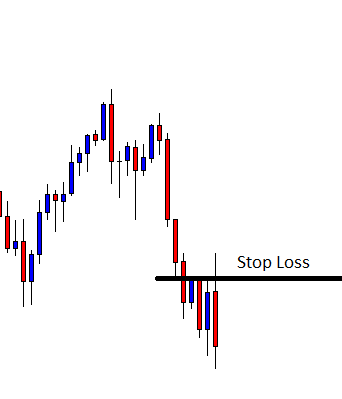
In dead markets hours when none of the trading sessions is active, at that time, most of the forex brokers wider their spreads so that they can avoid the scalpers to move the market. In that time, if your strategy gives you the trading opportunity, a widening spread can easily trigger your stop loss. During the opening hours or the high political news events, markets are quite volatile, which sometimes prints unexpected spikes in the market that ends up closing your positions and markets happily moving in the directions you predicted.

No Stop-Loss Trading Strategy

Keep in mind that trading without the stop loss is only applicable for intraday trading only, and it is advisable that use this strategy only on the lower timeframes because markets are random and it’s risky to let your positions to run overnight in the market. Like a gambler, you need to keep watching your trades until your trades hit the take profit. If you are beginner traders, then we don’t recommend you to use this strategy to trade in the live market, first of all, spend two to three months on the demo account to master this strategy and then give it a try on live markets.

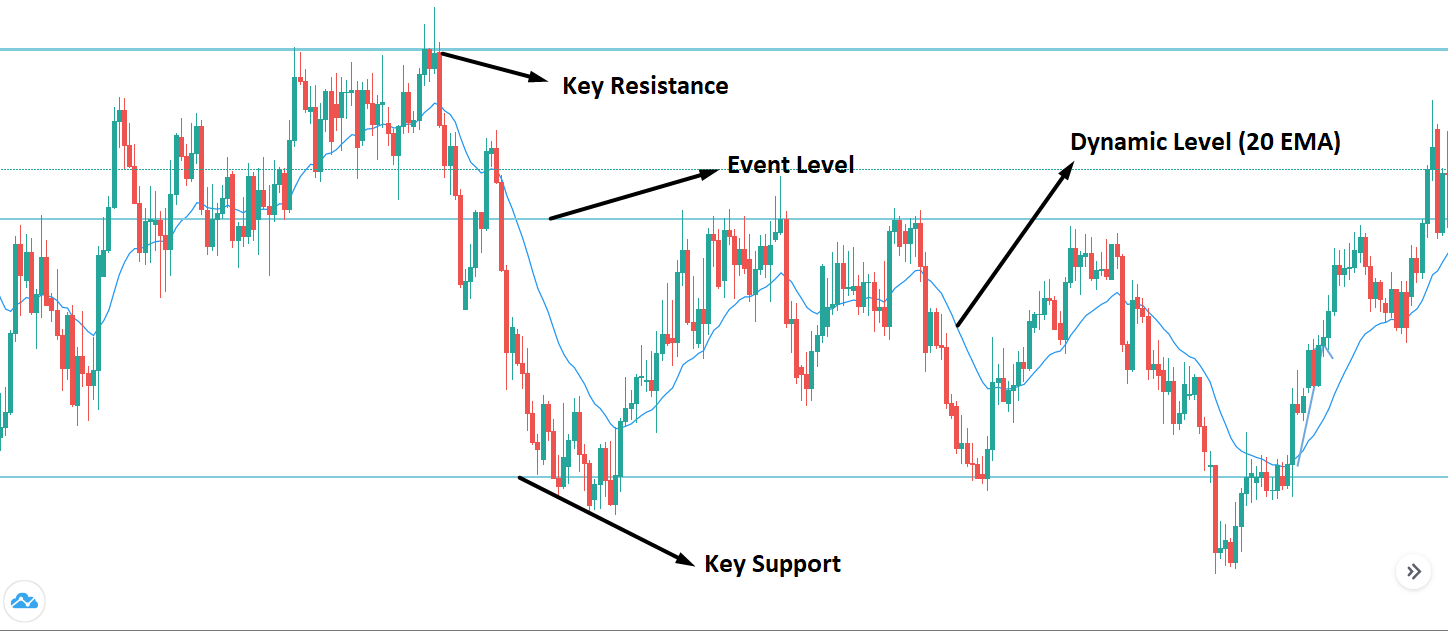
Trading The Markets With The Moving Average

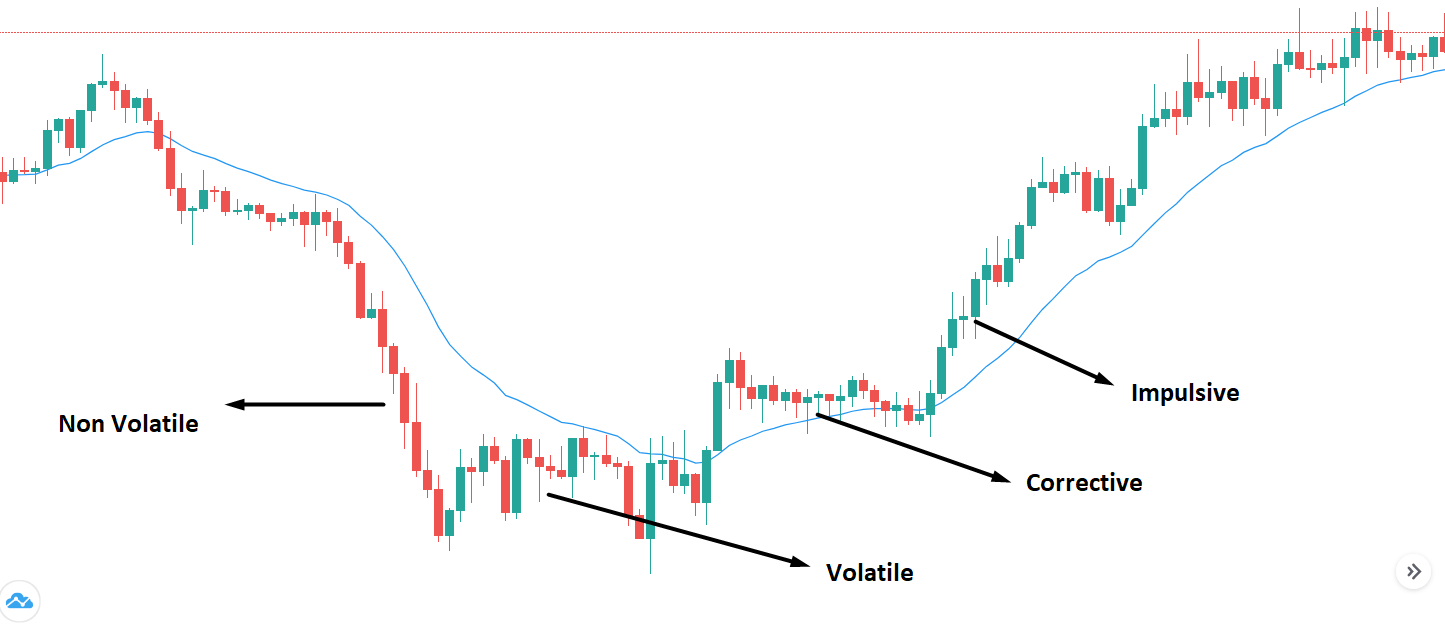
From beginners to advanced to chartists to market movers, everyone uses the moving average once in their lifetime. Even chartists and professional traders use this indicator in their everyday market analysis. Moving average defines the current market trend, spot trend reversals; also, it indicates the buy and sell signals. When the indicator is above the price action, it means that the trend is down, and then the indicator goes below the price action, which shows that the trend is up. Many traders and chartists use some other form of technical analysis in conjunction with the moving average to identify the trading signals. You can pair it with other indicators; also, you can use the higher period average with the lower period average to find the best entries. This strategy only works in the trending market, and we suggest you avoid using it in the dead, volatile, and consolidation phases.

Buying Rules

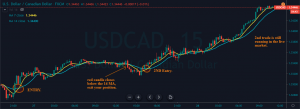
  1. In an uptrend, go long when the 7 MA crosses the 14 MA to the upside.
  2. Exit your position when the red candle closes below the 14period MA.
  3. No need to place the stop loss.

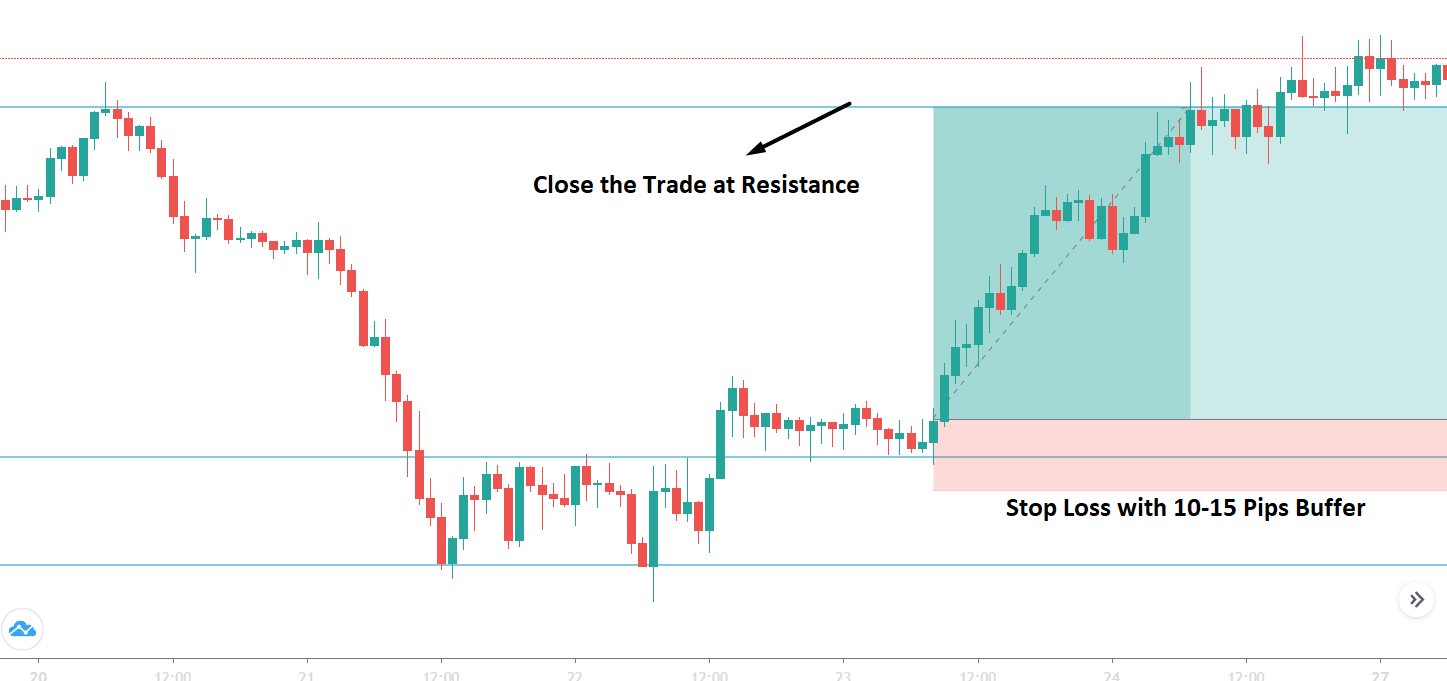
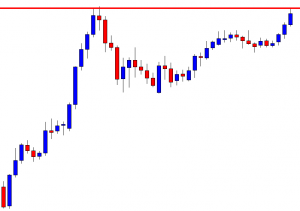
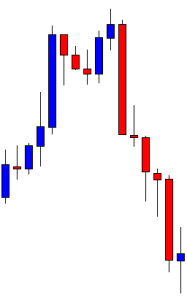
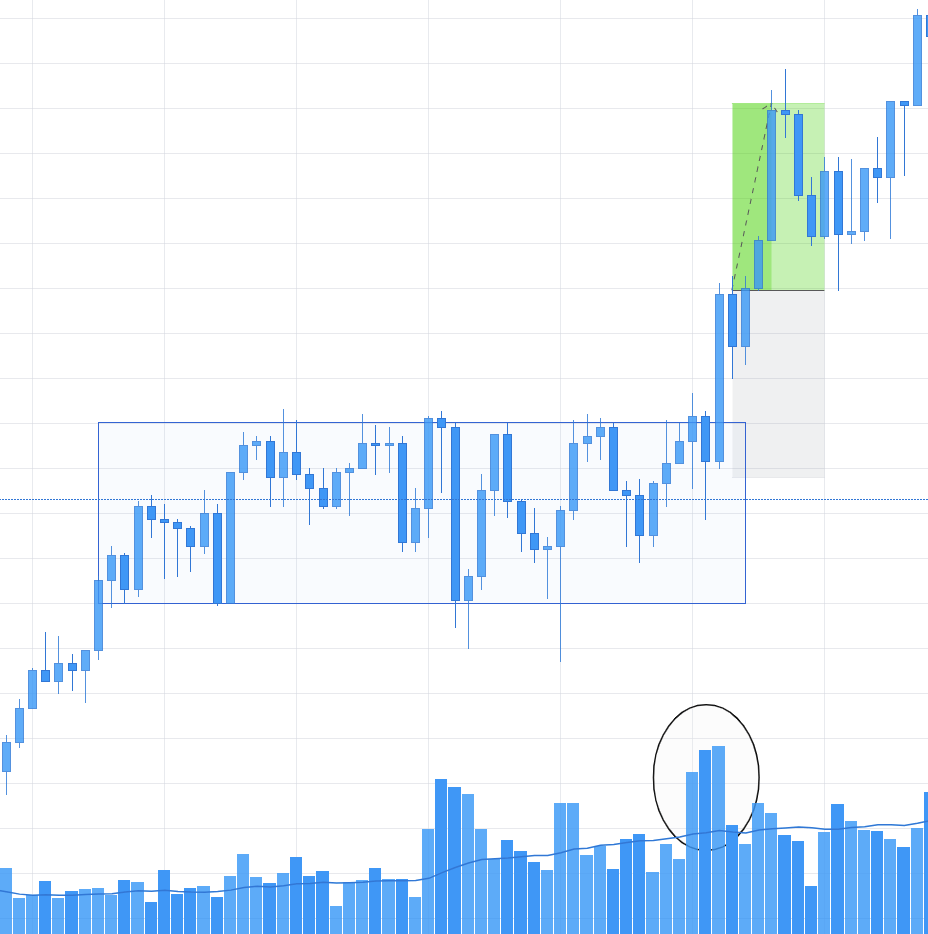
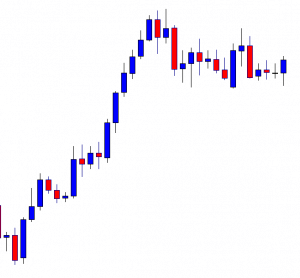
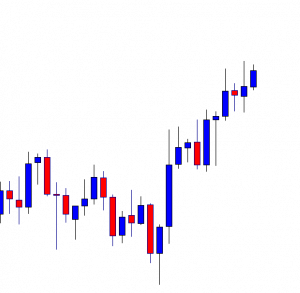
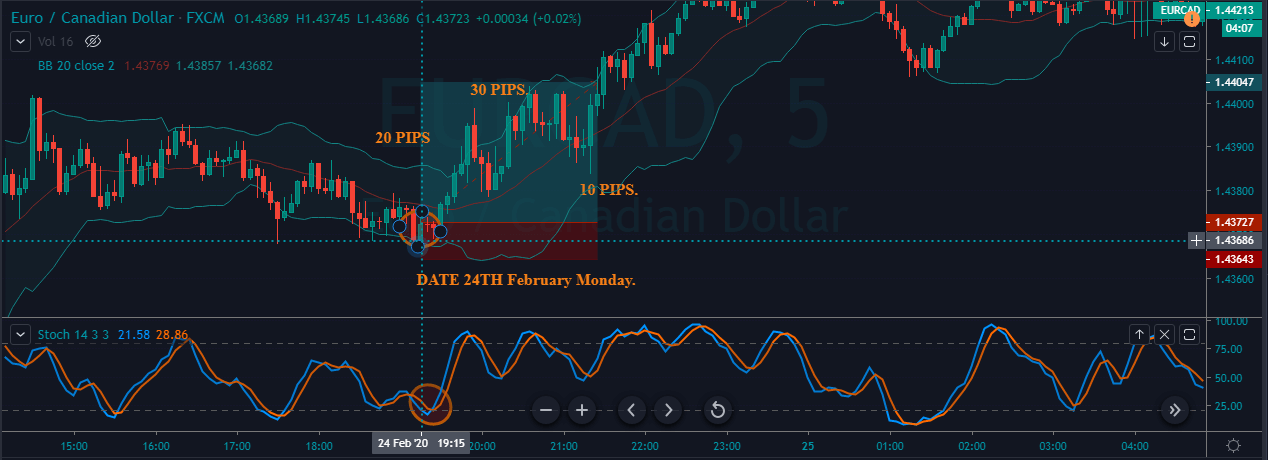
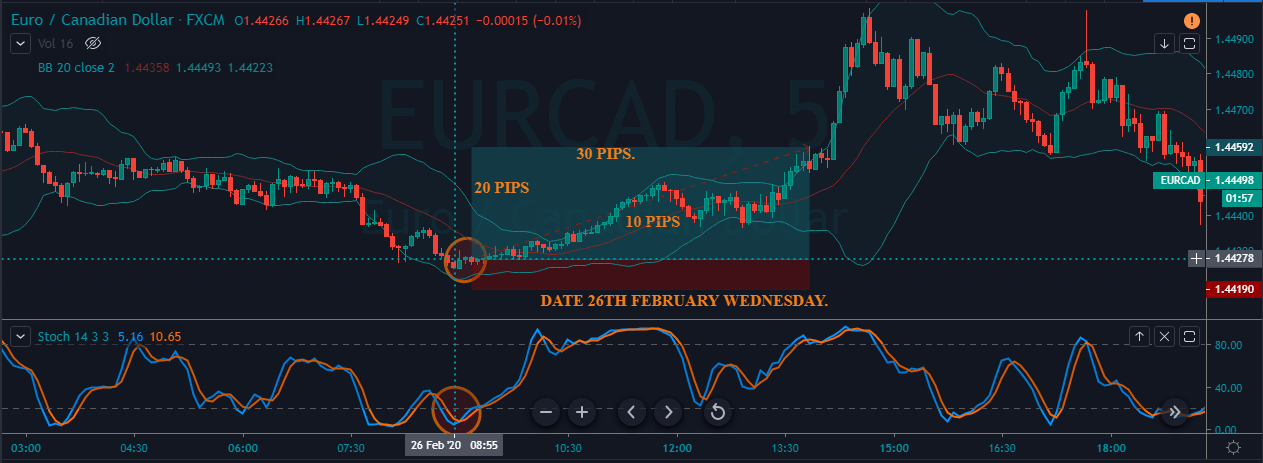
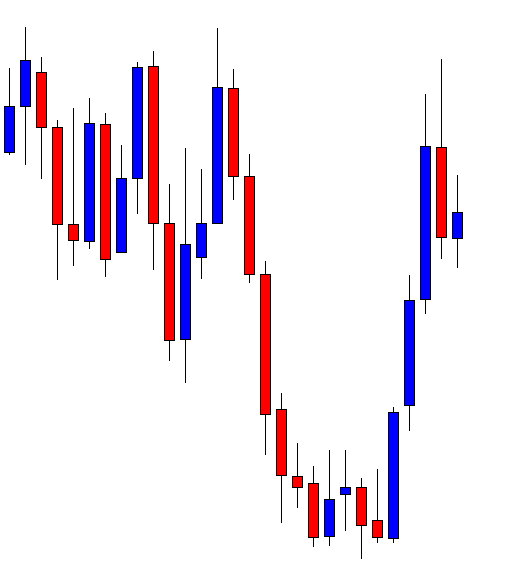
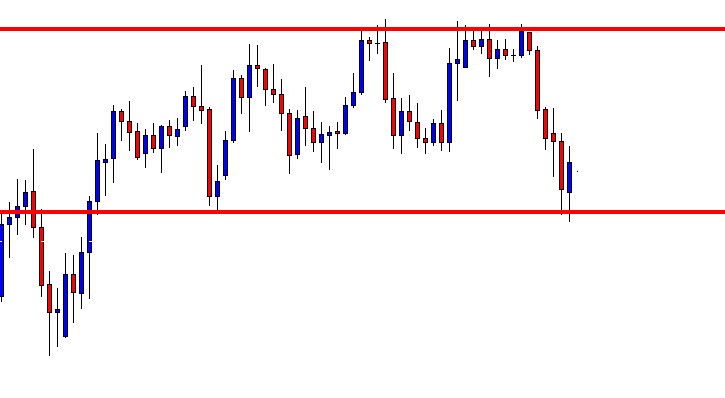
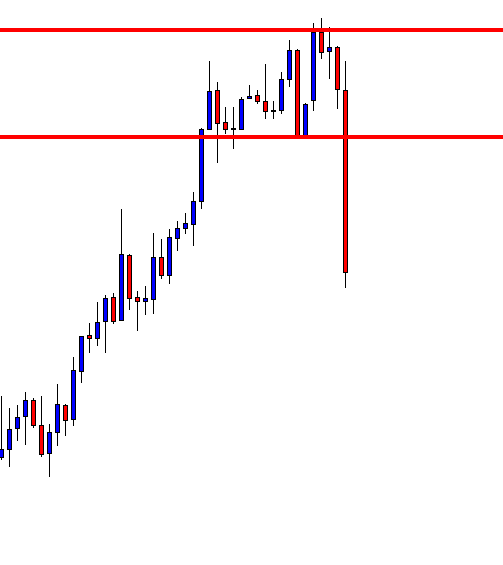
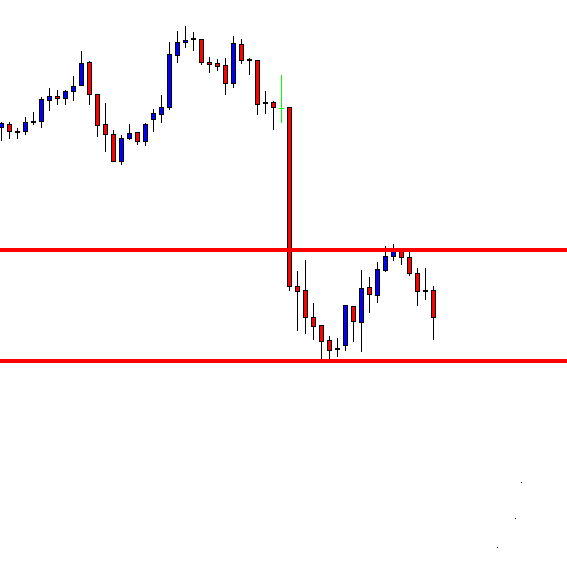
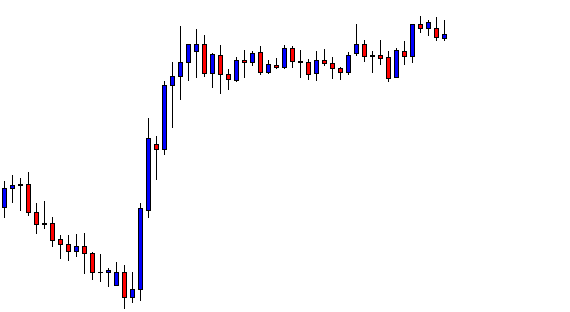
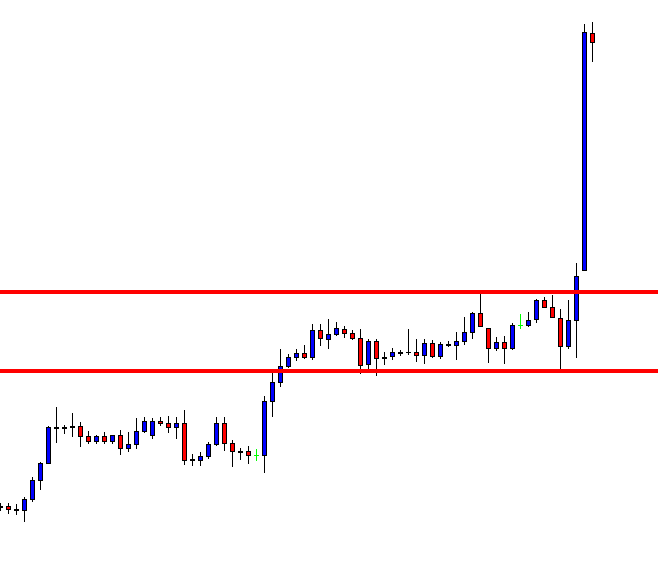
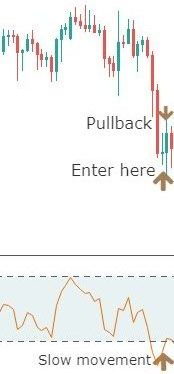
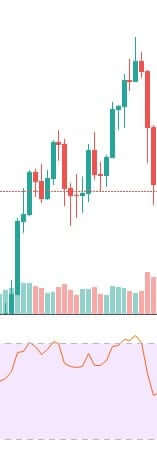
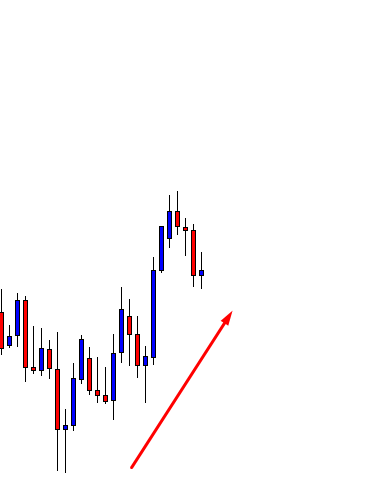
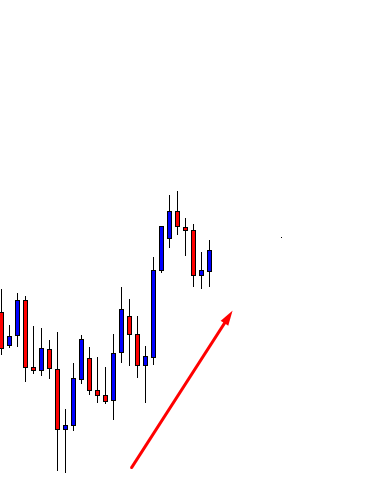
As you can see in the below image of the USDCAD 15 minute forex chart, the markets were overall in an uptrend. Our strategy gives the first trading opportunity around the 27th of February, and exits were also the same day. Our early trade gives us 30+ pips profit. After our position exiting the market provides us with a trading opportunity in the US session, we took this example from the recent market conditions, so our second trade in still running. By now, our second trade is up by 100+ pips. By following the flow of the market, you can easily make money, without placing the stop loss. You can see in the below image that the market is not even dead and volatile; the markets were moving in a relaxed and calm manner, find these kinds of markets to spotlighting the outstanding trading opportunities.

Selling Rules

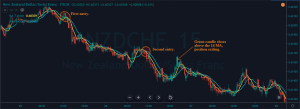
  1. In a downtrend, go short when the 7 MA crosses the 14 MA to the downside.
  2. Exit your position when the green candle closes above the 14period MA.
  3. No need to place the stop loss.

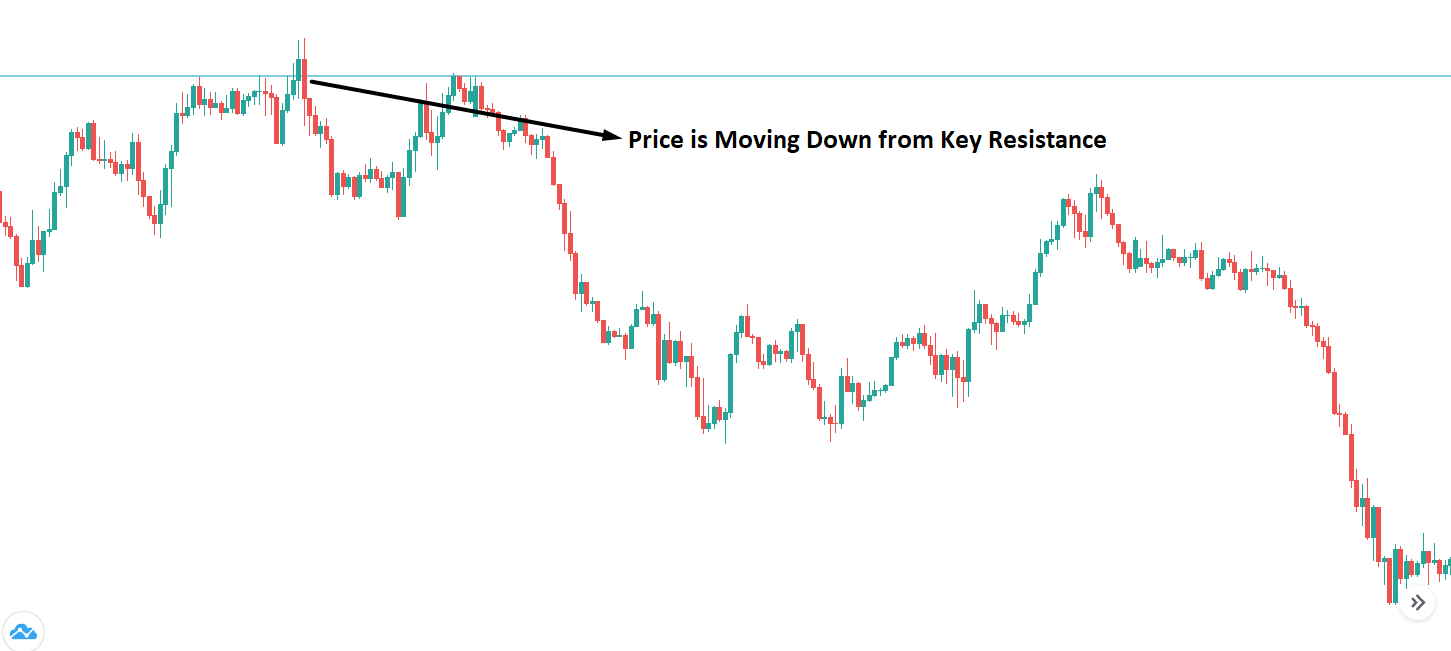
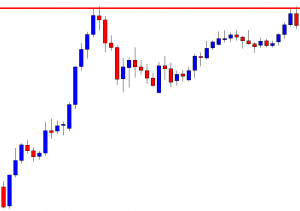
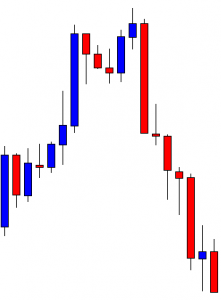
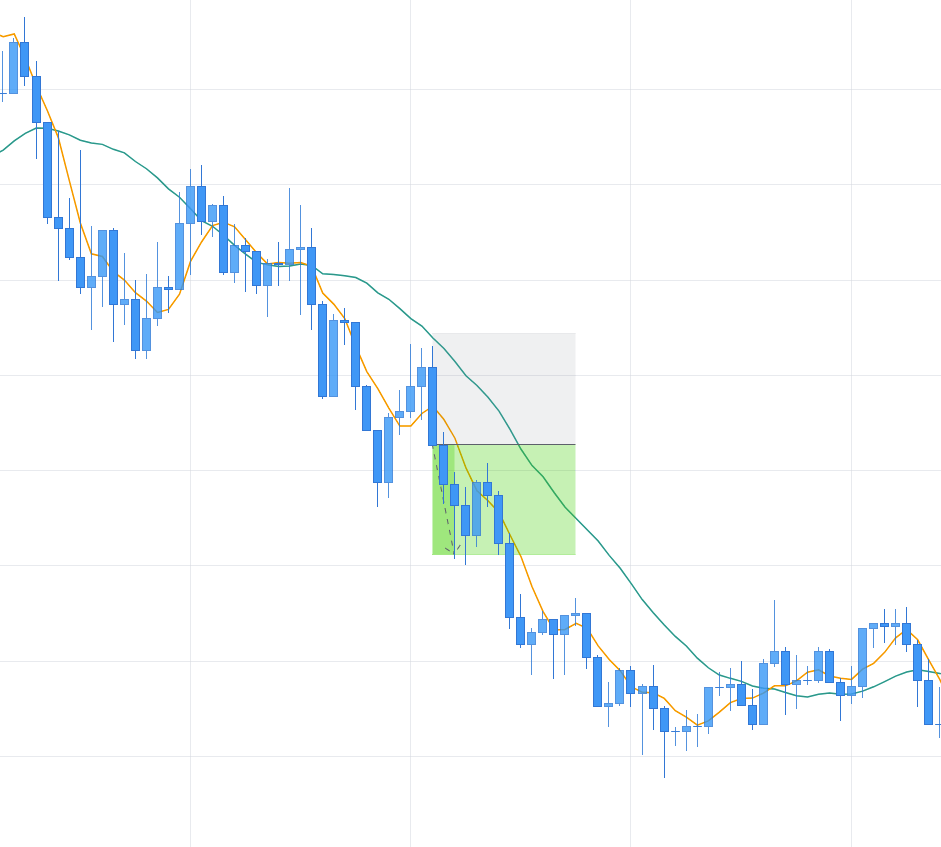
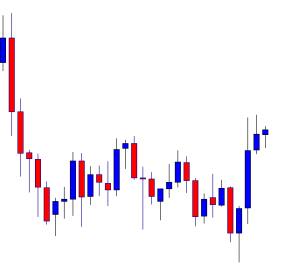
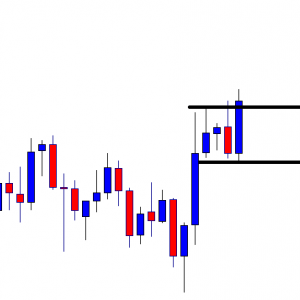
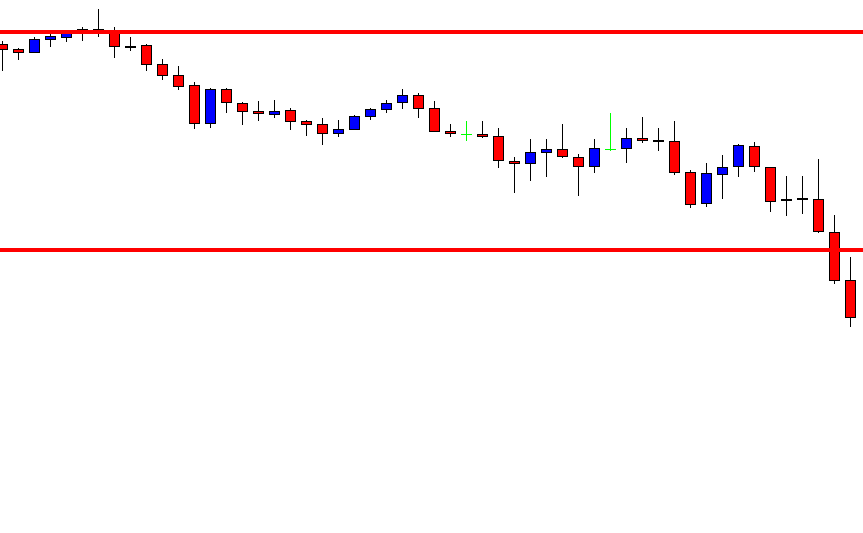
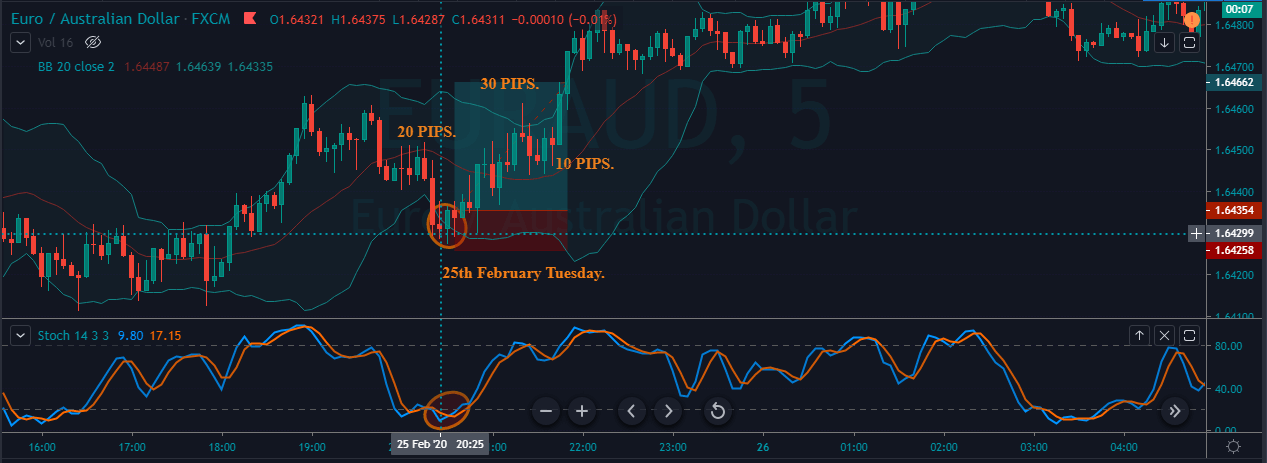
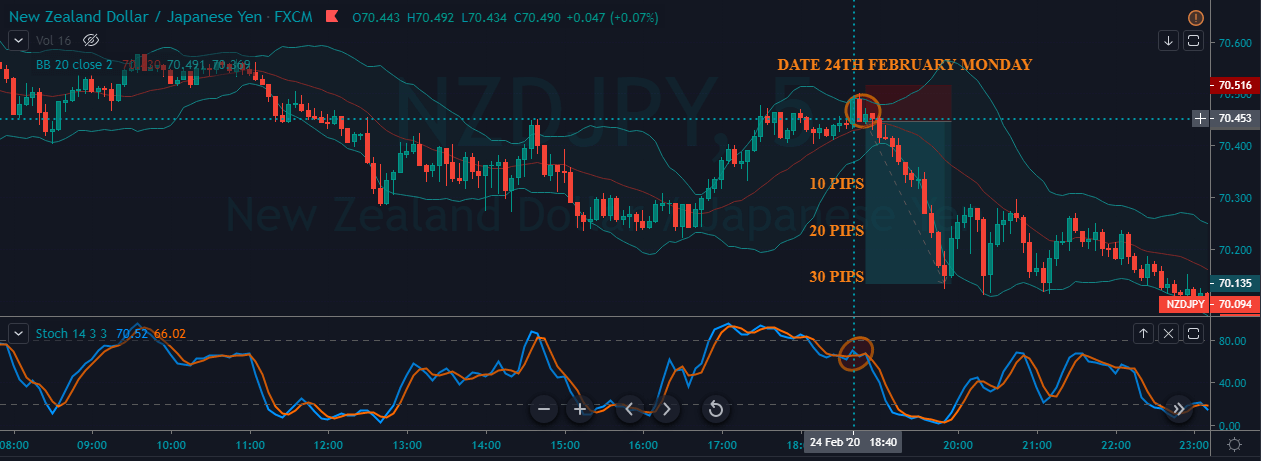
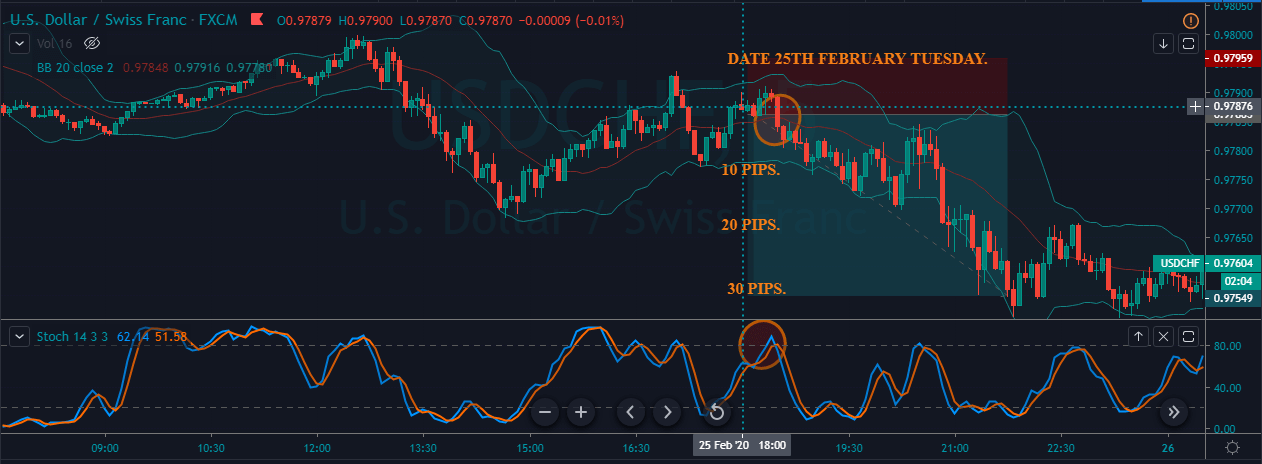
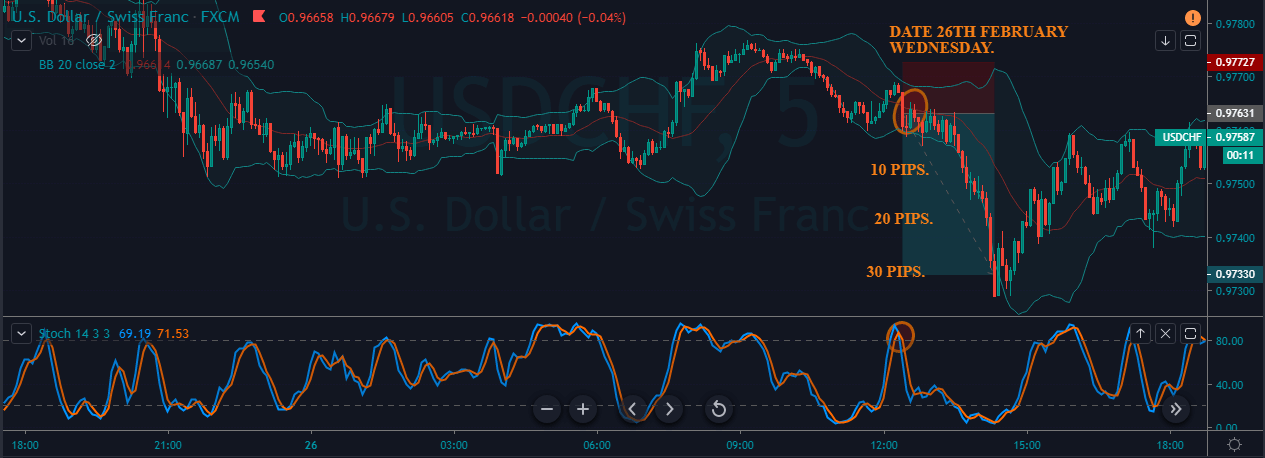
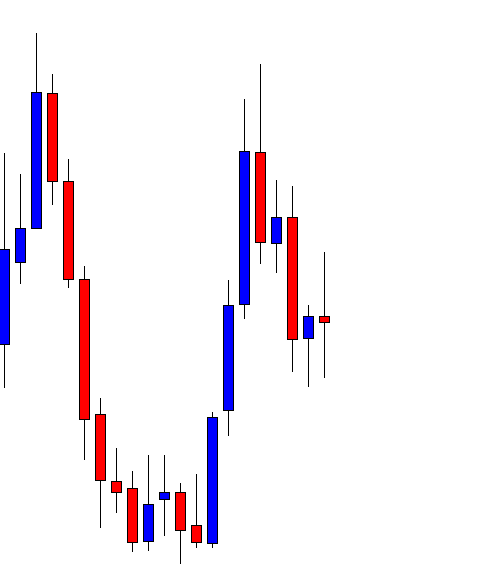
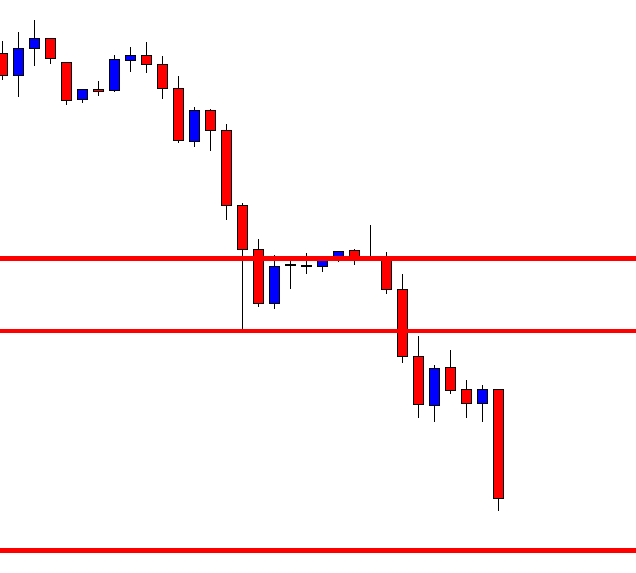
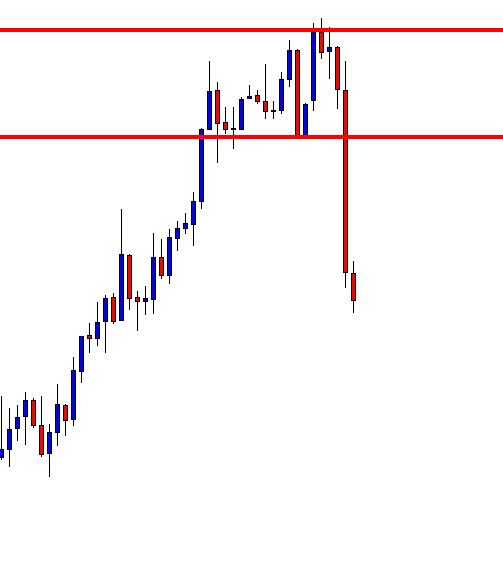
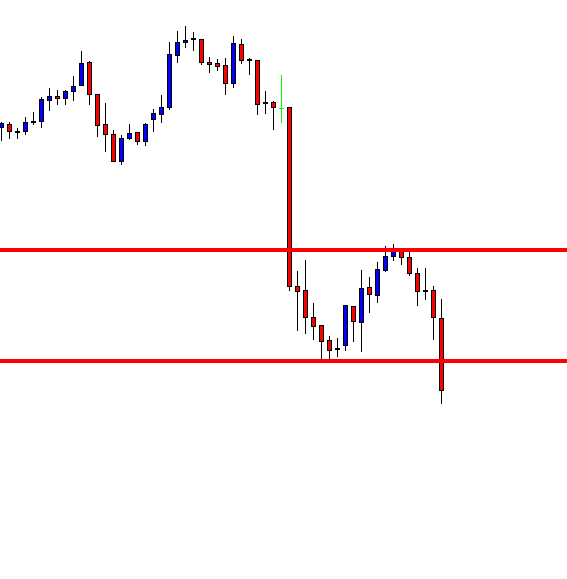
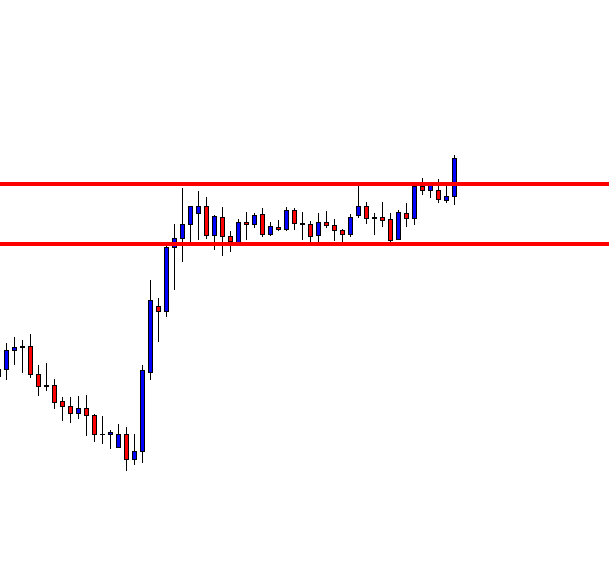
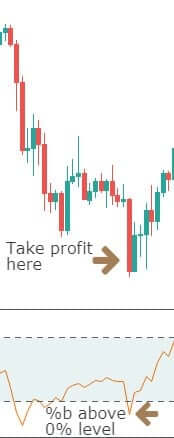
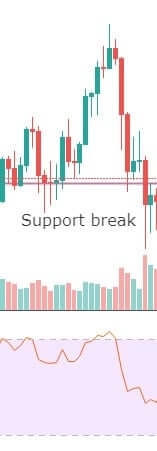
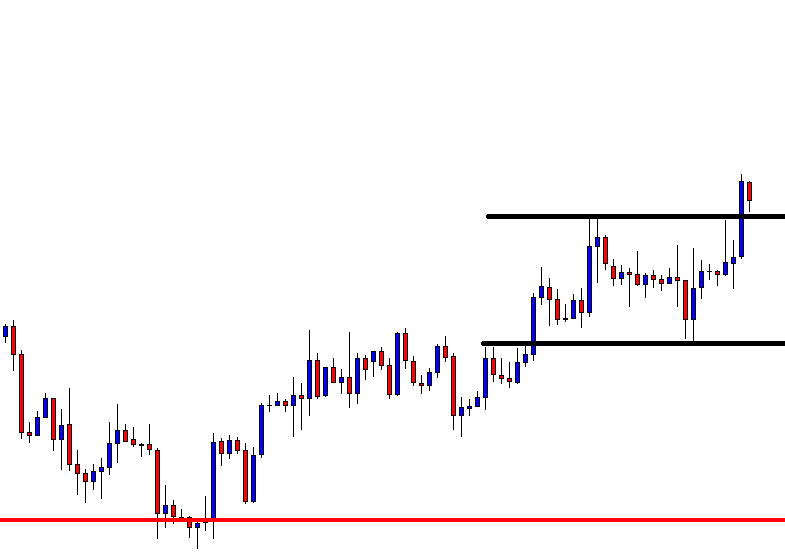
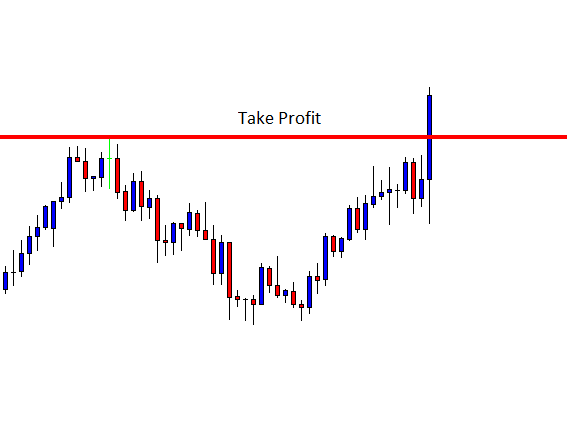
The below NZDCHF forex pair indicates the selling opportunities by using the Doube moving average. The markets were in a strong downtrend, and it gives us the first trading opportunity on the 25th of February around the London session. After our entry price action dropped immediately and printed the brand new lower low. The very next day market gives the second selling opportunity in the London session. On the same day, the opening of the New York session indicates us to close both buying positions when a green candle closes above the 24 periods MA. Both trades help us to milk 80+ pips in just two working trading days.

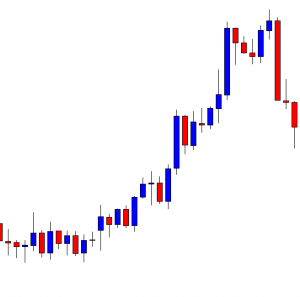
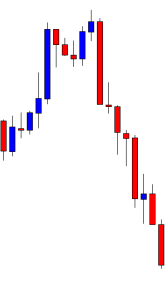
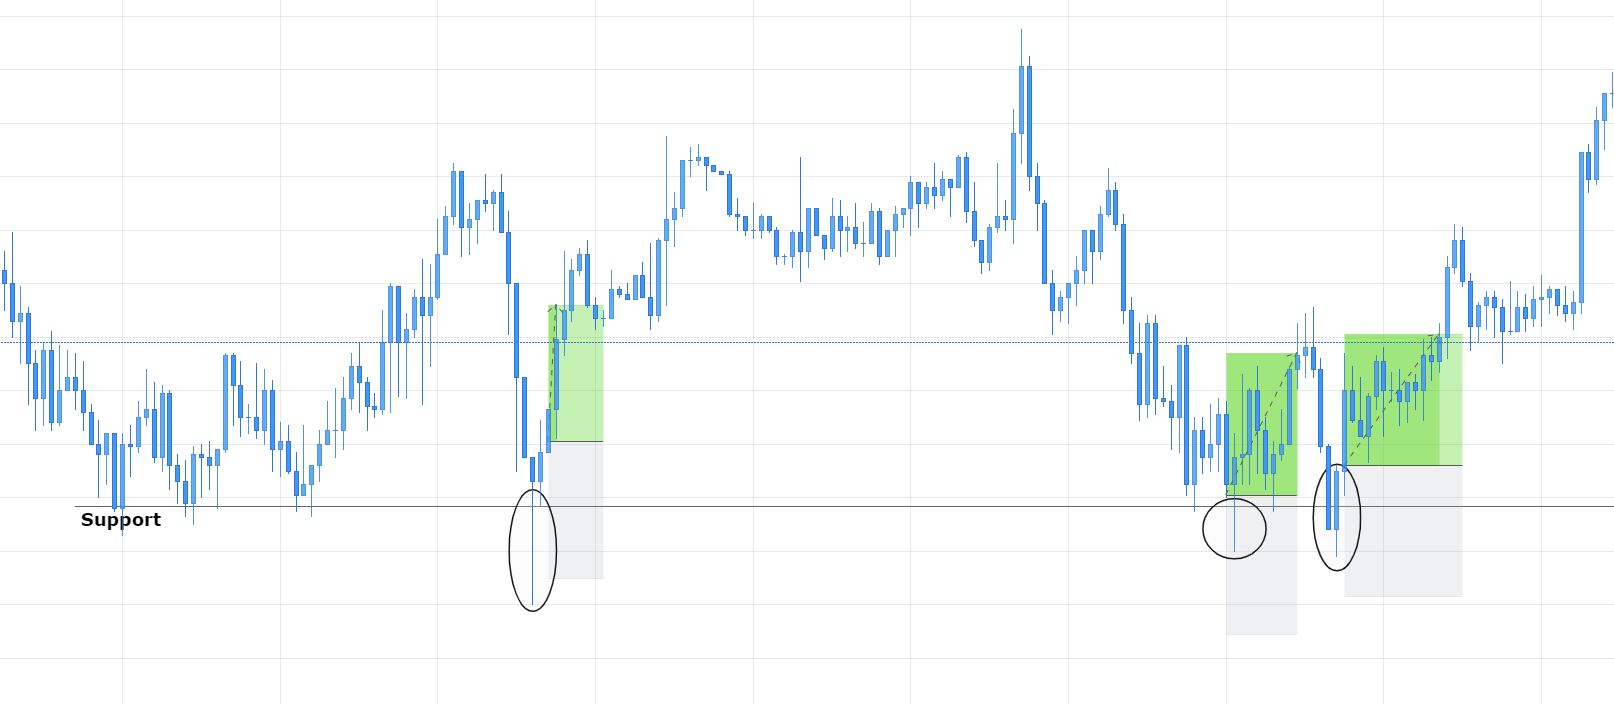
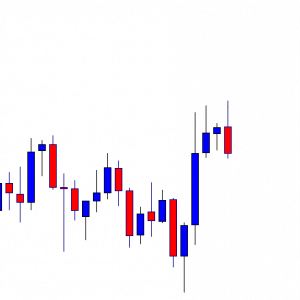
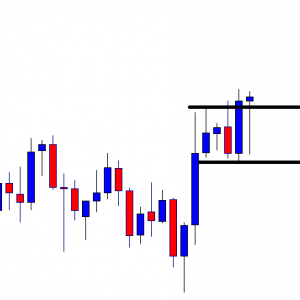
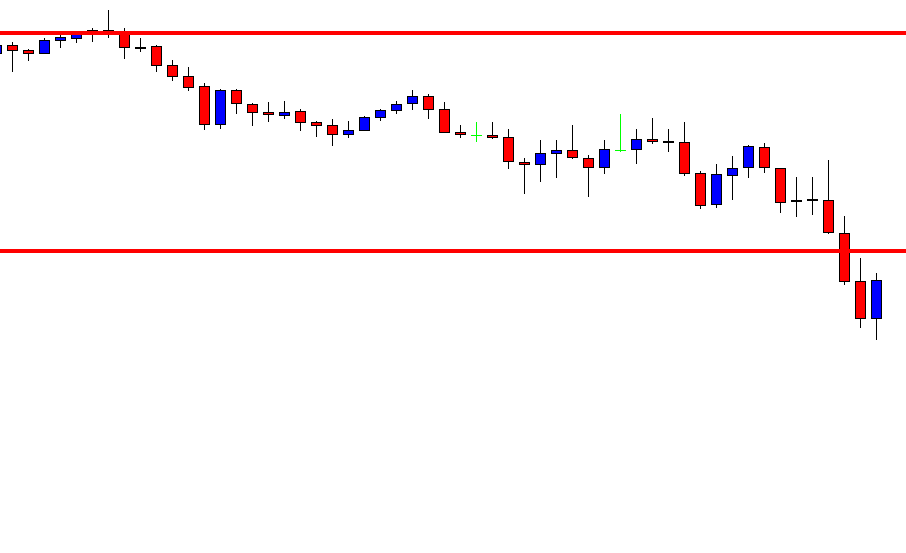
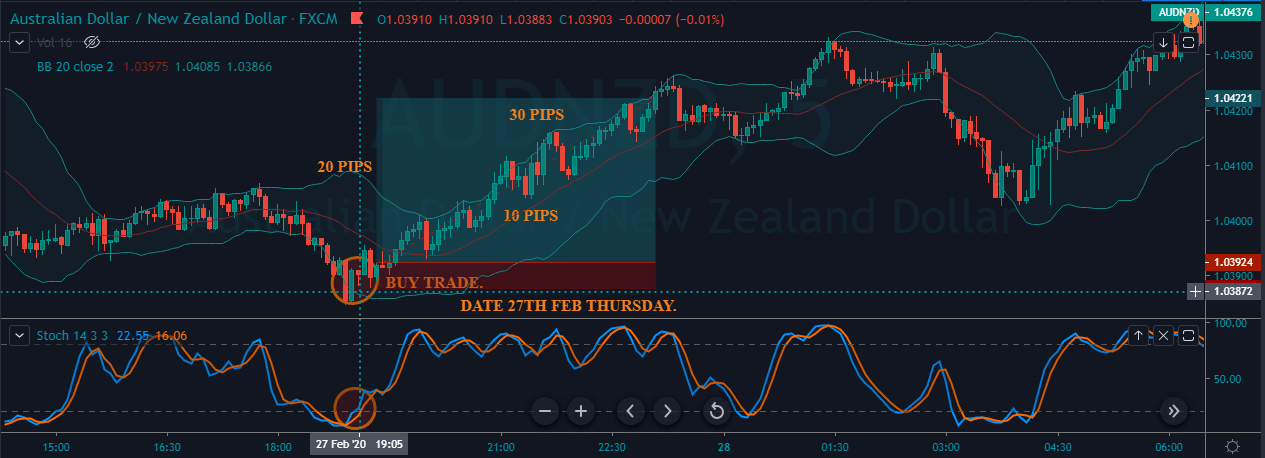
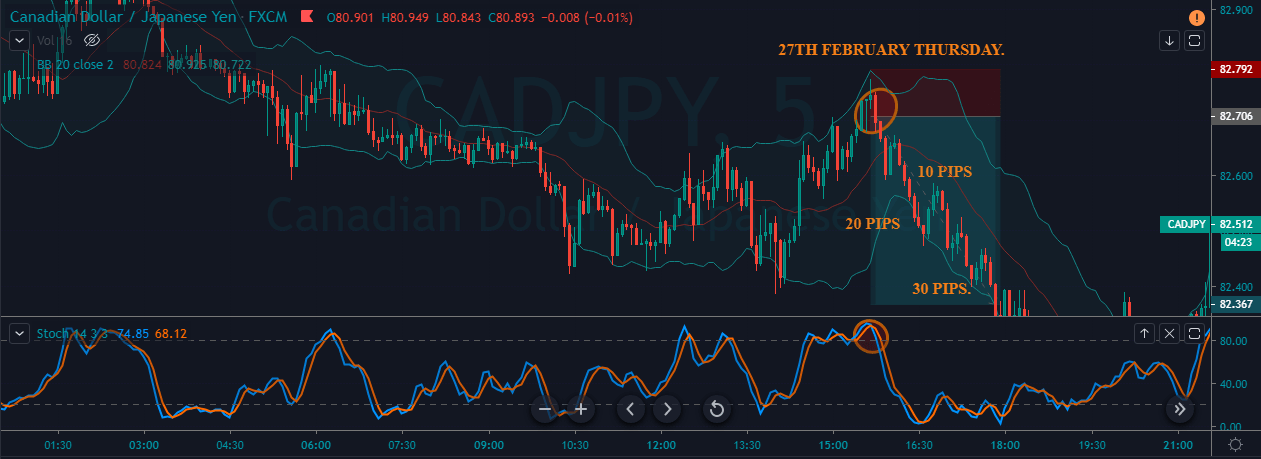
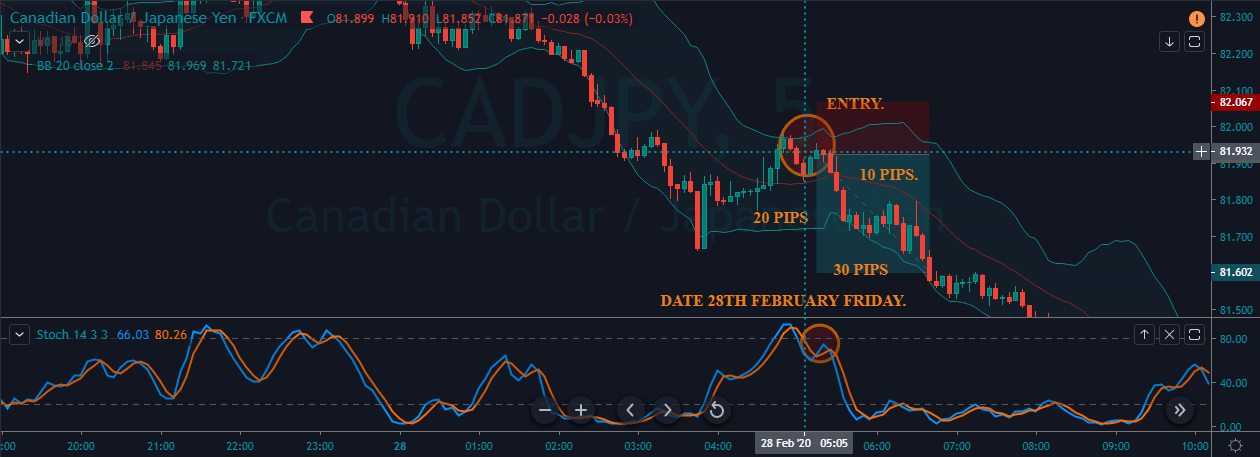
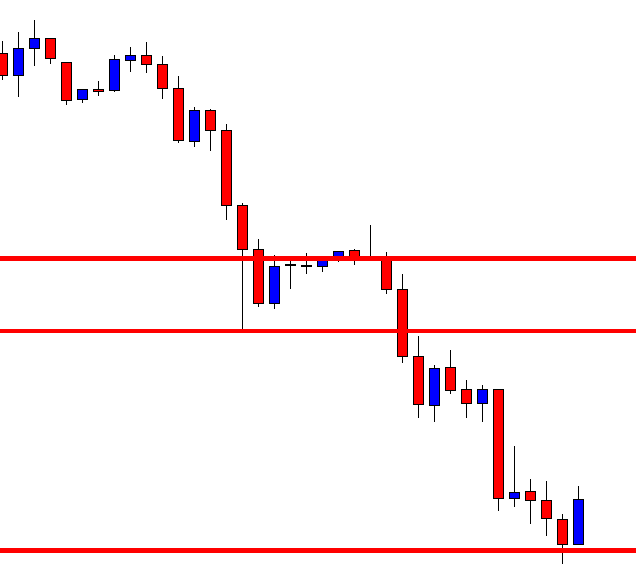
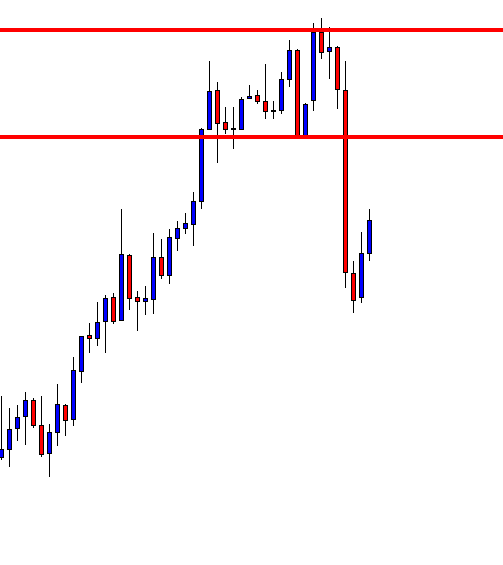
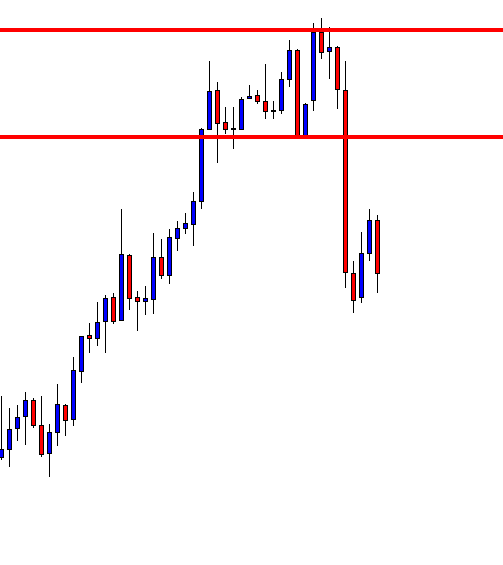
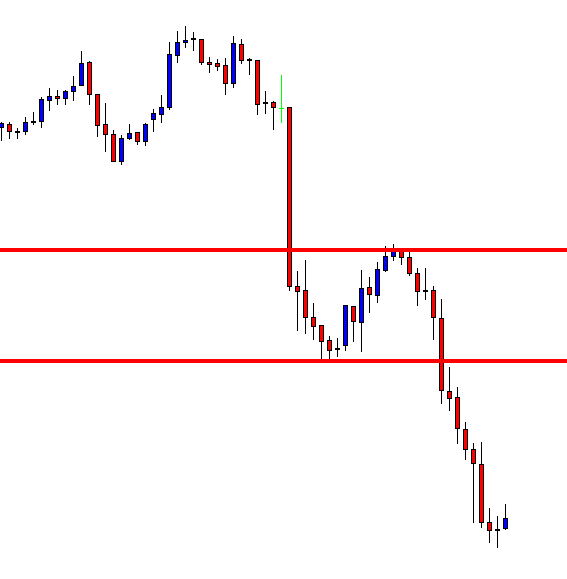
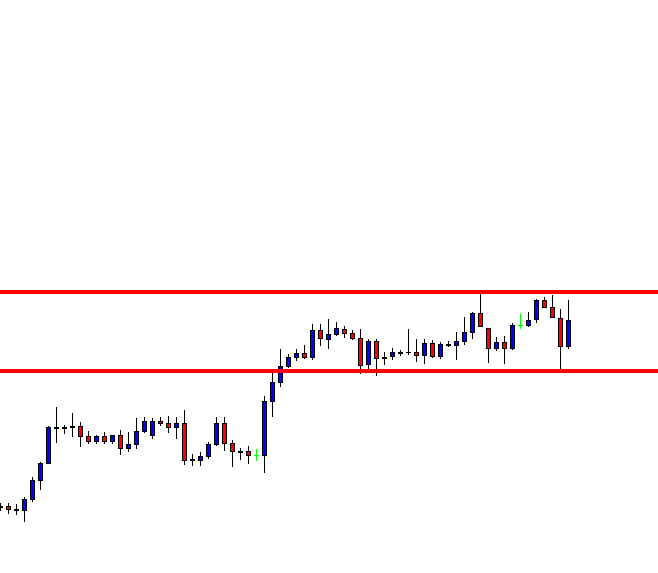
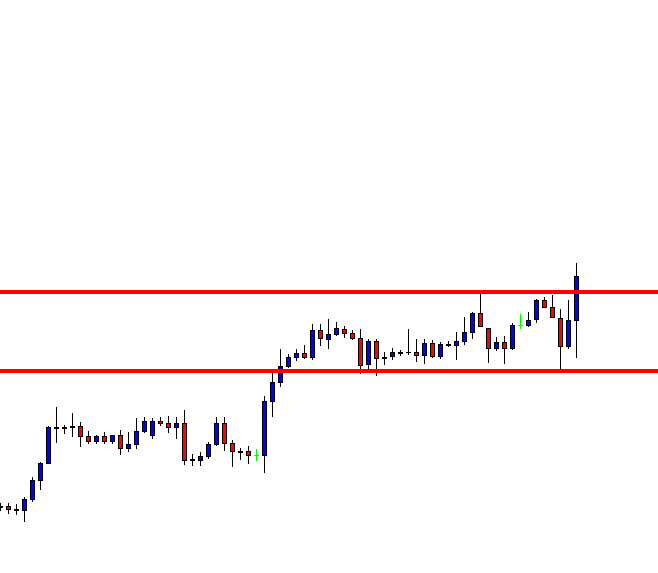
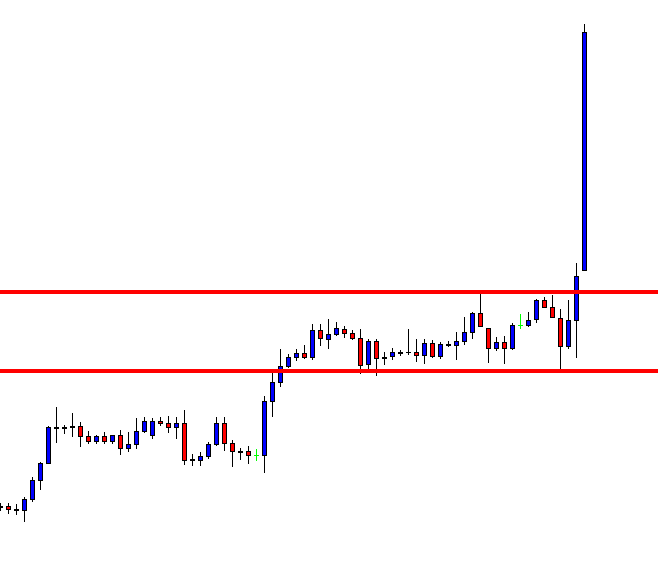
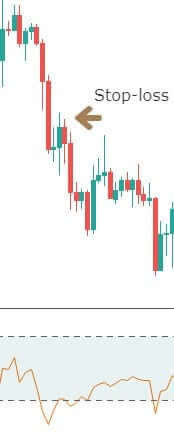
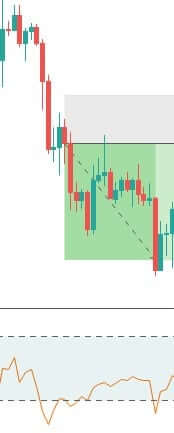
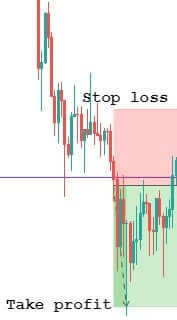
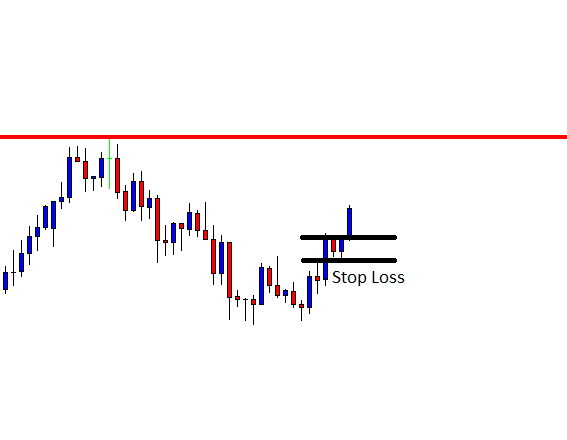
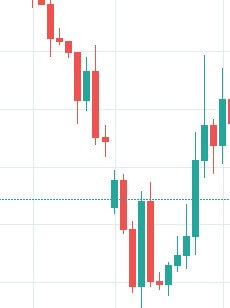
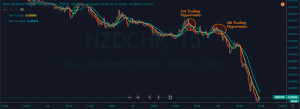
The below image represents the 3rd and 4th trading opportunities in the NZDCHF forex pair. We activate the 3rd trade in the New York session on the 27th of February, and the last trade was taken in the Asian session on the 28th of February. Both of these trades are running successfully, and we are in profits of nearly 200 pips. Now, all we need is to wait for the green candle to close above the 14 periods MA so that we can book profits. You can use this way to exit your position, or you can use the significant support resistance areas to book the profits. The MA lines also act as a dynamic support resistance to the price action, and the more, the higher the period we choose, the stronger the S/R will be. So when the price action crosses the 14 periods MA, it indicates our trading party loses its power, { buyers in buying side, sellers in selling side } so it’s the best time to close our position.

Conclusion

We believe that by now, you can understand that it is possible to trade the market without using the stop loss. All you need to do is to put in the extra work required to find one of the best trading opportunities to make some consistent money. In short, Activate your trades only in active trading hours, no trade in dead or volatile market conditions also avoid choppy or ranging market conditions. Find out the super smooth trend in any instrument and wait for the price action to meet the rules of strategy to take trades.

Keep Milking The Markets, Peace.

Categories
Forex Basic Strategies

Pairing Stochastic With The ‘Double Bottom’ Forex Chart Pattern

The double Bottom is a technical chart pattern, which helps to identify the change in the direction of the selling trend. The pattern looks like W in shape and it is quite a popular pattern among technical traders. In other words, double Bottom is a bullish reversal pattern. Most of the time double bottom reversals usually mark the long-term trend change in an instrument. In an ongoing downtrend, the price action drops to a floor, a significant support level before beginning the new uptrend. The pattern forms by two consecutive rounding bottoms with approx. Same heights. Most of the time, the momentum of the second Bottom is quite weak, which indicates that the weak selling momentum. Both of the round bottoms retrace until it finds the major resistance area that we call the Neckline. Overall, the pattern indicates that the professional traders, market movers booking the profits, and now the market are ready to print brand new higher high.

The image above represents the Double Bottom Chart Pattern on Price Chart.

Psychology Behind This Pattern

As by now you know that the double Bottom pattern occurs at the major support area, the pattern suggests that when the price action reaches the major support area, it means that the sellers are now afraid of the major support zone so they are booking their profits and as a result, the momentum of the market keeps dying. When price action prints the first Bottom, it indicates that some buyers try to buy; as a result, price action approaches the Neckline, and now at the Neckline, some sellers again try to hit the sell in order to print a brand new lower low. When price action reaches the major support area again, they failed to print a new lower low, and as a result, they booked the profit. Now the markets are entirely under the control of the buyers, and they are ready to print the brand new higher high.

Trading Strategies Using Double Bottom Pattern

Double Bottom Pattern + Bullish Candlestick Patterns

There are several bullish candlestick patterns that are widely used by technical traders in the market. You can use any bullish candlestick pattern to trade the market, some of the popular bullish candlestick patterns are Bullish Engulfing, Morning star, Gravestone Doji, Dragonfly Doji, Three white soldiers. These are widely used, and the most common candlestick patterns exist in the market.

The idea is to find out any bullish candlestick pattern at the second Bottom, when you find out any bullish pattern at the bottom area go long, put the stop loss below the support line, and the first take profit must be at the Neckline, second one should be double than the size of the pattern.

The below Image represents the double bottom pattern on the NZDUSD Forex pair.

As you can see in the below Image, the market prints the Double Bottom chart pattern, which indicates that the buying trade in this pair. Initially, when the price action approached the support area, at that time, the momentum of the downtrend was really weak, but after the first retracement to the Neckline, the sellers try hard to print brand new lower, but they failed to do it. When price action hits the Bottom second time, the market prints the bullish engulfing pattern, which indicates the buying trade in this pair.

The below Image represents our entry and exits in this forex pair. We took long when the market prints the bullish engulfing pattern, and the take profit was below the second Bottom, the major support line below acts as dynamic support to the price action. You can even go with a smaller stop loss because the line below is so strong that it stops the strong selling trend and even reverse it completely. So you can imagine how strong this line is. The take profit was at the Neckline, you can close your position at the Neckline, or you can hold it for the further target. It is advisable to book half of the profit at the Neckline.

Double Bottom Chart Pattern + Stochastic Indicator

In this strategy, we paired the Double Bottom pattern with the stochastic indicator to identify the trading signals. Stochastic is a quite popular oscillator that is developed by George C. Lane in the 1950s. Most of the traders think that just like other indicators, stochastic also follow the price and volume, but it is not true. In fact, stochastic follows the momentum and speed of price action. The stochastic indicator is used to identify the oversold and overbought buying conditions, and traders use overbought/oversold conditions to trade the market. The indicator also identifies the divergence, which helps the traders to identify the major market reversals.

The below Image represents the Double Bottom chart pattern on the Daily chart of the CADJPY forex pair.

The below Image represents our entry in this pair by using the stochastic indicator and double Bottom chart pattern.  As you can see that we took a long position when prices failed to go below the major support line. Most of the traders what they do is activate the buy trades when the price action hits the support line the second time. This is the wrong approach. Instead, let the price action holds and then activate your trade. As you can see, when prices hit the second Bottom at that time, crossover happened on the stochastic indicator, which indicates that the market is oversold and it is time to go long.

The below Image represents our entry and exits in this pair. We took long when the price action hits the second Bottom, also when the crossover happened on the stochastic indicator. Stop below the recent low, and the take profit was at the higher timeframe major resistance area.

Conclusion

The double Bottom is an extremely powerful chart pattern when it is interpreted correctly. If you interpret it incorrectly then it can damage your trading account. You can activate your trades when price action hits the second Bottom, or you can activate trades when price action crosses the Neckline and retests as support. It doesn’t matter where you activate your trade; both of the locations provide a good risk to reward ratio.

Categories
Forex Course Guides Forex Daily Topic

The right ways to Stop-loss Setting

We, at Forex.Academy, try to help novice, and not so novice, traders the best ways to trade in this Forex jungle.  Many novice traders put their focus on entries, thinking that to be profitable, you need to be right. Right?

– Wrong!  in his book “Trade your way to your financial freedom,” Van K. Tharp proposed a random entry system as an example to show that trade management is more important than entries. The stop-loss setting is a key part of trade management, so let’s have a look at how to optimize them.

Stop-loss placement is the part of the system that decides when the current trade setting is no longer valid, and the best curse is to cut losses. Of course, there are lots of ways to do that, and we at forex.academy have published several articles regarding stop-loss definition. This is a kind of entry point for you to have it easy.

Usually, new technical traders trust stops placed below easily seen supports or above resistance levels. If all participants see them, why would this be a good method? Surely not. Therefore, we suggested a better solution: ATR-Based stops.

An improved method for the ATR Stops is the Kase-Dev Stops. Kese stated that a trade is a bet on a continuation of a trend. The ideal trend is a straight line, but the market has noise. The aim of a well-placed stop-loss order is to set it away from the noise of the market.

Shyam, while writing the Forex course, teaches his learners that Fibonacci levels are not only meant for entries but serve quite well to define Fibonacci-based stop-loss levels.

Arthur Simmons, another of our excellent writers, explains how you can set stop-loss orders using point and figure charts.

Finally, if you are statistically oriented, you may be interested in the Maximum Adverse Excursion (MAE) stops. The concept of Maximum Adverse Execution was introduced by John Sweeney. The idea is simple: If your entry system has merit, successful trades behave differently than losing trades. The MAE level defines the point beyond which it is likely the current trade would belong to the losers set, and thus, it is the optimal level to place the stop-loss.

I hope this gives you nice ideas for your stop-loss orders and helps you avoid being a victim of the market makers and institutional hawks.

Good trading!

Categories
Forex Stop-loss & argets

Is a Stop Loss Always Necessary?

Do you really need a stop loss? The quick answer is, yes. The longer answer is yes if you choose not to exploit your Forex trading account. There are many reasons to use a loss limit, but there are some strategies that can be implemented to give up a stop loss, although it is usually the domain of institutional traders to do things like that.

Stop Loss is your Best Friend

Stop loss is your best friend, as volatility in Forex markets can increase at any time. There may be a surprise announcement, some events around the world, or, worse, something is happening while you’re asleep. He just can’t predict everything that’s going to happen, so the end of the loss is his guardian angel. As for Forex markets, there are a multitude of reasons why you might see a sudden rise in price.

Let’s take an example, in recent years we have watched the Swiss National Bank defend the level of 1.20 in the EUR/CHF pair, refusing to allow the pair to fall below that level as the Swiss franc had become too expensive. However, on 15 January 2005, the SNB suddenly abandoned parity and allowed the market to fall, as it had been protecting that level for a couple of years and had finally become too expensive.

Large amounts of institutional money were going in and buying the pair every time it approached the level of 1.20 because it was “easy money”. However, as soon as the Swiss moved away from the Forex markets, the pair collapsed and several candles fell in milliseconds. Around the world, there were stories of retailers who had rejected the common sense of putting up a stop loss and were eliminated.

Stop Loss Example

Think now of an American merchant. You have a position in the EUR/USD pair putting your trust in the Swiss National Bank to protect it. Suddenly, when he wakes up on January 15, he discovers that his account is empty. His agent is demanding that he deposit more margin, and for some people, it was even worse than that: they actually owed their agents money because the orders could be filled quickly enough.

Of course, this is a very extreme situation, but it is not strange that a pair like the EUR/JPY drops 100 pips in your sleep. Some people use stop loss as a “disaster stop”, but they are designed to protect you when your analysis is not correct, and let’s be honest: incorrect analysis is simply part of the game.

Stop Loss Exists for a Reason

Not only are there losses to protect your account against disasters, but it also represents a “line in the sand” where it is verified that your analysis is incorrect. If it proves wrong, you just walk off the market and realize you’re living to fight another day. Unfortunately, many of you will be moving stop losses to avoid taking losses, but the successful trader is willing to reduce losses quite quickly. Ultimately, the successful trader understands that if his analysis proves incorrect, it is better to keep his losses very small. However, if it is shown that your analysis is correct, moving your loss limit is in your favor to ensure profits is a perfectly acceptable strategy. This allows the market to tell you when it’s time to leave after a big, higher race.

Other Strategies

Institutional traders often use options to protect themselves against currency fluctuations, but sometimes that gets complicated. Most retailers will receive better service by simply accepting a loss as soon as it appears and they move on with their lives.

For example, if your loss is 1% of your account, it is not a big disaster. However, if you don’t use a loss limit and simply use a strategy of hope, you may discover that you are so low that you can never get that money back.

To use the options of the strategy, quite often if a trader goes long on the EUR/USD pair, he will buy a spot simultaneously, with the idea of at least recovering part of the losses if the trade goes against him in the Forex spot market. Otherwise, if the trade works, the option expires without value. However, there are many other factors in the choices that make it much harder and slower to figure out how to protect yourself by ticking.

Depending on where you live, you can direct your trade with the same broker if you trade in the opposite direction. However, usually, this is a scenario in which you limit the amount of profit you can get because one of those trades will be absolutely a loss. This has nothing to do with having a loss of stop in a trade that works for you because theoretically, the profit potential has a limit.

It is not advisable to trade without a stop loss. You should never trade without a stop loss under any circumstances. There are too many reasons why you could lose a lot of money. Of course, some of the points I’ve been making in this article are a little extreme, but at the end of the day, you never know when something is going to happen. Beyond that, it’s a way to force your account to neutral again if the trade doesn’t work. You can also use it as a way to make a profit if the market backs down after a big move in your favor.

The Forex world is full of bodies of people who thought they were smarter than the market and couldn’t bother to suffer a loss. There is no such thing as a “100% successful strategy,” apart from limiting your losses and expanding your profits. Losses come independently, so protecting yourself is all you can do.

Categories
Forex Course

147. How To Detect A Fakeout like a professional Forex trader?

Introduction

It is a general perception among Forex traders that the fakeouts are caused by the banks and large institutional players to stop retail traders players from moving the market in their desired directions. Although there is no evidence to prove this theory, we believe it is true. The manipulation is done by the big players. A fakeout is simply a failed breakout, and most of the time, they occur at significant areas like support, resistance, trend lines, Fibonacci retracement levels, and chart patterns, etc.

Typically, fakeouts are the result of a battle between both the parties on the price chart. So if you are witnessing a range and if we see both the parties printing aggressive candles, we can expect more fakeouts. The same applies to the trending markets as well. The aggressive battle between the buyers and sellers for domination leads to frequent fakeouts.

Trading Fakeouts

It is a common perception that it is impossible to trade these fakeouts, but that is not true. We can trade fakeouts, but a lot of market understanding is required to do so.

#1 Strategy 

The image below indicates a fakeout followed by an actual breakout in the EUR/GBP Forex pair.

As we can see below, when the price breaks above the breakout line, it started to hold there. If it didn’t hold, it means that the price goes above and came back into the range. So in our case, hold above the breakout line confirms that the price is not going to fake out, and riding the buy trade from here will be a good idea.

#2 Strategy 
Buy Example

The image below indicates a false breakout in this Forex pair.

As you can see below, we choose to enter a buy trade after the price action fakes below the major support area. We can see that it is eventually coming back and holding at the support area. This holding support clarifies that the sellers failed to move the market.

Now buyers are coming back and holding the market to go for a brand new higher high. We can see that price action respecting the trendline for a while, but then it breaks above the line, printing a brand new higher high.

Sell Example

The image below indicates the appearance of a faker on the EURGBP sixty-minute chart.

The image below represents our entry, exit, and stop-loss in this Forex pair. The pair was in an uptrend, and as it tries to go above the resistance line, it immediately came back and stated holding below the resistance line. This confirms the faker, and after our entry, prices go back to the most recent lower low.

That’s about identifying Fakeouts and how to trade them. Please be sure to trade these fakeouts only when you are absolutely sure about them. All the best.

Categories
Forex Stop-loss & argets

How to Stop Exiting Trades Too Early

Have you ever exited a trade too early for a small win or loss and wished you could go back and change it shortly afterward? Many traders have struggled with the problem of exiting trades too early at some point. Here are a few examples of this problem:

  • A trader fears taking a loss and decides to close out their trade at break even, even though the trade is a winner.
  • A trader exits the market after making a small profit, but well before their planned profit target due to a fear that the market will reverse. This causes them to make less profit. 
  • The trader sets a stop loss but decides to exit the trade well before the stop loss is reached because they have incurred a small loss. The trade then goes on to be a winner.

Of course, there are many different reasons why a trader might choose to exit their trades too early. If you want to be a successful forex trader, you’ll need to work to overcome this problem and make sure it isn’t happening to you. Below, we will talk about some of the underlying factors that contribute to the issue of closing trades out too soon.

  • Lack of Proper Education

An ideal trader is well-educated and has a good trading strategy that accounts for risk-management. Others jump in too soon and open a trading account simply because they have money to invest or they’re inspired. If you don’t really know what you’re doing, then you’re going to have an issue with figuring out when to exit trades. Knowing when to enter trades would also be an issue. The best way to overcome this is to make sure you have a good understanding of all concepts related to forex trading. If you’re constantly watching your trades, you could also remember to “set and forget”. Some other common problems that stem from lack of education include overleveraging trades or risking too much money on any one trade. It is important to look at the bigger picture to see if you are making any of these mistakes.

  • You’ve Incurred Previous Losses

Those that have had recent bad luck with a trade or a string of losing trades are more likely to be fearful and anxious when trading. This affects one’s view of the market and makes it seem riskier to enter a standard trade. The best way to overcome this problem is to realize that there’s no way to know for sure whether a trade will be a winner or a loser and that your bad luck will come to pass. It isn’t logical to make decisions out of anxiety or fear, as this usually leads one to make the wrong choices.

  • Trading Psychology

Trading psychology focuses on the ways that different emotions affect our trading habits. For example, if a trader experiences a number of bad trades, their anxiety might cause them to exit too quickly. Fear can do this too. We briefly mentioned anxiety and fear above, but we want to point out that these emotions can occur for many different reasons. Some traders are naturally anxious or scared of losing money because that is their personality, or they aren’t entirely confident in their abilities. Whatever the reason, someone might let these emotions convince them to exit a trade too soon. Emotions like greed or excitement might have the opposite effect and cause traders to exit too late.

  • Negative Thinking

Even though they have decided to become traders, some people still think negative thoughts about their abilities. One might tell themselves that they have always been poor and always will be if they have some losses. Another might consider themselves stupid and be too hard on themselves over losing trades they couldn’t have expected. It’s important to remember that the way you think will affect your performance. Don’t beat yourself up over losses, simply try to learn from them and move on. 

In Conclusion 

Above, we highlighted some of the personal factors that contribute to exiting trades too early. Emotion, previous losses, negative thinking, and the lack of a proper trading education seem to cause this problem for many traders. Now that you might have an idea of what is causing you to exit your trades too early, we will provide some tips that will help to avoid it:

  • Remember that everyone loses. You aren’t going to have a 100%-win record when trading and that’s normal, so move on if you take a small loss.  
  • Have an entry and exit strategy with take profit targets and a set stop loss. Don’t exit before your planned take profit level or stop loss is reached. Try to “set and forget” your trades. 
  • Learn to take a break if your emotions become too difficult to manage.
  • Keep a trading journal to log your progress so that you’ll see if there is a pattern of exiting trades too early. 
  • Try not to allow any recent losing streaks to alter your decisions when trading. 
  • If you feel confused when trading, then consider taking measures to educate yourself more thoroughly so that you can base your entry and exit points off more solid data. 

Realizing that you’ve been exiting trades too early is the first step to solving the problem. Next, you just need to figure out the reasons why you’re doing this and how to overcome it. Hopefully, this article will help many traders to pinpoint some of the personal causes for this issue. If you’re an intermediate or skilled trader, however, you may be having this problem because of more technical concerns. 

Categories
Forex Basic Strategies

Trading The Forex Market Using ‘Price Action With Context’ Strategy

Introduction

Price action with context is a process to predict a currency pair’s movement by reading the chart. The key price driver of a currency pair is fundamental events, but we can predict the future movement based on the present and past activity of the chart.

Central banks and financial institutes drive the forex market. Therefore, when they make the price move, they left some signs of their activity. As a price action trader, we will read their activity and anticipate what they might do in the future.

What is Price Action?

Price action is a process to inquiry about a currency pair’s price development. The main aim of the price action trading is to understand buyers’ and sellers’ sentiment in the price and predict future movement based on these. The price action trading is based on the combination of several trading indicators and price behaviors. Therefore, you might have to use multiple trading tools as a price action weapon.

The price of a currency pair moves based on the sentiment of buyers’ and sellers’. Therefore, using price action is logical that can provide accurate trading signals. In the price action with context trading strategy, we will identify a market direction by reading the chart and then enter a trade from the correction to get the maximum return with a minimum risk.

What are Price Action Weapons?

There are many parts in the price action trading that a trader should know, like- candlestick, support and resistance, trend, market flow, event level, key Level, and market context.

Candlestick

Candlestick represents the price movement of a currency pair for a specific timeframe. The four major parts of candlestick trading are- opening price, closing price, high price, and low price. Candlestick represents both continuation and reversal price direction based on the opening, closing, high and low. There are many candlestick patterns in the market, but in this trading strategy, we will focus on reversal candlesticks only.

Example of reversal candlestick – Pinbar, Engulfing Bar, and Two Bar, etc.

Support & Resistance

Support and resistance are a price zone from where the price is likely to change the direction. When the price is moving up, it will reverse as soon as it finds resistance. On the other hand, the price will stop moving down as soon as it finds a support level. There is more to know about the support and resistance in this trading strategy-

Event Level – Event level is a price zone that works as both support and resistance. It is the most important Level as both buyers and sellers put attention to it.

Key Level – key levels are a significant level in the daily or weekly timeframe to understand the price’s top and bottom.

Dynamic Level – Dynamic levels move with the price rather than a specific horizontal zone. In this trading strategy, we will use 20 Exponential Moving Average as the dynamic Level.

Market Context

Market context is a process to identify the nature of a trend. It has four elements:

Impulsive – When the price aggressively creates new highs and lows, it is considered as an impulsive trend. It indicates that the price will continue the current trend.

Corrective – In a corrective market structure, price barely creates new higher highs or lower lows. It is an indication of market reversal.

Volatile Trend – In volatile trends, the market follows the corrective structure and indicates a market reversal.

Non Volatile Trend – Non-volatile trend appears with the impulsive market momentum when the price tries to continue the current movement.

Bullish Price Action Trade Setups

Find the market in an impulsive bullish pressure in H4 or daily timeframe. Identify the Key support level and consider buy trades only as soon as the price is trading above it.

Entry

To enter the trade, you have to wait until the price comes down towards an event level with a corrective structure in 1 Hour timeframe. Enter the trade as soon as the price rejects and closes above the event level with a reversal candlestick.

Stop Loss

Put the stop loss below the recent swing low with 10-15 pips buffer. Here the buffer means you should put the stop loss 15 pips below the swing low.

Take Profit

The primary target of the take profit would be the next event level. However, if the bullish trend remains impulsive, you can extend the take profit. On the other hand, you can close earlier if the price barely creates new higher highs.

In the example below, we can see a visual representation of how to take the entry with stop loss and take profit level.

Bearish Price Action Trade Setups

Find the market in an impulsive bearish pressure in H4 or daily timeframe. Identify the key resistance level and consider sell trades only as soon as the price is trading below it.

Entry

To enter the trade, you have to wait until the price comes down towards an event level with a corrective structure in 1 Hour timeframe. Enter the trade as soon as the price rejects and closes below the event level with a bullish reversal candlestick.

Stop Loss & Take Profit

Put the stop loss above the recent swing high with 10-15 pips buffer. Here the buffer means you should put the stop loss 15 pips above the swing high.

The primary target of the take profit would be the next event level. However, if the bearish trend remains impulsive, you extend the take profit. On the other hand, you can close earlier if the price barely creates new Lower lows.

In the example below, we can see a visual representation of how to take the sell entry with stop loss and take profit level.

Final Thoughts – Trade Management Idea

In the above section, we have seen how to trade using the price action with context. In this trading strategy, buy and sell trades come after filtering out unusual market movements from the volatile market conditions.

However, no forex trading strategy in the world can guarantee a 100% profit, so your trades might go wrong even if you strictly followed all rules. If you want to grow your account with a consistent profit, you should follow strong trade management tools, as mentioned below:

  • Ensure that you are not taking over a 2% risk per trade of your trading balance.
  • Move your stop loss at breakeven as soon as the price creates a new higher high or lower low.
  • If you face a 3 or 4 consecutive losses, take a break and observe the market until it follows the trend accurately.
  • Make sure to keep your mind free from any bias while you are analyzing the market.

Overall, price action is the core element of trading that every trader should know. There are many trading strategies combining price action and other trading tools. The strategy we have seen above has a good history of providing profitable trades. Therefore, if you can implement it properly, you can consistently grow your trading account.

Categories
Forex Daily Topic Forex Price Action

It Often Makes You Wait Longer Than You Want

In today’s lesson, we are going to demonstrate an example of a daily-H4 chart combination entry. The daily char produces a bearish engulfing candle at a significant level of resistance. It makes the daily-H4 chart combination traders flip over to the H4 chart to look for a potential entry. The H4 chart shows that the chart creates a double top. Simply, an ideal combination for the traders to go short on that chart. However, things do not go as smoothly as traders expect it to go in the Forex market. Let us find out what happens.

This is the daily chart. The chart shows that the price, after being bullish, has a rejection at the level of resistance marked with the red line. The price comes down and makes a bullish move again. If it makes a breakout, the buyers may push the price further up. On the other hand, sellers are to wait for the price to produce a bearish reversal candle to consider short opportunities. Let us find out what happens next.

The chart produces a bearish engulfing candle. Since it shows in the daily chart, the combination traders may flip over to the H4 chart to look for a short opportunity. A double top resistance and a bearish engulfing candle suggest the sellers may jump in here to drive the price towards the South further.

It is the H4 chart. The chart produces a double top and makes a breakout at the neckline. The combination traders are to wait for the price to consolidate and produce a bearish reversal candle to go short below consolidation support. The price consolidates here. However, considering consolidation length, it is better to skip such entry.

The price heads towards the South with extreme bearish pressure. It travels a long way to produce a bullish reversal candle. The sellers would love to get the reversal candle earlier though. Anyway, it is better late than never.

The chart produces a bearish engulfing candle closing well below consolidation support. The sellers may trigger a short entry right after the last candle closes by setting stop-loss above consolidation resistance with 1R.

The price heads towards the South with good bearish momentum and hits the target. It seems that the price may travel towards the South further. The point to be noticed here is that the chart consolidates after traveling a long way. It would give a better reward if it consolidated and produced the signal candle earlier. It makes the sellers wait for more as well. In the end, the sellers make a profit out of it but think how hard they are to concentrate on it to make it work for them.Traders’ life is not as easy as some people may think.

Categories
Forex Basic Strategies

The Most Simple Yet Effective Scalping Strategies You Must Know In 2020

Introduction

The Forex market consists of are several types of traders. They are broadly classified based on the time frame traded. For example, swing traders use time frames like 1H or 4H, while positional traders analyze the 1D or 1W time frame. Similarly, there are “scalpers” who trade the 1-minute and the 5-minute time frames. Note that scalpers are different from day traders, as they do not consider the 15-minute or 1H time frame for their analysis.

What is Scalping in Forex?

Scalping is a type of real-time technical analysis, where traders make several trades in a small period. Scalping involves entering and exiting from the market within a few minutes and moving on with the subsequent trade. This type of traders aims for tiny profits rather than home runs.

Scalping is usually most popular among forex traders than those trading stocks and commodities. This is because the FX market is the most liquid and volatile market. Thus, traders make use of this benefit by extracting 10-20 from the market in a short time. Since scalping involves making of few pips on a trade, they are traded with big volumes.

Getting Started with Scalping in Forex

Now that we know the basics of Forex scalping, let’s discuss the analytical side of it and then understand some powerful scalping strategies as well.

Timeframe

The ideal time frame to the scalp is either 1-min or 5-mins. However, some traders get an outlook from the 15-min time frame too.

Take Profit and Stop Loss

The most critical part of scalping is to have a take profit and stop loss on every trade. Since you will be using the 1-min time frame, the profit or loss level should be within 5-10 pips. It is risky to keep the TP and SL greater than ten pips when the analysis is based on the 1-min time frame.

Volatility and Liquid

Volatility and liquidity are other vital points of consideration before scalping any market. Forex is indeed the best market to the scalp as it offers the needed volatility and liquidity. However, you must select the right pair to trade because not all currency pairs offer enough market volatility. There are pairs that barely move on the 1-min time frame, and thus traders must end up waiting several minutes on a trade. Hence, it is recommended to trade only major pairs and a few minor pairs.

Spread

Spread plays a major role in scalping as it greatly affects the P/L of the trade. For instance, let’s say the spread on EUR/USD is two pips. The pip value of the pair is $10. If one lot is traded, the expense of the trade would be $20. Now, if a trade yields you four pips, then the net profit would be $40 – $20 = $20. We infer that 50% of the profit gets deducted as a fee. Thus, scalpers always have an eye on the spread.

Forex Scalping Strategies

Scalping strategies are unlike strategies used by swing and positional traders. Scalpers do not wait for several confirmations before entering a trade. Instead, they aggressively enter after a couple of confirmations. Here are some scalping strategies made for non-conservative traders.

Scalping using Moving Average

This scalping strategy, two moving averages – the 5-period MA and the 20-period MA is used applied onto the 3-min charts. Let us understand the strategy with a couple of examples.

Firstly, we must have a look at the overall direction of the market. Note that this strategy is only for trending markets, not ranging markets. In the below chart of AUD/USD on the 3-minute time frame, we see that the market is in a clear downtrend.

Secondly, the five period MA must be below the 20-period MA. When the price action tries to break above five-period MA (yet below the 20-period MA) and falls back into MA, we can open short positions.

The stop-loss must be placed above the high of the candle that broke below five-period MA. One must exit the trade when the price reaches up to 1:1 risk-reward or at a profit of 5 pips.

Scalping using price-volume charts

Indicators are not a must to scalp in forex. Scalping is possible solely using price action concepts. And here is a strategy for the same. This strategy works on a small time frame used on any currency pair. However, we’ll be sticking to the 3-min time frame for all the strategies.

Below is the chart of AUD/USD on the 3-minute time frame. According to the strategy, we can take entry when the market breakthrough a range strongly with high volume. In the below example, we see that the price fiercely broke above the range with high volume too. This is a confirmation that the big buyer is back into the market. Thus, we can take a long position right after the candle closes above the range.

The stop-loss can be placed below the low of the candle that broke through the range and places the take profit at a 1RR ratio. Note that, the stop-loss and take profit must exceed above 10-12 pips.

Scalping using Support and Resistance

Scalping at support and resistance levels is the most popular technique in the forex industry. Yet most traders apply it illogically. Even though the textbook says to buy at the support and sell at resistance, it cannot be applied practically incorporated in the market as there is a pinch of psychology in it. According to this strategy, one must buy at support and sell at resistance only if there is a false breakout prior to it.

Consider the below chart of NZD/CAD on the 3-minute time frame. The gray ray represents the support level. It is seen that the price broke below the support thrice and came right back above it. Thus, one can enter when the price is holding above the resistance post the fake-out. The stop-loss and take-profit for all such trades much be a maximum of 5 pips.

We hope you found these strategies interesting and helpful. If you are an aggressive trader, do try them out and let us know the results in the comment section below.

Categories
Forex Basic Strategies

Heard Of The ‘Piranha’ Forex Trading Strategy?

Introduction

The forex market is mostly seen to move in a trend or a range. In the previous article, we discussed the rapid-fire strategy, which works best in a trend. The piranha strategy that we are going to discuss is used in a ranging market.

Everyone would have heard of piranhas. They typically take small bites frequently off their prey until it is totally devoured. A single bite may not cause much harm, but it is the frequency of bites that causes the attack to be deadly. In the same way, the piranha strategy was developed to allow scalpers to bite the market and chew off small profits each time.

This strategy is specifically designed for the GBP/USD currency pair, where it is applied to the 5-minutes time frame chart. On average, one can find over 15 trades in a day using the piranha strategy.

Time Frame

The piranha strategy is useful for trading on the 5-minutes time frame. This means each candlestick on the chart represents 5 minutes of price movement.

Indicators

For this strategy, we use the Bollinger band technical indicator with the following settings.

  1. Period 12, Shift 0
  2. Deviation 2

When prices approach the upper band, the market is considered to be overbought, and when prices approach the lower band, markets tend to consolidate. By setting a higher deviation value, the price volatility will be magnified, and we geta a Bollinger band with wider upper and lower bands.

Currency Pairs

The strategy is designed for the GBP/USD currency pair, which is also referred to as The Cable. However, some other currency pairs in which the strategy can be used include EUR/USD, USD/JPY, and GBP/JPY. Since the strategy takes place in short timeframes it is advisable on highly liquid pairs.

Strategy Concept

We will use the Bollinger band indicator to identify the trading range of GBP/USD, after which we will mimic the nature of the piranhas by defining objective entries for long and short positions. Long trades are initiated when market prices touch the bottom of the band, and short trades are taken when prices touch the upper band.

Piranhas are active in rivers and ponds but not in the rough seas with strong currents and waves. In a somewhat similar way, we avoid trading this strategy at times of major news announcements during the U.S. or London sessions, as such environments reflect rough seas with strong currents and waves. We will analyze the GBP/USD currency pair on the 5-minutes chart to look for long and short trades.

Trade Setup

Step 1

The first step of the strategy is to first look for a range on the chart of GBP/USD. The range can be identified using the Bollinger band strategy. However, we need to apply the concepts of price action for the identification of the range. The essential criterion for a range is that the price should respect the support and resistance levels at least twice. After we have identified the range, we will apply our strategy at the extreme ends of the range to take a suitable position in the pair.

The below image shows an example of the kind range that is required for the strategy.

Step 2

The next step is to wait for the market to hit the lower band of the indicator or upper band of the indicator. At the lower band, we will look for buy opportunities, and likewise, if the price at the upper band, we will look for sell trades.

In this example, we see that the price has approached the lower band, which means there is a high chance that buyers will take the price higher from this point.

Step 3

One should not enter the market soon after the price touches the lower or upper band, which carries a huge risk. We need confirmation from the market before we can take a suitable position. In this step, we look for that confirmation. Once the price closes above the middle line of the Bollinger band indicator, it is a confirmation that the support is respected this time and that the price is heading at least till the range’s resistance.

Step 4

In this step, we determine the take-profit and stop-loss levels for the strategy. We have two take-profit levels – the first take-profit is set at the upper side of the range, a typical place for booking profits. Another method is to hold on to the trades until the market shows signs of reversals, which is when the price falls below the middle line of the Bollinger band.

The stop-loss for this strategy is placed below the support of the range or below the lower band. The trade offers a risk to reward ratio of around 1 to 1.5, which is not bad.

Strategy roundup

In the beginning, we mentioned that the piranhas hunt their prey until it is completely devoured. In a similar way, once the trade hits our stop loss, it means there is nothing left, and we need to look for a new setup.

The triggering of stop loss is an indication that the market is no longer trading in that band, and it has started a new trend. In such cases, wait until the market halts and starts moving in a range. The only difference will be that we will be looking for a trade in the opposite direction with the same rules.

This is an important point and a trick that one can use to navigate themselves in trending markets. As the strategy is developed to trade in a range, one will find few opportunities when the market goes into a strong trend.

Categories
Forex Basic Strategies

Trading The Forex Market Using The ‘Bladerunner Strategy’

Introduction

Moving averages are an important piece in analyzing the charts. Some traders simply use to determine the direction of the market, while others have solid trading strategies. The Bladerunner strategy is a powerful trading strategy based on the 20-period Exponential Moving Average (EMA). The best part about the strategy is that it can be applied to any time frame and currency pair. This strategy is given the term “Bladerunner” because the 20-period EMA cuts the price action like a blade.

What is the Bladerunner Forex Trading Strategy?

A market trading above the 20-period EMA indicates a bullish bias, while a bearish bias if it is trading below the 20-period EMA. If the price retests the EMA, traders look to long or short.

If the price is trading above the EMA, one can prepare to buy the currency pair once the drops and tests the EMA line and bounces back up. That said, if the market breaks below the 20-EMA, it can be comprehended as the market has switched directions – uptrend to a downtrend. Thus, traders can look for shorting opportunities.

On the flip side, if the price action is evidently below the EMA, traders may consider short selling the pair after the price retraces up to the EMA. However, if the market manages to break through the 20-EMA, it signifies that the buyers have taken charge of the market, and a potential reversal could happen. Thus, traders can catch the new trend after a proper test to the EMA line.

Criteria to trade the Bladerunner Strategy

Before taking an entry using the Bladerunner strategy, two criteria must be satisfied:

  1. Before entering based on the strategy, the price must breakout from a range or should already be in a strong trend.
  2. After the first criterion is satisfied, the price must successfully retest the 20-EMA. If the market is trading above the EMA, the test should be such that the price drops to the EMA, touches it, and reverses in the predominant trend. Finally, if the candle closes above the EMA, it is an indication that the uptrend is still active and intact. A similar concept applies to a downtrend as well.

These two points are vital to consider before attempting to trigger the order. Besides, traders who require more confirmation may trade those setups where the price bouncing off from the EMA is also a strong Support and Resistance level or a pivot point.

Trading the Bladerunner Forex Trading Strategy

The Bladerunner strategy can be traded in several ways, given the concept applied remains the same. Novice traders enter solely based on the EMA, while more professional traders combine this idea with their analysis and then execute their trade. Here are a couple of Bladerunner strategies designed for traders of all suites.

Buy Example

Below is the price chart of GBP/NZD on the Daily time frame with the 20-period EMA applied to it.

Reading the chart from left-most, it is observed that the market has been moving sideways in a range. During mid-May, the market finally broke above the top of the range. Also, the breakout happened such that the price was well above the 20-period EMA.

At the beginning of June, the market pulled back down to the EMA and left two tails at the bottom. This is an indication that the market is preparing to go north. Thus, a trader can go long as the holds for a couple of candles above the EMA.

Placements

Stop loss

The stop-loss must be placed few pips below the top of the range such that it is below the EMA as well.

Take Profit

There is no fixed take profit point for this strategy. However, the trade can be closed when the price drops below the 20-period EMA.

Sell Example

Below is the price chart of EUR/USD on the 4H time frame. Initially, the market was ranging, but later it was pushed down by the sellers. After the breakout, the price retraced and tested the EMA as well as the S&R. When the sellers pushed the market down yet again, it is an indication that the downtrend is going to continue.  Thus, one can prepare to go short at these levels.

Placements

Stop loss

The stop loss can be placed safely above the Support and Resistance and the bottom of the range.

Take Profit

Since there is no reference to the left, there is no fixed take profit. However, traders must liquidate their positions once the market crosses above the 20-period EMA.

Bonus Example

Consider the below price chart of AUD/USD on the Daily timeframe. We see that the overall trend of the market is down. The level 0.68745 represents the most recent Support and Resistance area.

To trade this market, we wait for the price to retrace up to the S&R level (grey ray) before entering the trade. Below is the same chart of AUD/USD on the 4H time frame. The pullback for the massive downtrend began in September. Observe that the price action of the retracement is above the 20-period EMA.

Once the price approaches the Daily S&R, it begins to consolidate, yet above the EMA. Later, as the market slows down, the price aggressively drops below the 20-period EMA. The price then retests the EMA, tries to go above it, but gets drawn down by a bearish candle. Thus, when another bearish candle appears, one can short sell the pair.

Placements

Stop loss

Since the market took a turnaround at the S&R level, the stop loss can be placed right above this level. Besides, one should ensure that the stop loss is above the EMA.

Take Profit

This strategy is basically a trend pullback trade that incorporates the Bladerunner strategy. Thus, the take profit can be placed at the recent lows.

The Bladerunner is a great strategy and helpful to several traders because it blends with any other strategy. Do try this strategy by combining it with your primary strategy and level up your trading skill. Cheers!

Categories
Forex Price Action

How Market Tests You and What You May Learn from It

In today’s lesson, we are going to demonstrate an example of a daily-H4 chart combination trading, which has a good lesson to give us. Usually, daily-H4 combination traders look for a strong reversal candle in the daily chart. Then, they flip over to the H4 chart to trigger entry upon consolidation and a signal candle. We get all these in our today’s example, but the price acts a bit differently after triggering the entry. Let us proceed to find out what happens there.

It is the daily chart. The chart shows that the price produces a bullish engulfing candle at a level of support where the price bounces several times. The combination traders may flip over to the H4 chart now and wait for the price to consolidate and produce a bullish reversal candle.

This is how the H4 chart looks. It looks very bullish. The last candle comes out as a bullish candle closing within a level, where the price gets rejection twice. The pair may consolidate here.

The pair produces a bearish engulfing candle. This is a strong bearish reversal candle. However, the H4 buyers must not lose their hope since the last daily candle comes out as a bullish candle. They must wait with hope.

The next candle comes out as a bullish engulfing candle closing above the level of resistance. The buyers may go trigger a long entry right after the last candle closes by setting stop loss below consolidation support and by setting take profit with 1R. Typically, this is an ideal price action to go long for the daily-H4 chart combination traders. Let us proceed to the next chart to find out what happens next.

The next candle comes out as a bullish pin bar. Look at the lower shadow. The price is about to hit the stop loss. However, if the stop loss is set here accordingly, the entry is safe. Nevertheless, the last candle comes out as a surprise for the buyers. It has three lessons to give us. We will learn them in the conclusion. Meanwhile, let us find out how the entry goes.

The price then heads towards the North with a moderate pace and hits the target. The combination traders make some profit out of the trade. It is good. Let us now find out what those three lessons are.

  1. Look at the daily chart again. See the price consolidates within two horizontal levels. There are two resistances. It means the price does not have enough space to travel towards the North as far as the daily chart is concerned. It may have held some buyers in the H4 chart back to go long in the pair.
  2. Set your stop loss accordingly with some safety pips as well.
  3. Be patient. If a trade does not go according to your expectation, do not panic.


Categories
Forex Course

137. Differentiating between a Retracement and a Reversal

Introduction

Broadly speaking, there are three states in the market – trend, range, and channel. If we were to go a little more in detail, a market has components like retracement and reversal. Identifying and differentiating between a retracement and reversal is a skill in itself. In this lesson, let’s go and understand what these terms mean and how to differentiate them.

What is Retracement?

Retracement is the terminology usually associated in a trending market. We know that in a trending market, the price moves in one specific direction. For instance, an uptrend is defined as a sequence of higher highs and higher lows. As per the definition of an uptrend, the prices do not keep moving higher and higher continuously.

After trending up to a certain point, the price temporarily moves in the opposite direction. This movement against the original trend is referred to as retracement. Technically, the price action from a higher high to the higher low is called a retracement.

Uptrend Example

Downtrend Example

What is a Reversal?

A reversal can be defined as the overall change in the direction of the market. A market can reverse from an uptrend to a downtrend, or from a downtrend to an uptrend.

Reversal to the Upside

In this type of reversal, initially, the market trends in a downtrend making lower lows and lower highs. Later, the market goes into a transition state where the price typically ranges for a while. In other words, the price stops making lower lows and lows highs. Instead, it makes equal lows or higher lows. Finally, the market starts to trend north by making higher highs and lower lows.

Reversal to the Downside

This reversal happens when the market transits from an uptrend to a downtrend. In an uptrend, the price makes higher highs and higher lows. But, when the trend begins to diminish, the higher highs turn into equal highs, and higher lows start to become equal lows. Finally, when the seller’s pressure comes in, the price begins to make lower lows and lower highs, forming a downtrend. Thus, the complete scenario is referred to as a reversal.

Predicting a possible reversal or retracement in the market is pretty challenging. If you’re stuck in a position and unsure if it is a retracement or a reversal, you may try the following options to manage the trade:

  • Hold onto your positions by keeping the stop loss as it is. If it is a retracement, you can ride the trade, else get stopped if it is a reversal. This is the simplest approach.
  • If you are more inclined towards a reversal than a retracement, then you may close your positions. Based on where the market breaks through, you can look for re-entry. But, you might have to compromise on the risk: reward.
  • You could close the entire position and stay away from the pair and look for other opportunities. This is the safest option possible, especially for conservative traders.
[wp_quiz id=”79176″]
Categories
Forex Course

125. Trading The ‘Crab’ Pattern Like A Pro

Introduction

Crab is the last pattern that we are going to discuss in the harmonic group. Just like other patterns, the Carb is also identified and traded using the Fibonacci levels in order to determine the precise turning points. The Crab is a reversal pattern and is composed of four legs – XA, AB, BC, and C-D. Let’s understand them in detail below.

The Four Legs Of Crab Pattern

XA – In its bullish version, the first leg forms when the price action rises sharply from the point X to point A.

AB – The AB move goes against the actual market direction and retraces between 38.2% to 61.8% of the distance covered by the XA leg.

BC – In the BC leg, the price action resumes its original direction and retraces between 38.2% to 88.6% of the distance covered by the AB leg.

CD – The CD is the final leg that confirms the formation of the Crab pattern. Place the sell order when the CD leg reaches the 161.8% Fibs extension of the AB leg.

Trading The Crab Pattern

Bullish Crab Pattern

In the below GBP/USD Forex pair, we have identified the formation of the Crab pattern. The first movement XA can be considered any random bullish move. The second leg AB was a counter-trend, and it reached the 61.8% Fib leg of the XA leg. For the third move, price action goes up, and it retraces 38.2% of the XA leg. The last leg was the CD move, which 161.8% of the AB leg. The fourth leg confirms the pattern formation on the price chart.

We activated our trade at point D with stops below point D and taking profit at point A.

Bearish Crab Pattern

The price chart below represents the formation of a bearish crab pattern on the price chart. The first leg XA was the random move, and second leg AB goes up, and it retraces at 38.2% of the XA leg. The next third leg was the BC move, and it retraces 88.6% of the AB move. The last leg CD was the decision-making move, and it closes at 161.8% of the AB leg.

The trade activation was at point D, and the stop was a bit above the trade, and to book profits, we opted out for the most recent lower low.

Conclusion

The Crab pattern rarely appears on the price chart, but when it does, it provides excellent risk to reward ratio trades. If you are new to harmonic trading, practice trading this pattern on a demo account first and only then trade on the live account. Always remember to trade the Bearish Crab pattern in an uptrend, and Bullish Crab patterns in a downtrend only. Cheers!

Categories
Forex Basic Strategies

Pro Scalping Technique By Combining Stochastic With Bollinger Bands

Introduction

Scalping is a trading strategy that helps traders to take advantage of minor price movements on lower timeframes. It is one of the quite popular ways of trading the Forex market. There are many successful scalpers who make a lot of money by scalping the minor price moves. To be a scalper, we must be emotionally intelligent and have the ability to make quick decisions.

Scalpers place anywhere from 0 to a few hundred trades in a single day. Ideally, smaller movements in price are easier to catch compared to the longer moves. Typically while day trading, if the win/loss ratio is less than 50 percent, traders still make money. On the other hand, in scalping, it is critical to win most of the trades. Otherwise, we will end up on the losing side.

Stochastic Oscillator

Stochastic is a wonderful indicator developed by George C. Lane in late 1950. This indicator doesn’t follow the price or volume like other popular indicators in the market.  Instead, it follows the speed and momentum of the changes that occur in price before the trend formation. Stochastic is a range bounded indicator, and it oscillates between the 0 and 100 levels.

Typically, a reading above 80-level is referred to as the overbought signal, and a reading below the 20-level indicates an oversold signal. The Stochastic indicator consists of two lines, where one reflects the actual value of the indicator for each session, and another reflects its three-day simple moving average. The intersection of these lines indicates the reversal in price action.

Bollinger Bands

Bollinger Bands is a technical indicator developed by John Bollinger in the 1980s. It is a leading indicator, and it consists of two bands and a centerline. Out of the two bands, one stays above the price action, and the other stays below. Both of these bands contract and expand depending on the market’s volatility. When price action hits the lower band, it indicates a buy trade, and when it hits the upper band, it indicates a sell trade.

The Strategy

The strategy we are going to discuss is one of the most basic but effective scalping strategies ever used in the market. The idea is to apply both indicators (Bollinger Band & Stochastic) on the price chart. When the price action hits the lower Bollinger band, and the Stochastic is at the oversold area, it is an indication for us to go long. Conversely, when the price action hits the upper Bollinger band and if the Stochastic is at the overbought area, we can go short.

In the chart below, we can see that our strategy has generated a few buy/sell signals in the EUR/AUD Forex pair. The price action was in an overall uptrend. When both of the indicators gave us the signal, we took both buy and sell entries accordingly. In the chart below, the buy trades have given us some good profits, but in the sell trades, the profit was comparatively less. Always remember that these things are quite common in scalping. If you are an aggressive scalper, trade both buy sell signals. But if you are a trader who prefers to scalp the market with the trend, follow the next strategy.

Scalping The Market By Following The Trend

Buy Example

The chart below represents an uptrend in the EUR/AUD Forex pair. As you can see, by following our strategy, this pair has given us three buy signals, and all the trades were quite healthy and have performed well in the market. If you scalp the market by following the trend, it is easy to make big gains. For scalping, it is required to put smaller stops. Hence, always go for 4 to 5 pip stop-loss and 10 to 15 pip target. You can also exit your positions when the price hits the upper Bollinger band.

Sell Example

The below 3-minute chart of the GBP/JPY forex pair represents a couple of sell trades. As you can see, all the sell trades in this pair performed very well. We can also observe that every time the price action prints a brand new lower low. We took all the five selling trades on a single trading day, an all of them hit the take-profit range. So if we scalp the market by following the trend, it will be quite easy to make some profits from the market. The red arrows on the Stochastic and Bollinger Band indicators represent the sell signals.

Scalping The Ranges

Just like the trends, it is easy to scalp the ranges as well. In fact, the ranges are even easier to scalp than the trend because the support and resistance lines of the range offer extra signals for us. For ranges, all you need to do is to hit the sell when price action hits the top of the range and hit buy when prices hit the range bottom. If you add the Bollinger Bands and Stochastic indicator, the signals generated by the market will be stronger.

The chart below indicates a couple of buy/sell signals in the GBP/JPY 3-minute Forex chart. As you can see, we have gone long when prices hit the bottom of the range, combined with our strategy. The same applies to the sell-side. We have gone short when the price action hits the top of the range while respecting our strategy rules.

Conclusion

Scalping trading involves entering a trade for a shorter period of time to take advantage of small price fluctuations. When you enter a trade, it is advisable to risk lesser money and place as many trades as you can. We must have control over our inner greed and aim for smaller targets. In the beginning, it will be difficult for you to scalp the market as the smaller timeframes move way faster. You need to train your eyes a bit to understand the lower timeframes properly. Always try to scalp with a bigger trading account because the trading commissions can quickly eat up the smaller accounts.

Categories
Forex Daily Topic Forex Price Action

The H1-15M Combination Trading in a Bearish Market

In today’s lesson, we are going to demonstrate an example of the H1-15M combination trading strategy offering a short entry. In one of our previous lessons, we demonstrated an example of a long entry. Let us see how it ends up offering us the entry.

This is an H1 chart. The chart shows that the price gets caught within two horizontal levels. The chart shows that the price after getting the last rejection has been heading towards the South. The sellers are to wait for a bearish breakout to go short in the pair.

Here it comes. The last candle breaches the level of support closing well below it. The H1-15M combination traders may flip over to the 15M chart to get a bearish reversal candle for triggering a short entry. Let us flip over to the 15M chart.

This is how the 15M chart looks. As expected, the last candle comes out as a bearish candle. If the next 15M candle comes out as a bearish candle closing below the last candle, the sellers may trigger a short entry. If the chart consolidates, the sellers are to wait for a 15M bearish reversal candle to take the entry. Let us find out what happens here.

The chart produces a bullish corrective candle. The sellers are to wait for a bearish reversal candle to go short in the pair. Usually, if the price makes a correction, it goes towards the breakout level and produces a reversal candle there. Let us find out where it produces a bearish reversal candle for the sellers.

The chart produces a bearish engulfing candle closing below consolidation support. The sellers may trigger a short entry right after the last candle closes. Stop Loss and Take Profit are to be set according to the H1 chart. Stop Loss is to be set above H1 horizontal resistance before the breakout, and Take Profit is to be set with 1R. Let us now find out how the entry goes.

This is the H1 chart. We see that the price heads towards the South with good bearish momentum and hits the target of 1R with ease. After producing the 15M bearish reversal candle, the price never looks back but goes towards the trend’s direction. This is what usually happens in the H1-15M combination trading. The price heads towards the trend’s direction without wasting time.

Do a lot of backtesting in your trading chart to find out some entries based on the H1-15M chart. Then, do some demo trading with the strategy before going live. It will help you be a better trader.


Categories
Forex Basic Strategies

How To Trade The ‘Double Top’ Chart Pattern Like A Pro

Introduction

There are some patterns in the market that are widely used by traders across the world, and the Double Top is one of them. It is a simple and straightforward method of identifying the potential selling trades in any given Forex pair. Most of the novice traders who trade this pattern tend to face problems as they do not know how to use it correctly. Hence, for those types of traders, we are putting this piece together. By the time you finish reading this article, you will exactly know to identify and maximize gains using the Double Top chart pattern.

Double Top Pattern

The Double Top is a bearish reversal pattern that is usually formed at the end of a bullish trend. The two consecutive rounding tops complete this pattern with approximately the same highs. The first rounding top should be formed at a significant resistance area. Most of the time, the momentum of the second round top is quite weak, and this indicates the buyers are getting exhausted.

This eventually means that the sellers are now going to take control. Both the round tops retrace at a significant support area, which we call the neckline. The identification of this pattern can be comprehended as the professional traders and investors trying to obtain the profits from the bullish trend. And now, the markets are ready to publish a new selling trend.

Psychology Behind The Double Top Pattern

We know that the Double Top pattern occurs at the major resistance area. This pattern indicates when the price action reaches a significant resistance area, the buyers are now afraid to buy because of resistance. On the other hand, the sellers are hitting the sell orders at the same resistance area.

At this point, when the price action is pulled back to a significant support area, which we called the neckline, it shows that the buyers are now buying again at major support areas to print brand new higher high. However, when the price action reaches the resistance area again, buyers fail to print a brand new higher high. As a result, they start to book the orders, and now the sellers are gaining control. Hence the price action tends to move in the opposite direction.

Double Top Pattern – Trading Strategies 

There are several ways to trade the Double Top chart pattern. But the strategies we are going to share here are well-proven methods. Also, we have backtested these strategies time and again to make sure they are accurate.

Double Top Pattern + Bearish Candlestick Patterns

There are various bearish candlestick patterns that are widely used by the traders in the market. For this strategy, you can use any of the bearish candlestick patterns. Some of the most commonly used bearish candlestick patterns are Bearish Engulfing, Evening Star, Shooting Star, Hanging Man, Three Black Crows, etc.

The idea is to identify any of the above mentioned bearish candlestick patterns near the second peak. If you find any of these patterns, you can go short. Make sure to place the stop-loss above the resistance line. We can place two or more TP orders. First, take-profit must be at the neckline, whereas the second one can be placed two times above the size of the pattern formed.

Identifying the Pattern

In the below EUR/JPY chart, we have identified the formation of a Double Top pattern.

Entry

As we can see in the below chart, the price action prints a Bearish Engulfing candlestick pattern right after the second top. This indicates that the sellers have completely absorbed the buyers, and now it’s time to go short in this pair. We took a sell entry at the close of the Bearish Engulfing candle.

Stop-Loss & Take-Profit Placements

As we can see, we have entered the market at the closing of the Bearish Engulfing candle and placed the stop-loss just above the resistance line. This pattern has the highest odds of working in our favor; hence we can go with smaller stop-loss. Because, whenever this set-up is found, the price action has a very little chance to spike.

As discussed, the first take-profit was placed at the neckline of the pattern, and the second take-profit was placed double the size of the complete pattern. But, please decide the placement of TP according to your trading style. Remember that you can close your position wherever you want.

Double Top Pattern + RSI

In this strategy, we have paired the Double Top pattern with the RSI indicator to identify accurate shorting signals. As you might have probably known, RSI stands for the Relative Strength Index. It is a momentum indicator developed by the J. Welles Wilder Jr. in 1978. This indicator oscillates between the traditional levels of 70 and 30. When this indicator reaches the 70 level, it indicates that the market is in an overbought condition, and it indicates the market is oversold when the indicator reaches the 30 level.

Here, the strategy is simple. When the price action hits the second peak and starts to struggle, see if is the RSI is at the overbought market conditions. If it is, then it can be considered a potential sell signal.

Identifying the Pattern

We have identified a Double Top chart pattern in the below GBP/CHF Forex pair.

Entry

In the below chart, we can see the first peak and second peak of the pattern being quite strong. When the price action approached the second peak, it dropped immediately. This shows that the buyers are exhausted, and sellers took over the show. At the same time, we can also see the RSI giving a sharp reversal in the overbought area. Hence we can confidently go short in this pair.

Stop-Loss & Take-Profit

We went short when the criteria are fulfilled and placed the stop-loss just above the entry. Take-profit was placed at the higher timeframe’s support area. Overall, it was a 100+ pip trade. If there is no significant support area for you to exit your positions, you can close them when the RSI reaches the oversold area.

Conclusion

Pattern trading is the easiest way to make more profits in the market. Some patterns provide a great risk to reward trades, and some do not. The Double Top is one such pattern that offers some of the best risk-reward entries. This pattern works well on all the trading timeframes. Make sure to know the logic behind this pattern before trading so that any potential mistakes can be avoided. All the very best!

Categories
Forex Basic Strategies

Making Consistent Profits with ’10 Pips A Day’ Forex Strategy

Introduction

There is a lot of buzz in the Forex industry about the ten-pip a day strategy. We have seen both experienced and novice traders getting excited about this strategy. So we decided to talk in detail about this topic in today’s article. Some expert traders believe that it’s not possible to make ten-pip consistently in the market, while many others say it is possible.

In reality, it entirely depends on the person’s trading skills, mindset, and experience. Traders need to adapt themselves to the market situations to be successful. Making ten-pip a day is a great way to accumulate wealth in the Forex market, and it is easily possible. All we need is to master our skills to the point where we exactly know when to take a trade and when not to.

Statistics say that it’s not easy to make consistent money in the Forex market, and the losses are a part of the game. This is true to an extent, but if we practice this strategy enough on a simulator, we can easily make ten pips a day no matter what. In this article, let’s understand how to make ten pips per day in the Forex market by using five different buy and sell examples of five trading days in a week.

Trading Strategy For Making 10 Pips A Day

’10 Pips A Day’ – The idea behind this term is to stop trading for the day right after making ten pips that day. Also, it is up to you to follow this idea or not. You can stop trading after making ten pips, or you can ignore that and go for 20, 30, or even 100 pips a day according to the market situation.

But only go ahead if you are 100% confident about the markets. In case of any tiny bit of uncertainty, make sure to exit right after you make ten pips. One critical aspect of this strategy is selecting the currency pairs. One must be professional enough to understand the market situations and pick the pairs where there is a minimum potential of making ten pip profits.

Pairing The Bollinger Bands With The Stochastic Indicator

Rules For Going Long
  1. The market must be in a strong uptrend.
  2. Wait for the price action to slowdown at the lower Bollinger Band.
  3. Let the Stochastic Indicator reverse at the oversold area.
  4. Only go long if the above two rules are satisfied. Also, consider the momentum of the price.
  5. Place the stop-loss just below the lower Bollinger Bands.

Now, to understand how this works, we have taken five different trades for five trading days in the last week of Feb 2020 and have generated 10, 20, and 30 pips in the market successfully. According to this strategy, conservative traders must stop trading after making ten pips for that trading day. But, if you are an aggressive trader, go ahead for bigger targets. Let’s get into the examples.

Monday Trade

The below chart represents a buy trade in EUR/CAD Forex pair. When all the rules mentioned above are met, we took a long position in the New York Session on 24th Feb 2020. Our stop-loss is placed right below the lower Bollinger Band.

We have gone for three different targets according to the market situations and predominant S&R levels. As mentioned, exit the trade as soon as you make ten pips if you are a conservative trader.

Tuesday Trade

For the second day, we have picked the EUR/AUD Forex pair as we identified some potential market moves. We have gone long on this pair in the New York session on 25TH Feb 2020. We can clearly see both the indicators indicating a clear buy signal.

Here, we have gone for the third target and exited the trade as soon as we made 30 pips.

Wednesday Trade

Our third trade was in the EUR/CAD Forex currency pair in the Asian session on 26th Feb 2020. When prices hit the lower Bollinger bands, and the Stochastic indicated the oversold market conditions, we went long on this currency pair.

We would have exited the trade at ten pips, but the market started printing continuous bullish candles, which made us wait for the prices to hit the third target.

Thursday Trade

On the 4th day (27th Feb 2020), we took a long position in the AUD/NZD Forex pair. The entry was at the point where the prices touched the lower Bollinger Band, and the stop-loss is placed just below the recent low.

Since the higher highs were getting continuously printed, we went for the third target and exited the trade as soon as we made 30 pips.

Friday Trade

For the Friday trade, we chose the AUD/NZD Forex pair. We went long in the Asian session on 28th Feb 2020. When both the indicators lined up in one direction, it is a clear indication that the sellers have given up, and now it’s time for buyers to lead the market.

We had exited at the third target even when the market was moving up north.

 Rules For Going Short
  1. The market must be in a strong downtrend.
  2. Wait for the price action to slowdown at the upper Bollinger Band.
  3. Let the Stochastic Indicator reverse at the overbought area.
  4. Only go short if the above two rules are satisfied. Also, consider the momentum of the price.
  5. Place the stop-loss just above the upper Bollinger Band.

Monday Trade

The below chart represents the first sell trade we took in the NZD/JPY Forex pair on the 24th Feb 2020. We went short when the price action hit the upper Bollinger band, and the Stochastic indicated the overbought conditions.

The stop-loss is placed just above the upper Bollinger Band. We have gone for the third target, and the market printed a brand new lower low.

Tuesday Trade

The below image represents the USD/CHF Forex pair. This pair was in an overall downtrend, and on 25th Feb 2020, we have activated the sell trade right after our sell criteria is met.

We can see the market reaching all of our targets in just a couple of hours.

Wednesday Trade

For the third day, we have chosen the USD/CHF Forex pair to identify the sell opportunities on 26th Feb 2020. The entry was at the point where the price action touched the upper Bollinger band, and the stop-loss was just above the upper band.

The reason we place the stop-loss there is because of the bands of the indicator act as a dynamic support resistance level to the price action.

Thursday Trade

The 4th trade belongs to the CAD/JPY Forex pair, and we have activated our sell trades on 27th Feb 2020. We took sell when both of the indicators lined up in one direction, and we booked profit at the third target.

Friday Trade

For the last sell trade, we chose CAD/JPY currency pair. Sell trade was activated on Friday, 28th Feb, in the Asian session. When the Stochastic reached the overbought area and gave a sharp reversal, we saw the price action hitting the upper Bollinger band. This essentially means that the market is ready to go down.

Bottom Line

In almost all of the cases, we have gone for the third target only and make 30 pips profits. The reason behind this is to show you how reliable is the Bollinger Band and Stochastic combination. We are saying this time, and again, please stop trading after making ten pips per day if you are a conservative novice trader. But if you are experienced enough to predict the market, milk as much as you can depending on the market conditions. All the best.

Categories
Forex Course

68. Using Fibonacci Retracements To Place Appropriate Stop-Loss

Introduction

Until now, we have paired the Fibonacci levels with various technical tools to find appropriate trading opportunities. Some of them include support/resistance, trendlines, and even candlestick patterns. In the previous lesson, we also saw how to place appropriate ‘take-profit’ orders to maximize our profits. The uses of the Fibonacci levels do not end here. There is another incredible application of these levels, and that is to find the appropriate ‘stop-loss’ levels. ‘

As a trader, one should always use the ‘Stop-Loss’ orde as they are critical to avoid the risk of bearing huge losses. In some adverse situations, if this order is not used, it would result in a complete drain of trading capital where we can have the risk of losing everything in a single trade. Placing an appropriate stop-loss ensures that we do not expose ourselves to the unbearable risk.

However, placing the stop-loss order randomly might expose us to the risk of getting stopped out very early. So the proper placement of this order is crucial, and it can be hard for traders who aren’t experienced enough. So the Fibonacci tool can be a great help for us in determining accurate stop-loss levels.

Using Fibonacci Levels To Place Appropriate Stop-Loss Orders

In the below chart, we see a big initial move to the upside on which the Fibonacci levels are plotted using the Swing low and Swing high. Using the ‘Fibonacci strategy,’ we can notice a retracement that has reacted fairly well from the 61.8% Fib level, and now if the next candle is green, this could be a confirmation for us to go ‘long.’

We notice in the below chart that the next candle appears to be Green, and now with that confirmation, we can place our ‘buy’ trades with appropriate ‘stop-loss’ and ‘take profit.’ The traditional way of using a stop-loss order is to place it 50 pips away from the point of entry. Most of the novice traders use this method even today. This is said to be a layman’s approach with no suitable reasoning. When we use such methods, there is a high chance of we getting stopped out before the trade moves in our favor.

The below chart shows that how placing a 50 pip stop-loss can prove to be dangerous. We can see the stop-loss getting triggered by the immediate next candle after the entry was made.

Now let’s see how to place the stop-loss order using Fibonacci levels. The strategy is to place the stop-loss at the Fib level, which is below the Fib level from where the retracement reacts and gives a confirmation candle. Taking the above example, since the retracement touched the 61.8% Fib ratio and gave a confirmation candle, the stop-loss will be placed at the 78.6% Fib ratio. This seems to be very simple, yet most traders are not aware of this.

In the above chart, we can see how the price just misses our stop-loss placed at the 78.6 Fib level and later directly went to our take-profit. This shows the precision of stop-loss placement, which was established using the Fibonacci levels.

Conclusion

We must understand that stop-loss determination is a crucial step and has to be calculated mathematically using any reliable technical indicators. Indicators like Fibonacci have a mathematical approach in determining these levels. Make sure to use these levels before going to place your stop-loss levels next and let us know how they have worked for you. Cheers!

[wp_quiz id=”64961″]
Categories
Forex Daily Topic Forex Price-Action Strategies

When You Confront a Loss

In today’s article, we are going to demonstrate an example of a failed entry on the daily chart. In a bullish market, the chart produces a bearish inside bar followed by a perfect looking bullish engulfing candle closing well above the level of resistance. However, the price heads towards the South and hits the stop loss. We try to find out what goes wrong here.

The chart shows that the price heads towards the South with strong bearish momentum. The sellers are having a feast here. Any intraday breakout at the lowest low of the last daily candle may get the traders to go short on the respective chart. Let us proceed with what happens next.

The last daily candle comes out as a bullish inside bar. Intraday buyers may search for a long entry on any breakout at the highest high of the last daily candle. On the other hand, the daily chart traders are to wait for the next day’s candle to close as a bearish engulfing candle.

The price heads towards the North with good bullish momentum. The chart produces two more bullish candles after that inside bar bullish candle. The chart looks good for the buyers on the daily chart as well. If the chart produces a bearish reversal candle followed by a bullish engulfing candle closing above the level of resistance, the buyers may go long on the daily chart.

The chart produces an inside bar. This must excite the buyers. If the next candle comes out as a bullish engulfing candle closing above the resistance of this bullish wave, the buyers may trigger a long entry.

Here it comes. This is what the buyers wait for. They may trigger a long entry right after the candle closes by setting stop loss below the candle’s lowest low. The significant level of resistance is far enough, which offers them a tremendous risk-reward. Moreover, this is the daily chart, which is one of the most consistent charts in the Forex market. In a word, this is a good trade setup for the buyers.

The price hits the stop loss the next day. The daily candle one after it comes out as a bearish candle too. The chart looked extremely good for the buyers two days ago. Now things are very different. If we dig into it, we do not find anything particular that the chart misses to produce such bearish candles all of a sudden. Technically, there is nothing wrong with the entry. We must remember this is how the market goes. It happens a lot. We must learn how to absorb such an unpleasant incident.


Categories
Forex Price-Action Strategies

Trading on the Daily Chart: The Inside Bar May Disappoint You More Often

In today’s article, we are going to demonstrate an example of price action trading on the daily chart. In price action trading, a reversal candle or reversal pattern means a lot. Usually, the engulfing candle, track rail, morning start, or evening star are considered strong reversal candles or patterns in price action trading. On the other hand, the inside bar is not considered a strong bearish reversal candle. In the daily-H4 chart combination trading, an inside bar still may offer a good entry since traders take their final decision depending on the H4 chart. To trade on the daily chart, it may be a different case in most cases. Let us have a demonstration of this.

After being bullish for several daily candles, the chart produces an inside bar at a resistance zone. To trade on the daily chart, traders wait for the price to produce a corrective candle followed by another candle towards the trend’s direction. Over here, traders are to wait for a bullish corrective candle followed by a bearish reversal candle closing below the level of support to offer a short entry.

The chart produces a bullish inside bar. Things are going according to the sellers’ expectations. If the chart produces a bearish engulfing candle closing below the last candle’s lowest low, the sellers may trigger a short entry. Let us proceed to the next chart.

The last candle comes out as a bearish engulfing candle closing well below the level of support. The nearest swing low is far enough, which offers an excellent risk-reward. The sellers may trigger a short entry right after the last candle closes.

Things are not going according to the sellers’ expectations. Anyway, the sellers must be patient with the position. Let us proceed to the next chart and find out what the price does next.

The price consolidates for several candles. The last two candles look good for the sellers. However, the level of consolidation support is still held. Do not forget the point that the sellers have been holding the position for the last five trading days.

It makes the sellers wait longer and heads towards the North to hit the stop loss. Taking a loss or getting the stop loss hit is a usual incident in the Forex trading. However, if we dig into this case study, we find that apart from the trend-initiating candle, everything gets A+. In trading on the daily chart, an inside bar may get us a profit on many occasions. However, if we compare it with other strong reversal pattern or candle, the winning percentage may not impress us.


Categories
Forex Videos

Forex Stop Loss Hunting – Don’t Get Caught Out! Recognise The Signs!

Stop Loss Hunting

Often in a range-bound market – where traders seek direction, because of a lack of fundamental news flow, or a lack of market sentiment – we see price action which tends to drift in either direction and in small increments. That is to say, the size of the candlesticks are small, usually no more than 10-15 pips. Sometimes these types of trends present opportunities to traders who are looking to take advantage of triggering stop losses.

Professional traders, and in particular institutional size traders, who trade in large lot sizes, and who have the most to lose if the trade goes against them, tend to put their stop losses a couple of pips underneath the lowest point of the preceding candlestick when they buy a currency pair, or a couple of pips above the previous high of a candlestick if they intend to go short. Tight stops such as these minimize losses for traders who trade in large amounts.
And because professional and institutional traders tend to trade the same way overall, they know where stop losses are placed. It is important to add that professional and institutional size traders tend to use the 15 minute, 30 minute, and higher time frames for their technical analysis. This presents opportunities for all traders, including retail traders, to keep their eye out for stop-loss hunters.

Example A


Let’s take a look at example A, to see how this might play out in a real scenario. This is a fairly typical price action chart that you will see almost every day in the forex market. On the left-hand side of the screen, we can see eight small bull candlesticks of around 5 to 10 pips in size with small or no wicks, and where price action tends to just almost drift higher. Because the candlesticks are small in size, it means we have a series of 8 fairly closely situated stop losses, and we know that these stop losses are likely to be institutional size, because they are on a larger time frame, including or above 15 minutes.
Candlestick A, is a bearish reversal pattern, followed by an engulfing bear candle that will have triggered three stops in this example. The warning is pretty much written on the wall for other long traders who bought the upward move, and some will begin closing out trades while the rest are in danger of being stopped out.
When stop losses are triggered under these circumstances, they can create a void, and especially in a pair where there is a lack of overall bias, fundamental reasons, or sentiment, and this void may see an acceleration in counter price action direction.
Of course, this setup also works in the opposite direction. So look out for and be on your guard for similar setups.

Categories
Forex Basic Strategies

Identify Reliable Trading Signals Using ‘Piercing Line’ Candlestick Pattern

Introduction

The Piercing Line is a simple and effective candlestick pattern, and it is used to trade the bullish reversals in the market. This pattern typically appears in a downtrend. Also, when it appears in a significant support area, we can consider it more reliable. Piercing Line is a two candlestick pattern where the sellers influence the first candle, and the second candle is responded by enthusiastic buyers. Piercing Line essentially indicates the bears losing control, and bulls taking over the market.

  1. First of all, in a downtrend, the first candle of the pattern should be bearish.
  2. The second candle should be bullish, and it should open lower than the closing of the previous candle, and it must close above the midpoint of the bearish candle.

This indicates that buyers now overwhelmed the sellers. In terms of supply-demand, this pattern shows that the supply is depleted somewhere, and the demand for buying has increased. Remember not to trade this pattern alone. Always use it in conjunction with some credible indicators or other trading tools to further enhance the probability of winning.

Piercing Line Pattern Trading Strategies

Piercing Line Pattern + Percentage Price Oscillator

In this strategy, we have paired the Piercing Line pattern with the Percentage Price Oscillator to generate credible trading signals. The Percentage Price Oscillator is a momentum indicator. It consists of a centerline, histogram, and the two moving averages. Just like the MACD indicator, the PPO also represents the convergence and divergence in price action. This indicator gives a crossover at the overbought and oversold market conditions.

When price action crosses the centerline, it means that the bullish or bearish momentum is super strong. We want to let you know that PPO is not that popular in the industry. Also, it is not available in the MT4 terminal. However, you can download this indicator from this link and add it to your MT4 terminal. If you are a Tradingview user, search the PPO indicator in the indicators tab, and you should be able to find it.

Step 1 – Find out the Piercing Line pattern in a downtrend.

Step 2 – Once you find the Piercing Line pattern, the next step is to wait for the reversal to happen on the PPO indicator at the oversold market conditions.

In the below CHFJPY chart, the market was in an overall downtrend. We can see the market printing Piercing Line pattern, and that is an indication of a trend reversal. We can also see the PPO indicator giving crossover in the overbought area at the same time. Both of these clues indicate a clear buy signal in this pair. We can also see the price action showing divergence, which is another clue to go long. If we are able to find all of these clues on a single price chart, we shouldn’t mind placing bigger trades.

Step 3 – Stop-loss and Take Profit

PPO indicator quite often gives high probability trading signals. So when we take trades of that kind, most of the time, we must place the stop loss just below the first candle of the Piercing Line indicator.

There are several ways to book profits. For this particular strategy, we can close our position when the PPO reversed at the overbought area or when the market starts printing the opposite pattern. If you plan to make more money in a single trade with extra risk, it is advisable to book the profit at the higher timeframe’s major resistance area.

In the below chart, we can see that we have closed our whole position at the major resistance area and the stop-loss order was just below the recent low.

Piercing Line Pattern + Double Moving Average

In this strategy, we have paired the Piercing Line pattern with the Double Moving Average. Moving Average is a very well-known indicator in the industry. Many average indicators are available in the market. If you are using the lower period average, expect more trading signals. Contrarily, if you are using the higher period average, expect fewer but accurate signals.

Step 1 – First of all, find out the Piercing Line pattern in a downtrend.

Step 2 – Activate the buy trade when the lower period MA crosses the higher period MA. In the below EURAUD Forex chart, the price action was in a downtrend, and around the 22nd of December, the market prints the Piercing Line pattern. This means that the sellers now have a hard time to go lower, and buyers took over the market. Furthermore, when a lower period moving average crosses the higher period moving average, it is a clear indication to go long. After our entry, price action immediately prints a brand new higher high.

Step3 – Stop-loss and Take Profit

If you are an aggressive trader, use the recent low for stop loss. But if you are a conservative trader, make sure to place wider stop losses. If you plan to ride the longer moves, wait for the price action to hit the daily support area. But if you plan to go for intraday trades only, we suggest you exit your position when the double MA gives the opposite signal.

In the below chart, we can see that we have closed our full positions at the higher timeframe major resistance area, and stop-loss was just below the recent low. Overall, it was a 3R trade.

Bottom Line

Piercing Line pattern is a bottom reversal pattern, and it is one of the very well-known bullish reversal patterns. We can say that this pattern is exactly the opposite of the Dark Cloud Cover pattern. We won’t be able to see this pattern very frequently on the price chart, but when it appears, a trend reversal is guaranteed. Sometimes you will find this pattern in the consolidation phase, but it’s not worth your time to trade it in ranges. So it is always recommended to find this pattern in a clear trending market because that’s where we can generate more effective signals. The only limitation of this pattern is that it requires the use of other technical tools to confirm the signal and cannot be used stand-alone. But that’s the case of most of the candlestick patterns, so that’s not a major limitation.

That’s about the Piercing Line candlestick pattern. Let us know if you have any questions in the comments below. Cheers!

Categories
Forex Basic Strategies

Trading The Most Profitable Candlestick Pattern With Stochastic Indicator

Introduction

Throughout the years, many professional traders and chartists spent thousands of hours in front of their screens and have invented hundreds of candlestick patterns that show in the market. Some of these patterns work very well, and some failed miserably. A lot of traders believe that pattern trading doesn’t work. But it is just a myth. Pattern trading does work if we use it in conjunction with other credible trading tools.

Most of the novice traders make the mistake of treating A candlestick pattern as a trading signal. They need to understand that the patterns alone do not hold enough power to reverse the trend of the market. Most of the candlestick patterns are defined by using the last three to four candlesticks alone. Also, most importantly, they ignore the price action context.

This is the reason why we always urge our readers to combines candlestick patterns with other trading tools like credible indicators or oscillators. In this article, we will be sharing one of the most profitable trading strategies that we have ever come across. It involves a candlestick pattern and a technical indicator.

Engulfing Pattern + Stochastic Indicator

After extensive research and backtesting, we found that the Engulfing Pattern is the most profitable Pattern when confirmed and traded with the Stochastic Indicator. Before going right into the strategy, let’s talk about the Stochastic Indicator and Engulfing Pattern in the interest of novice traders who have never heard of these things before.

Stochastic Indicator

George Lane developed the Stochastic Indicator in the Late 1950s. It is one of the most prominent indicators in the industry, and it has been identifying credible signals consistently in all the types of markets from the past 60+ years. The Stochastic is an oscillator, and it changes its direction even before the price action. It measures the relationship between the underlying asset’s closing price and its price range over a specific period of time. Just like other indicators, stochastic doesn’t follow the volume and price. Instead, it follows the momentum and speed of the price to identify the overbought and oversold areas.

Engulfing Pattern

Engulfing is one of the most prominent candlestick patterns in the market. This Pattern frequently appears in the Forex market than the stock or futures market. There are two types of Engulfing Patterns in the market – Bullish Engulfing Pattern & Bearish Engulfing Pattern. Engulfing is either a bullish or bearish reversal pattern, and it prints at the end of any prevailing trend.

Bullish and Bearish Engulfing Patterns

The Bullish Engulfing Pattern always appears in a downtrend. It is a three candle pattern. The first candle is Red; the color of the second candle doesn’t matter. Most of the time, the second candle is a Doji candle. The third candle is super important as it must be Green in color for the pattern confirmation. Also, it must close above the first Red candle.

Conversely, the Bearish Engulfing Pattern appears in an uptrend, and it indicates the bearish reversal. The first candle is Green in color, and that suggests the uptrend is still ongoing. The second candle is Doji, and the color doesn’t matter much. The third one is the decision making candle, which must be Red in color. This indicates the buyers not having enough power to lead the market.

Trading Strategy

Buy Example

This strategy works very well in all the timeframes. So irrespective of you being an intraday trader, swing trader, or an investor, you can still use this strategy. If you are a 60-minute trader, only trade with the current timeframe trend. Adding additional timeframes to this strategy often creates confusion, and as a result, it leads to wrong decision making. The strategy is as follows:

  • The very first step is to find a downtrend in any underlying security.
  • With a bullish view, look for a Bullish Engulfing Pattern.
  • Then apply the Stochastic Indicator on to the charts
  • To take a trade, the Stochastic must be in the oversold area. If the Stochastic is at the overbought area and you see a Bullish Engulfing Pattern, do not take the trade.

In the below GBP/CAD Forex chart the bottom panel shows the Stochastic Indicator. We can see the market was in an overall downtrend. At the end of the downtrend, we can notice the market printing the Bullish Engulfing Pattern. We can also see the crossover of the stochastic indicator at the same time.

This shows that the sellers are exhausted and buyers gaining control in this pair. If at all you are trade the Engulfing patterns alone, make sure to wait for two to three confirmation candles after the Pattern to enter the trade. Here, in our case, there is no need to wait for the next two-three candles as Stochastic confirms the Bullish Engulfing Pattern’s signal. Also, if we would have placed the Take Profit accurately, the winning pips in this trade would be huge. Hence we call this the most profitable candlestick pattern.

Sell Example

  • Firstly, check if the market is in an uptrend.
  • With a bearish view, look for the Bearish Engulfing Pattern.
  • The third step is that the Stochastic must be in the overbought area.
  • If the Stochastic is at the oversold area and market prints a Bearish Engulfing pattern do not take the trade.

In the below USD/CHF Forex pair, the overall market was in an uptrend. When the market turned sideways, it has printed the Bearish Engulfing Pattern. We can also see the Stochastic Indicator in the overbought area. Hence this is a clear indication of Sell trade in this pair. After the signal, price action turned sideways for a longer period. Here, a lot of amateur traders exit their positions if the price takes too long to respond.

But we suggest you have faith and only exit your trades when it hits the stop loss. In our case, we can see the price action holding for sometimes, and when it rolls over, it gave stronger moves. In the below image, we can see that after holding sideways, price action dropped very hard, and we booked full positions at the major support area.

Bottom line

Engulfing Pattern is quite popular, and one of the most profitable patterns that exist in the industry. It often provides good risk-reward ratio trades. When we master the combination of Engulfing Patterns and the Stochastic Indicator, we can easily take our trading to a whole next level. Combining these two technical tools is a sound approach, as they quickly help us in filtering low probability trades. This strategy works well in both ranging market conditions and trending/dying market conditions.

We hope you find this information useful. Test this strategy in a demo account before applying it to the live markets. Cheers!

Categories
Forex Daily Topic Forex Price-Action Strategies

Remember the Rule ‘Set and Forget’

In today’s lesson, we are going to demonstrate an example of H1 breakout trading. Usually, in this strategy, the price goes towards the direction with good momentum if things go accordingly. In this example, the breakout candle, breakout confirmation candle are immaculate, but it takes a long pause before it hits the target. It has a lesson to give us. Let us dig into this.

The price after being bearish finds its support. It consolidates for a while and produces a bearish pin bar followed by a bearish engulfing candle. Traders are to wait for a breakout at the level of support to get them prepared to go short on the pair.

The last candle breaches the level of support and closes well below the level. The candle is having a tiny lower spike. Ideally, H1 breakout strategy traders wait for such a breakout candle.  They are to wait for the next H1 candle to close below the breakout candle. If that happens, the game is on. Let us proceed to the following chart.

As expected, the next candle closes below the breakout candle. The candle looks very bearish, being an ideal candle to confirm the breakout. The sellers may trigger a short entry right after the last candle closes. Let us have a look at the same chart with some calculations in it.

The sellers may set the level of stop-loss above the level where the trend is initiated. They may set the take-profit level with 1:1 risk-reward. It means

Entry- Stop Loss= Take Profit-Entry.

The price consolidates after the signal candle. It bounces at the level, where it bounced some hours earlier. This is the first sign of a double bottom. It looks the buyers may take over the control, which may make the price hit the stop loss. You may remember, in one of our lessons, it has been recommended that a trader may have to close his entry manually. It was an example of the Friday market. Today’s market is not the Friday market. Thus, we must not close it manually, as it may get us a loss, but we must let it run. Let us wait and see how it ends.

It looks much better now. The price heads towards the South with good bearish momentum. It may not take much time to hit the target.

It does not go according to your calculation. It takes much longer than our expectations. However, it hits the target at last. The lesson that we have learned here is we must let a trade run to do its bit. Once we take entry after measuring the risk-reward, we must be patient. In a word, we must remember the rule ‘set and forget.’

Categories
Forex Price-Action Strategies

The Lesson We Learn from Such Price Action

In today’s article, we are going to demonstrate an example of a trade, which does not go according to the price action traders’ expectations. We try to dig out what goes wrong with the trade. Let us get started.

This is a daily chart. The chart produces an inside bar right at the level where the price had a rejection earlier. The buyers, according to price action trading, usually wait for the price to produce a bullish reversal candle around such levels. However, the buyers may remember an important point here that the bullish reversal candle is an inside bar. An inside bar is not known as a strong reversal candle. Nevertheless, it is a daily bullish reversal candle producing right at the level of support, so they daily-H4 buyers are to flip over to the H4 chart.

The H4 chart’s price action is bullish. The last candle comes out as a bearish pinbar. The price may consolidate soon. If that happens, followed by an H4 bullish breakout, buyers may go long on the pair. The next significant swing high is far, offering a tremendous risk-reward.

The price consolidates and produces a bullish engulfing candle breaching the level of resistance. The consolidation does not look an ideal one. Ideally, the buyers may trigger a long entry here. This is what we have been learning on daily-H4 chart trading lessons. Let us assume that we take a long entry here. Let us find out how the trade goes.

The next candle comes out as a bearish candle. It does not hit the stop loss, but it looks ominous. Since taking a loss is an unavoidable thing in trading, so we may let it go. This is what we have been learning, as well. Let us find out what happens next.

It hits the stop loss. As far as trading psychology is concerned, we must not let it take over us. However, with this trade, two things may hold many price action buyers back taking the entry.

  • An inside bar bullish daily reversal candle
  • Ugly looking consolidation

We have demonstrated on many occasions, an inside bar daily reversal candle with good-looking consolidation ends up offering a winning entry. On some lessons, an unusual consolidation but with a daily bullish reversal candle does the same. Over here, a combination of both ends up offering a losing entry. On some occasions, such price action (inside bar daily reversal candle and unusual consolidation) may end up offering a winning entry. However, to have better winning consistency, we may skip taking entry on such price action.


Categories
Forex Price-Action Strategies

It is Better to be Safe than Sorry.

Using Stop Loss is an essential component of trade management. The Forex market gets volatile from time to time. Taking an entry without using Stop Loss may make an account empty. Thus, under no circumstances, we shall take any entry without using Stop Loss. We need to make sure that we set our Stop Loss accordingly, which is neither too tight nor too saggy. In today’s lesson, we are going to demonstrate an example of that.

The above chart is a daily chart. We see that the price finds its support and produces a bullish engulfing candle. The candle closes within the last swing high. The daily-H4 combination traders are to flip over to the H4 chart to take a long entry upon consolidation and bullish breakout. Let us have a look at the H4 chart.

The H4 chart looks extremely bullish. The chart produces a morning star right at the support zone and heads towards the North for one more candle. Traders are to keep an eye on the chart for the price consolidation.

The chart produces one more bullish candle. It then consolidates and creates a bullish engulfing candle breaching the last highest high on the chart. This is an ideal price action opportunity to trigger a long entry right after the last candle closes. Traders shall set the stop loss below the level of support, where the engulfing candle bounces.

The next candle comes out as a bearish candle approaching the Stop Loss level. However, if we set the Stop Loss below the support level, we would be safe here. Things do not look as good as we expected. Let us proceed to the next chart.

The next candle comes out as a bullish engulfing candle. Things look much better now. However, we must not miss the fact that the bullish engulfing candle has a bounce right at the Stop Loss level. If we set too tight Stop Loss, we would have to encounter a losing trade here. Instead of making the profit, we would lose money.

It is a debatable issue how far we shall set our Stop Loss. It is not recommended that we should set our Stop Loss too far. However, we shall set our Stop Loss below the level of support/resistance and add some extra pips. For intraday trading on the 5M, 15M, 30M, H1, and H4 chart, to measure the number of extra pips, we may use the spread of that particular pair. Let us assume we are taking a long entry on EURUSD. If the spread is three pips, we may add three extra pips to set our Stop Loss. We must do a lot of back-testing with our favorite pairs to find out the perfect measure for this to be safe with our entries. As they say, “it is better to be safe than sorry.”


Categories
Forex Price-Action Strategies

The H4-H1 Chart Combination Keeps You Busy Even in a sluggish Market

Usually, the Forex market gets sluggish in December. It gets tough for traders to find out a good entry on major charts as far as price action is concerned. However, the H4-H1 chart combination still offers a few entries. In today’s lesson, we are going to demonstrate an example of an entry based on the H4-H1 chart, which was offered in mid-December 2019.

Let us proceed.

We’re looking at the H4 chart. The last candle makes a strong breakout at the last swing low. Traders are to wait for consolidation and H1 breakout to go short on the pair. Let us find out whether it starts consolidating from right there or comes further down.

It comes down further for one more candle. It means traders are to wait longer. However, the nearest support is far enough. Thus, the price has a lot of space to travel towards the South.

The price starts consolidating and produces two bullish candles consecutively. The pair is to make a big decision from here. Does it continue its journey towards the North, or does it find its resistance nearby? Let us find out from the next chart.

The price finds its resistance and produces a bearish engulfing candle. The sellers have been waiting for this. It is time for the traders to flip over to the H1 chart and wait for an H1 bearish breakout to take a short entry. Let us find out how the H1 chart looks.

The H1 chart shows that the price produces an engulfing bearish candle and heads towards the South. The price on this chart makes a breakout at the red marked support level. It may make the traders wait for, or it may make a breakout straightway. Let us what the price does here.

The price makes an explicit bearish breakout. The breakout candle looks very strong, barely having a lower shadow. A short entry may be triggered right after the candle closes by setting Stop Loss above the level where the H4 chart produces the bearish reversal candle. Let us now find out how it ends.

The price heads towards the South with good bearish momentum. It produces a bullish engulfing candle having a long upper shadow. It may be time for the sellers to close the whole entry since it is the month of December.

As mentioned, in December, traders do not get as many entries as they usually get. However, the H4-H1 chart combination may offer a few entries occasionally even when the market gets sluggish.

Categories
Forex Price-Action Strategies

Daily-H4 Timeframe Combination – The Market Sometimes Makes You Wait More Than You Think

In today’s lesson, we are going to demonstrate an example of an entry derived from the daily-H4 combination. Usually, the daily-H4 combination does not take that long to offer an entry once the price makes a breakout on the daily chart. In today’s example, things are a bit different. Let us find out how it starts and ends.

The figure above shoes the daily chart. After a strong bullish impulse, the price action gets choppy for several days. Do you notice anything here?

The price gets caught within a rectangle. Since it has been choppy for quite a while, it makes some traders think not to keep the pair on their watch list.

There is a saying in price action trading “the more it ranges, the harder it breaks’. Thus, the next breakout may be a very strong one.

The breakout candle looks good. However, it is not that strong a breakout as we have expected. Nevertheless, it is a valid daily breakout, so traders are to flip over to the H4 chart to take a long entry.

The figure above shows the H4 chart. The price has been heading towards the North with an average bullish momentum. Traders are to wait for the price to find its support and make an upside breakout to offer them a long entry.

The price keeps being choppy on the H4 chart as well. It neither has consolidated nor produced a bullish reversal candle on which buyers could take a long entry. It has instead been within another bullish rectangle. This time it is, of course, an H4 bullish rectangle. Let us proceed to find out which way it makes its next breakout.

The price makes an upside breakout again. A bullish engulfing candle with long lower shadow makes the breakout. The buyers have been waiting for it, so a long entry may be triggered right after the candle closes. The Stop Loss shall be set below the rectangle support. There is no visible swing high. This suggests that the profit taking should be managed manually.

The plan has worked wonderfully well. The price goes straightway towards the North with extreme bullish momentum. The buyers may trail their Stop Loss in the middle of the big candle or at least above the breakeven point. As it has been going, it may keep pushing towards the North further. Let us find out what happens next.

The chart produces a bearish reversal candle. It is an Inside Bar, but it is time for the buyers to close the entry.

The price takes so long to make a breakout on the daily chart. It also takes a long time to offer entry on the H4 chart as well. This situation does not happen frequently, but sometimes it may occur. Thus, traders are to be mentally prepared for it.

Categories
Forex Basic Strategies

Trading With The Bollinger Band %B Indicator

Introduction

If you have experience trading with the Bollinger Bands indicator, you will find it easy to trade with the Bollinger Band %B indicator. The only difference is that, in this indicator, you can identify the relationship between the price and the bands with at most clarity.

What is the Bollinger Band %B indicator?

It is basically a technical indicator that quantifies the price of an asset with respect to the upper and lower limits of Bollinger Bands. We have derived 6 relations between the price and the indicator.

  • The %B is at zero when the currency pair is at the lower band.
  • % B will be at 100 when the currency pair is at the upper band.
  • The indicator is above 100 when the price of the currency pair above the upper band.
  • It is below zero when the price goes below the lower band.
  • The %B is above 50 when the price goes above the middle band.
  • And it is below 50 when the price goes below the middle band.

The Bollinger band %B uses the 20-day simple moving average (SMA) as the default parameter, just like the Bollinger Bands. This indicator is available on most of the trading platforms and terminals.

Bollinger Band %B formula

%B = (Price – Lower Band) / (Upper Band – Lower band)

Things to know

Before understanding the strategy, it is necessary to know a few things about the indicator as these concepts will be used in every step of the strategy. Below is the chart of a forex pair with the Bollinger Band %B indicator plotted to it.

  • The upper dashed line represents the 100% level of the %B indicator also known as the upper band.
  • The lower dashed line represents the 0% level also known as the lower band of the indicator.
  • The area in between the two dashed lines is known as the middle band.

These bands help us in identifying different trading opportunities. Hence, one needs to know about it before knowing the strategy.

The Strategy

Step 1: Identify the major trend

To identify the overall trend of the market, the trader needs to shrink the chart and determine the trend.

An uptrend is defined as a series of higher highs and higher lows, while a downtrend is defined as a series of lower lows and lower highs. In this strategy, we have taken the example of a downtrend, as shown in the figure. One can also see lower lows and lower highs in the above chart.

Let us see how the strategy works.

Step 2: Find the price where %B is above 100 or below 0 in the currency pair.

In this step, we are looking for the price where the indicator is above the upper band or below the lower band. This extreme price action is said to continue for long after taking a suitable entry.

A sell setup is formed when the indicator crosses below the lower band, and a buy setup is formed when the indicator crosses above the upper band. This strategy is almost reverse of other strategies (as oversold indicates buying in other strategies).

The above chart shows the crossing of the indicator below the lower band, which is apt for a sell trade. Just because the price is below the dashed line, we cannot take an entry immediately.

The next step is to find a pullback and then make an entry. We will then see how and where to take profits.

Step 3: Take an entry only at a suitable pullback.

By suitable pullback, we mean the opposite color candles should not be swift candles and should not make higher highs. If this happens, the current trend can be weak and may not sustain. The %B indicator can also assist us with the same, as the indicator should move slowly after crossing the lower band. If the indicator reacts and moves fast, it means the pullback is strong and could also result in a reversal. Finally, an entry can be taken after the close of at least two pullback candles.

The below figure explains the above paragraph clearly.

Step 4: Determining how to take profit

In this strategy, we follow a rule-based system for making profits which are again based on our indicator. A trader needs to cover his position after the indicator crosses the lower band once again and goes above the dashed line. This style of taking profit is different than in other strategies where it is based on a fixed percentage. This way of taking profits ensures that a trader is trading based on rules and guidelines which is a disciplined approach.

The below figure explains how profit is taken and the position is covered.

When the indicator goes above the 0% (lower band) level after crossing below, it means profit can be taken now and the trade can be closed.

Step 5: Place a protective stop

Stop-loss is a mandatory and essential part of risk management, hence it needs to determined before entering a trade. For this strategy, stop-loss is placed above the high of the pullback which makes it an optimal place. The stop-loss, in this case, is very small which increases the risk to reward ratio (RR) considerably.

Here is exactly where it is recommended to put the stop loss.

The final trade setup would look something like this 👇

This results in a minimum of 2:1 RRR.

Final words

This is one of the easiest strategies which can be learned by new and experienced traders. It makes use of simple Bollinger bands added with a %B indicator. This indicator can also be combined with several other technical indicators and trading systems, but this alone, too, has a very good level of accuracy.  Now, we have to follow the money management principles to take the best trades and make huge profits from the same strategy. For this, you can also refer to our money management article series, which talks on various risk management topics. Cheers!

Categories
Forex Basic Strategies Forex Daily Topic

A Story of an Early Exit

Risk-Reward is a factor, which every successful trader takes care of. Before choosing a chart to take an entry, the first thing that is to be considered is the trend, then the risk-reward factor. Once we have set our Take Profit and Stop Loss level, we shall leave the entry either to hit the Stop Loss or the Profit Target. However, today, we are going to demonstrate an example of an early exit.

This is an H4 chart. The chart shows that the price has found its support as well as a resistance zone. After having a final rejection, it makes a move towards the downside. Then, it heads towards the North now (see the next image). Another rejection and bearish reversal candle at the resistance zone may produce a short entry.

The last H4 candle is bullish. However, the candle closes within the resistance zone. It may go either way. The buyers may get an upside breakout; the sellers may get a bearish reversal. Let us proceed to find out what happens next.

In the above chart, we can see one good-looking bearish Marubozu candle. The candle suggests that the sellers may wait for consolidation and downside breakout to take a short entry. The candle forms at a Double Top resistance as well. The price may consolidate around the neckline level.

As expected, the price starts having correction around the neckline level. It needs to find its resistance and produce an H4 bearish reversal candle along with a breakout at the neckline.

Here it comes. The last candle engulfs all the candles by closing below the neckline. An entry may be triggered right after the candle closes. The price has enough space to travel down to the red-marked line, which allows an excellent risk-reward. However, there is a support level in between, that may hold the price for a while.

The price heads towards that level with good bearish momentum. The way it has been going, it may hit the red-marked level within four/five H4 candles. This means one more trading day may be required to hit the original Take-Profit level.

The in-between level is a vital level, which produces the H4 bullish reversal candle. The price has reacted several times at that level earlier. Usually, we must stick with our original Profit-taking target. However, it is also legit to close our entry right after the last candle closes. A question may be raised “why do we close our entry here?”

Reasons for Early Exit

There are two reasons

  1. The support level is significantly strong
  2. The current bar is the last H4 Friday’s candle, which means the market closes once the candle is finished.

The Bottom Line

When using the Weekly and the Daily charts, traders are to let their opened positions to reach the target during the weekend. However, intraday traders should consider closing their floating trade before the week’s end. Mondays often start with a big gap, which may hurt intraday Stop Losses.


Categories
Forex Basic Strategies Forex Daily Topic

The Case for Average True Range-based Stop-loss Settings

Most traders are taught to use stop-losses based on critical levels. The basic idea is to spot invalidation levels based on previous low or high. The assumption is that by putting the stop a few pips below or above a support/resistance level will be enough to ensure the right trade will not be stopped out and just bad trades will be taken away.

The problem with that is that all participants in the market, including institutional traders, can see these levels. Institutional traders have lots of cash to play with, so they can push the price down to take all the buy-stop (or sell-stop) orders they see in their price book.

Key-level-based Stops

In the following example, we see the EUR(USD making a breakout after failing to break the previous high, on high volume. A perfect setup for a short trade. We then see the price moving down and then retracing and heading up to our stop-loss. We have been cautious and set it above the last top made on the 6th of November.

Nevertheless, the price kept moving inexorably up until the stop was taken. This is market manipulation at the highest level by institutions. Institutions have advanced tools to observe the depth of the order book, so they know the place and amount of the stops. Also, they have the liquidity necessary to move up the market, take all the liquidity at excellent prices, then continue south.

Chart 1 – EURUSD Key-level-Based Stop-loss placement


ATR-Based stops

If we look at the next chart, we see the same asset with the Average True Range indicator added. For this kind of stop-setting strategy, we need to detect the short term range. Therefore, we use a period of five for the ATR indicator. Next, we look at the peak set by the latest impulsive candlestick, which happened ten bars ago, 0.00168, which is about 17 pips. This figure gives us the expected 4-hour price movement for the current market volatility. The usual is to protect us against two times this figure, at least. In this case, we would need to move the stop-loss level 34 pips away from the entry point.

Chart 1 – EURUSD ATR-Based Stop-loss placement

It is wise to keep statistics of the ideal ATR multiplier, because as the number increases, it cuts our position size for the same dollar-risk amount, and also it reduces our Reward-to-risk ratio.

John Sweeney developed the general method of stop-loss placement. He called it the Maximum Adverse Execution method. The theory of it has been already described in our article Maximum Adverse Excursion, so we are not going to repeat ourselves here. Using  MAE delivers statistical-significant and tamper-proof stops, but it is a bit cumbersome. The use of ATR Stops is a simpler and second-best option instead of the foreseeable key-level-based stops.


Categories
Forex Psychology

Experiencing a Losing Trade

A losing trade hurts. Beginners find it tough to encounter losing trades. However, in the Forex market, losing is inevitable. The market is so action-packed that even an experienced trader often makes mistakes. Sometimes, even a good entry may not get us any profit. In today’s lesson, we are going to demonstrate an example of a good entry, which ends up being a losing trade in the end.

The price heads towards the North and makes a pullback. Traders are to wait for an upside breakout to take a long entry. A bullish Engulfing candle follows a Doji candle. As things stand, the buyers are to take the control soon upon an upside breakout.

Things are different now. The price comes down instead, by making a Double Top. It starts having the correction as well. Consolidation and bearish breakout shall attract the sellers to go short on the pair. Let us see the next chart.

The chart shows that the price is having a correction, where it had a bounce earlier. The equation is very simple here. A bullish reversal attracts the buyers, and a bearish breakout attracts the sellers to go short.

It makes a bearish breakout. The breakout candle looks good. As far as price action and candlestick pattern are concerned, this is an A+ short entry. Concentrate on the marked Stop Loss and Entry levels.

The next candle comes out as a bullish candle. The price may take out some of our entries because of the spread factor. With some brokers, traders pay more spread. Some of our trade (the same entry) may still survive. However, let us not get into this argument but proceed to the next chart. The following chart has an interesting scenario to present.

This should conclude the argument. The price hits the Stop Loss and heads towards the South again. The entry looks to be an A+ entry, but it has ended up bringing us a loss. As usual, beginners with average knowledge of price action may think that something must be wrong with his strategy.

This is not the case. An entry like this would bring us profit at least on 70% occasions. It hurts more since the candle, which hits our Stop Loss itself a strong bearish candle. This is how this market plays. We have to accept it. We must not let our losing trades occupy our thoughts. It is a game of probability of winning and losing. With knowledge, experience, and hard work, a trader can increase the likelihood of winning for sure.

Categories
Forex Risk Management

Basics of Risk To Reward Ratio In Forex Trading

Introduction

The Risk to Reward Ratio is one of the most critical aspects of risk management in Forex trading. Traders with a clear understanding of what RRR is can improve his/her chances of making more profits. In this article, let’s discuss the fundamentals of Risk to Reward ratio with examples and also the ways through which it can be increased while taking your trades.

What is the Risk to Reward Ratio?

Before getting right into the topic, let’s define the meaning of ‘Risk’ here. Risk is the amount of money that a trader is willing to lose in a trade. If you have read our previous money management articles, we mentioned that a trader should not be risking more than 2-3% of their trading capital in each trade. It means when they find a trade setup, they should choose their position size in such a way that if the market hits their stop-loss, they lose a maximum of 2-3% of their trading capital.

Now, the Risk to Reward Ratio is simply the ratio between the size of your stop-loss to the size of your target profit. Let’s say your stop-loss is five pips away from your entry price and your target profit is ten pips away from the entry. In this case, your risk to reward ratio is 1:2 (5 Pips/ 10 Pips).

The larger the profit against the stop loss, the smaller the risk to reward ratio. Which means your risk is a lot smaller than your reward.

What is the recommended risk to reward ratio in the forex market?

Typically, a minimum of 1:1 or 1:2 RRR is recommended for novice traders. There are super conservative traders where they look for a minimum RRR of 1:5.

The risk to reward in every trade cannot be fixed as it varies depending on the market condition. For example, 1:3 or 1:5 RR ratio is achievable when the market is trending, and you enter the market at the right time. Whereas when the market is not very volatile, we should be happy with a risk to reward ratio of 1:1.

How to increase the risk to reward (RR) ratio?

🏳️ Raising target and putting stop-loss to breakeven

A trader can think of raising the target if the market moves to the initial take-profit quickly. This is because when the market moves so fast, it has the potential to move further, thereby increasing the profits.

🏳️ Finding trade setups from the larger time frame

Another way to increase the risk to reward (RR) ratio is by taking the strong trade setups from the higher time frames like daily, weekly, and monthly. We need to wait for such strong trade setups to form. Once formed, the price will move for hundreds of pips, and so we can have wide targets.

Final words

Higher the RRR, the better it is, and of course, higher RRRs are more challenging to achieve. So, do not forget to keep the expectations real and the risks appropriate. You do not have to avoid perfect trades just because the RRR is not as high as 1:5. Make sure to do proper risk management before placing a trade. Never trade with a risk to reward ratio that is too less and try to maximize it as much as possible. Cheers!

Categories
Forex Basic Strategies

Learning The Art Of Fading In Trading

What is Fading?

Fading involves placing trades against the trend to profit from a reversal. Using the concept of fading, a trader will short sell, expecting the momentum to fade when the market is in an uptrend. Likewise, he/she will buy a currency pair with the expectation that the move will fade away and reverse when the market is in a downtrend.

The fading strategy involves three assumptions:

  • The price is either at the overbought or oversold condition.
  • Early buyers or sellers are getting ready to take profits.
  • Current position holders might be at risk.

Overbought and oversold conditions can be identified using technical indicators such as the Relative Strength Index (RSI). Momentum shows the signs of shifting of forces from bulls to bears or vice-versa. And as these signs develop, current holders of the asset start to rethink their positions.

These conditions get exaggerated after an earnings announcement or news release. This may lead to a knee-jerk reaction on the part of other traders to sell the currency pair. As a result, this reaction gets overextended, and a mean-reversion takes place.

Now let us see how does the strategy work and what are the necessary steps you need to take to profit from the strategy:

The Fading strategy

Step 1 – Identify market extremes from the daily time frame 

The first step is identifying overbought and oversold zones using technical indicators or chart patterns.

The popular indicators used for identifying the zones include:

The overbought and oversold conditions are indicated by reading above or below a certain level. For example, the market is said to be in an overbought condition if the RSI is above 70, and it is said to be in oversold condition if the RSI is below 30. This can help traders in identifying fading opportunities.

In the above chart, we can see how the RSI indicator was crossing the normal range when the market gets into the overbought zone. One can find trading opportunities just using the RSI indicator stand-alone. But to trade like how professionals trade, we need to use a lot more tools.

Traders may also use familiar chart patterns or analysis based on price action and watching the price continuously.

Step 2 – Look for signs of capitulation

The second step in the strategy is to look for early signs of capitulation or change in the short-term trend using momentum. This can be mostly done by using candlestick patterns or price action with a volume indicator. We suggest looking for price action signals.

Some other signs to watch for include:

  • When technical indicators start to fade or move away from their extreme overbought or oversold levels.
  • The volume of the significant trend starts decreasing, or the volume of the opposite trend starts increasing.
  • Bearish candlestick patterns appear (in case of an uptrend), or critical support and resistance are broken.

It’s essential to identify these signs early to maximize profit and avoid mistakes.

The signs mentioned above can be explained better with the help of some figures.

Image 1

In the above image, we clearly see that the market is in an uptrend and has been trending from a few days (as it is a daily chart). The volume of the significant trend is also high with the decreasing volume of the sellers, which is a good sign for bulls. But in the end, the volume starts to decrease. The RSI declines sharply after entering the overbought zone for a while.

Image 2

Immediately we see an increase in the volume of sellers with a drastic drop in the RSI indicator (Image 2). The signs are getting stronger for a reversal, and this trend can continue. All the traders who are holding the currency pair start exiting the market. This could be one of the most reliable signs for us to take appropriate action.

Image 3

Finally, we see a break in the ‘support’ by the bears with high volume. Now we have combined all the tools, and each of them is indicating a reversal. Hence, we should take a position in the opposite direction. This is precisely the kind of setup that you need to be looking for every time.

Image 4

In order to find the exact entry, we need to magnify the chart. For this, you need to go on a lower time frame to analyze and set your stop-loss or target based on that time frame. This is mandatory for getting precise entries. The above figure is the lower time frame chart of the explained example.

Note: Images 1, 2 & 3 belong to the daily timeframe, whereas Image 4 belongs to the 4H timeframe.

Step 3 – Enter the trade with a stop-loss and take-profit

The last step is to enter the market with a compulsory stop-loss and take profit to ensure risk management is in place. In this strategy, a stop-loss order can be placed above the price where the RSI enters the overbought/oversold zone. Avoid putting small stop-loss as you can prematurely get stopped out from the trade.

Profit can be booked when the volume of your trend starts to decrease. Now, the stop-loss and target would be placed, as shown in the above chart. This trade would result in a risk-to-reward ratio of a minimum of 1:5. Traders can also use a moving average or any other indicator to set a profit-taking price level. Limit orders are almost used by all traders to avoid any slippage or other issues, particularly in less liquid assets.

Bottom line

Fading strategies can be considered as risky as you are going against the trend. It is always a good idea to take a trade if the risk to reward ratio is favorable. These strategies are commonly used by short to medium term traders to capitalize on short term reversals. Even though it seems risky, it can be extremely profitable if appropriately used. This is because the market has reached a saturation state, and there has to be some balancing force. This is why fading strategies are also known as contrarian strategies. Because they work on the assumption that prices deviating far from the trend, tend to reverse and revert back. That’s about Art Of Fading. If you have any queries, let us know in the comments below. Cheers.

Categories
Forex Basics Forex Daily Topic

Stop Loss: An Art to be Learned Well by Traders

Setting Take Profit and Stop loss in the right areas are essential factors in trading. A trader does not survive in the market by placing Stop Loss and Take Profit at the wrong places. In today’s lesson, we are going to demonstrate an example of an entry with the level of Stop Loss and Take Profit.

This is a daily chart. The price heads towards the North with good bullish momentum. The buyers are to look for long opportunities at the pullback. Let us wait for the price to make a pullback.

The price starts having a downside correction with an Inside Bar. It produces two more candles that are bearish. After that, it forms a Spinning Top right at a flipped support. This is a bullish reversal candle but not a strong one. A breakout at the top of the Spinning Top attracts the minor charts’ buyers to go long on the pair. However, major charts’ traders may want to wait for a stronger daily bullish reversal candle.

The next candle comes out as an Engulfing candle. This reversal candle attracts more traders to look for long opportunities here. Since it has not made an upside breakout, thus, to take an entry, traders shall flip over to the H4 chart.

This is the H4 chart. The price has a rejection at the red marked level on the daily chart. Thus, this is the level where the price may find its resistance on the H4 chart. This shall be the level to count in setting Take Profit. The H4 chart shows that the price starts having a pullback. Things are getting better for the buyers.

Let us draw the resistance. If the price consolidates and makes a breakout at the black marked level, a long entry may be triggered. However, the buyers must wait to get the level of support.

Here it comes. A bullish reversal candle forms at a flipped support followed by a breakout candle. A long entry shall be triggered right after the last candle closes. Stop Loss may be placed right below the support where the price forms the bullish reversal candle. Many traders set their stop loss right below the breakout candle. In my experience, this offers a better risk-reward, but it often brings more losing trades.

Have you noticed that the price came back and then headed towards the North? If we had set our Stop Loss right below the breakout candle, our Stop Loss would have been hit. Rather than making some profit, we would make a loss here.

The Bottom Line

Setting Take Profit is important, but setting Stop Loss is more important. In my opinion, it is an art. It needs a lot of practice to be well acquainted with the art of setting Stop Loss as immaculate as it can get.

Categories
Forex Market

Leverage Trading & Important Money Management Rules To Follow

What is Leverage?

Leverage trading, AKA Margin trading involves borrowing extra funds to increase a trader’s bet while they trade. In this aggressive mode of trading, traders take more risk while expecting for additional rewards. This is done by the traders only when they think the odds are in their favor. Leverages is basically represented as a ratio or with an ‘X’ next to the times of leverage. For instance, to take a trade what is double the size of the amount you want to risk, you are essentially taking leverage of 2:1 or 2x.

The main leveraged products available today for Forex traders are spread betting and contract for difference (CFDs). Other products include options, futures, and some exchange-traded funds (ETFs). Before using leverage, a trader needs to understand the risk associated with it. Controlling risk means having money management principles that can be used on a daily basis. Since leverage trading can be risky, as losses can exceed your initial investment, there are appropriate money management tools that can be used to reduce your potential losses. Now let’s look at a few of these tools.

Money management rules

Using stops

Putting a stop-loss to your position can restrict your losses if the price moves against you. As mentioned in previous articles, markets move quickly, and certain conditions may result in your stop-loss not being triggered at the price you’ve set. Do not forget to trail your stop-loss after you get in a profitable position. By trailing your stop-loss, you will be able to lock in the profits you have made on your trade. There is no need to monitor your position nor the need to adjust your stop-loss manually.

The right risk to reward ratio

The risk to reward ratio can be calculated by taking the total potential profit and then dividing it by the potential loss. You need to calculate risk based on your trading capital (risking not more than 2% of trading capital) and the leverage that you use to trade, as the leverage can alter your stop-loss.

Choosing the right leverage level

It is hard to determine the right margin level for a trader as it depends on trading strategy and the overall market volatility. But from a risk perspective, there is a maximum level of margin that one should use in order not to overexpose themselves to the market. It is seen that scalpers and breakout traders use high leverage when compared to positional traders, who often trade with low leverage. Irrespective of the type of trader you are, you should choose the level of leverage that makes you most comfortable. Since forex brokers provide a maximum leverage of 1:500, newcomers find it attractive and start trading with that amount of leverage, which is very dangerous.

If you are a novice trader, the optimal leverage to use in Forex should be below 10X. But if you are an experienced trader and are extremely sure about the trade you are about to take, the maximum you can go up to is 50X. But as discussed, Forex brokers offer a maximum leverage of 500X and some time more too. But it is advisable not to go that far until and unless you have the appetite to take that risk. By using less leverage, you can still trade even after having a series of losses in the market as you are taking a calculated risk.

Bottom line

A simple rule to keep in mind is that you shouldn’t be risking more than you can afford in the market. You can open a special type of account with a forex broker known as limited-risk accounts, which ensures that all your positions have a guaranteed stop. They decide your account type and leverage based on the information you give them while opening an account. Hence, leverage can be used successfully and profitably with proper money management techniques.

Categories
Forex Market

Dealing With Liquidity & Volatility In The Forex Market

What is liquidity?

When a trader starts his trading journey, one of the things he finds most attractive is the amount of liquidity offered by the forex market. The latest figures suggest that the daily trading volume of forex is close to $5.1 trillion.

Liquidity is the ability to trade a currency pair on demand. In simple terms, it is the measure of how easily a currency can be exchanged. When you are trading major currency pairs, you have an exceedingly high amount of liquidity. This liquidity is provided by financial institutions, big businesses, and retail traders as well. However, not all the currency pairs are liquid; liquidity depends on whether a currency pair is major, minor, or exotic. Major pairs typically have high liquidity compared to the other currency pairs. In the next section, we will look at some of the money management principles in trading with respect to liquidity.

Liquidity and Risk

A market with low liquidity has chaotic moves and gaps because of the absence of buyers and sellers at any given point of time. These gaps occur when news announcements are made over the weekend or if an event happens at the same time. The chart below depicts such a gap after a news release.

According to money management principles, when you know that there will be a change in liquidity levels between Friday to Monday, it is not advised to carry huge positions on Friday. The risk drastically increases, if the price opens above your stop loss on Monday, it will become a market order, and this loss will be much higher than the predefined loss (determined using stop-loss). A conservative trader especially should not take any positions during times of news releases.

Retail forex traders need to manage liquidity risk by lowering their leverage and putting stop losses based on higher time frames. In this way, you would be safe from any kind of gaps that happen at the beginning of the week.

Volatility

Volatility refers to the currency fluctuations in the global exchange market. Price movements can vary from hour to hour, minute to minute, and second to second, depending on many factors. A lot of forex traders enjoy volatility, but it comes with a risk. Therefore it is important to manage volatility and do plenty of research before placing a trade.

Eliminating the risk of volatility

In order to make the most out of volatility, follow the below-mentioned techniques:

Volatility strategies

Money management, in relation to volatility, essentially suggests traders invest in strategies that can perform in different market conditions. Some of the strategies that can be used to turn the volatility in your favor include widening your targets, placing tight stop-losses, and analyzing the higher timeframes.

Stay diversified

Don’t rely too much on any asset class or forex pair. If one investment performs poorly, other investments may perform better over that same period and thereby reducing your overall losses. This happens due to the difference in volatility across various asset classes. A balanced portfolio protects from losses and provides a high return on investment.

Money management should always be a top priority for every trader, as these principles guide us while taking trading decisions. A lot more concepts related to money management will be discussed in the upcoming articles.

Categories
Forex Course

11. The Different Order Types In The Forex Market

Introduction

In the world of trading, the order types are identical, irrespective of the market you’re trading. The type of the ‘Order’ refers to how you wish to enter or exit a trade. If you’re new to the world of trading, you might only know two order types – Buy and Sell. But there are other order types that serve different purposes, and improve the way you trade. In this lesson, we will be discussing some of the most used orders in the forex market.

Types of Orders

There are about four order types widely used by traders. These are

  • Market Order
  • Limit Entry Order (Buy Limit, Sell Limit)
  • Stop Entry Order (Buy Stop, Sell Stop)
  • Stop Loss Order

Apart from the above, there are other orders that are exclusively offered by specific brokers like ‘Trailing Stop-Loss’ and ‘Profit Booking Order’ but in this article, we shall confine only to these four types.

Understanding the Bid and Ask prices

Let us first discuss these two terms as they form the base for understanding the order types.

Bid price

The bid price is the price at which the broker is willing to buy the currency pair from you. So, when you short sell a currency pair, you will be executed at the bid price.

Ask price

Ask price is the price at which the broker is willing to sell the currency pair to you. So, if you go long (buy) on a currency pair, you will be filled at the ask price.

With this under consideration, let us continue our discussion on different order types.

Market Order

This is the most basic form of order. In a market order, you get filled at the current market price. It is basically the best price available in the market to buy/sell a currency pair.

For example, let’s say the bid price of EURUSD is 1.2150, and the ask price is 1.2152. Now, if you execute a market buy order on this one, you will get filled at the ask price, i.e., at 1.2152. Similarly, if you go short on this pair, you will get filed at 1.2150.

Market orders are fast. A trader uses that order to enter a marker no matter what. That speed and fill guarantee comes at the cost of the slippage is the market has moved from the instant the trader pulls the trigger to when the order is filled.

Limit Entry Order

Limit entry order is an order where a buy order is placed less than the current market price, and a sell order is placed above the current market price.

For example, let’s say the current market price of AUDUSD is 0.6750. Now, if you want to buy it at 0.6725, you will have to place a Buy Limit order at this price. And if you want to short it at 0.6790, you will need to place a Sell Limit order at this price.

Limit orders can be used as entry or as exit orders.

As entry orders, you are applying the logic of buy low and sell high (on short-sell limit orders). A limit order is handy to spot a support area while the price moves back and get filled as the price approaches support.

As exit orders, they are handy to take profits. You place a limit to sell at your profit-taking level on long trades and you place a buy limit order at your profit target level on short trades.

Stop Entry Order

A stop entry order is the reverse of a limit entry order. Here, you can place a buy order above the current market price and a short sell order below the current market price.

For example, let’s say the current market price of GBPJPY 1.6570. Now, if you think the market will head up only if the price breaks above 1.6590, you must place a Buy Stop at the price you wish to buy. So, when the price goes up to 1.6590, your buy order will be executed.

Stop-Loss Order

A stop-loss order is special order for closing a trade. This order is placed against the price at which you bought/sold the currency pair. This is done to avoid further losses from trade. Since this order ‘stops’ the losses, it is called a ‘stop-loss’ order.

For example, let’s say you bought a currency pair at 1.1320. Now, for this trade, if you place a stop-loss at 1.1250, the positions will be closed when the market touches this price, hence, protecting you from further losses.

This completes the lesson on basic order types in the forex market. We will discuss the more premium broker specific orders in our future lessons. For now, take the below quiz and check what you have learned the concepts right.

[wp_quiz id=”45527″]
Categories
Forex Educational Library

The Trading Record

Introduction

Traders want to win. Nothing else matters to them; and they think and believe the most important question is timing the entry. Exits don’t matter at all, because if they time the entry, they could easily get out long before a retracement erases their profit. O so they believe.

That’s the reason there are thousands of books about Technical Analysis, Indicators, Elliott Wave Forecasting, and so on, and just a handful of books on psychology, statistical methods, and trading methodology.

The problem lies within us, not in the market. The truth is not out there. It is in here.

There are a lot of psychological problems that infest most of the traders. One of the most dangerous is the need to be right. They hate to lose, so they let their losses run hoping to cover at a market turn and cut their gains short, afraid to lose that small gain. This behavior, together with improper position sizing is the cause of failure in most of the traders.

The second one is the firm belief in the law of small numbers. This means the majority of unsuccessful traders infer long-term statistical properties based on very short-term data. When his trading system enters in a losing streak, they decide the system doesn’t work, so they look for another system which, again, is rejected when it enters in another losing sequence and so on.

There are two problems with this approach. The first one is that the trading account is constantly consumed because the trader is discarding the system when sits at its worst performance, adding negative bias to his performance every time he or she switches that way. The second one is that the wannabe trader cannot learn from the past nor he can improve it.

This article is a rough approach to the problem of establishing a trading methodology.

1.- Diversification

The first measure a trader should take is:

  1. A portfolio between 3-10 of uncorrelated and risk-adjusted assets; or
  2. A portfolio of 3 to 5 uncorrelated trading systems; or
  3. Both 1 and 2 working together.

What’s the advantage of a diversified portfolio:

The advantage of having a diversified portfolio of assets is that it smooths the equity curve and, and we get a substantial reduction in the total Drawdown. I’ve experienced myself the psychological advantage of having a large portfolio, especially if the volatility is high. Losing 10% on an asset is very hard, but if you have four winners at the same time, then that 10% is just a 2% loss in the overall account, that is compensated with, maybe, 4-6% profits on other securities. That, I can assure you, gave me the strength to follow my system!.

The advantage of three or more trading systems in tandem is twofold. It helps, also improving overall drawdown and smooth the equity curve, because we distribute the risk between the systems. It also helps to raise profits, since every system contributes to profits in good times, filling the hole the underperforming one is doing.

That doesn’t work all the time. There are days when all your assets tank, but overall a diversified portfolio together with a diversified catalog of strategies is a peacemaker for your soul.

2.- Trading Record

As we said, deciding that a Trading System has an edge isn’t a matter of evaluating the last five or ten trades. Even, evaluating the last 30 trades is not conclusive at all. And changing erratically from system to system is worse than random pick, for the reasons already discussed.

No system is perfect. At the same time, the market is dynamic. This week we may have a bull and low volatility market and next one, or next month, we are stuck in a high-volatility choppy market that threatens to deplet our account.

We, as traders need to adapt the system as much as is healthy. But we need to know what to adjust and by how much.

To gather information to make a proper analysis, we need to collect data. As much as possible. Thus, which kind of data do we need?

To answer this, we need to, first look at which kind of information do we really need. As traders, we would like to data about timing our entries, our exits, and our stop-loss levels. As for the entries we’d like to know if we are entering too early or too late. We’d like to know that also for the profit-taking. Finally, we’d like to optimize the distance between entry and stop loss.

To gather data to answer the timing questions and the stop loss optimum distance the data that we need to collect is:

  • Entry type (long or short)
  • Entry Date and time,
  • Entry Price
  • Planned Target price
  • Effective exit price
  • Exit date and time
  • Maximum Adverse Excursion (MAE)
  • Maximum Favourable Excursion(MFE)

All the above concepts are well known to most investors, except, maybe, the two bottom ones. So, let me focus this article a bit on them, since they are quite significant and useful, but not too well known.

MAE is the maximum adverse price movement against the direction of the trend before resuming a positive movement, excluding stops. I mean, We take stops out of this equation. We register the level at which a market turn to the side of our trade.

MFE is the maximum favourable price movement we get on a trade excluding targets. We register the maximum movement a trade delivers in our favour. We observe, also, that the red, losing trades don’t travel too much to the upside.


Having registered all these information, we can get the statistical evidence about how accurate our entry timing is, by analysing the average distance our profitable trades has to move in the red before moving to profitability.

If we pull the trigger too early, we will observe an increase in the magnitude of that mean distance together with a drop in the percent of gainers. If we enter too late, we may experience a very tiny average MAE but we are hurting our average MFE. Therefore, a tiny average MAE together with a lousy average MFE shows we need to reconsider earlier entries.

We can, then, set the invalidation level that defines our stop loss at a statistically significant level instead of at a level that is visible for any smart market participant. We should remember that the market is an adaptive creature. Our actions change it. It’s a typical case of the scientist influencing the results of the experiment by the mere fact of taking measurements.

Let’s have a look at a MAE graph of the same system after setting a proper stop loss:

Now All losing trades are mostly cut at 1.2% loss about the level we set as the optimum in our previous graph (Fig 2).  When this happens, we suffer a slight drop in the percent of gainers, but it should be tiny because most of the trades beyond MAE are losers. In this case, we went from 37.9% winners down to 37.08% but the Reward risk ratio of the system went from results 1.7 to 1.83, and the average trade went from $12.01 to $16.5.

In the same way, we could do an optimization analysis of our targets:

We observed that most of the trades were within a 2% excursion before dropping, so we set that target level. The result overall result was rather tiny. The Reward-to-risk ratio went to 1.84, and the average trade to 16.7

These are a few observations that help us fine-tune our system using the statistical properties of our trades, together with a visual inspection of the latest entries and exits in comparison with the actual price action.

Other statistical data can be extracted from the tracking record to assess the quality of the system and evaluate possible actions to correct its behaviour and assess essential trading parameters. Such as Maximum Drawdown of the system, which is very important to optimize our position size, or the trade statistics over time, which shows of the profitability of the system shrinks, stays stable or grows with time.

This kind of graph can be easily made on a spreadsheet. This case shows 12 years of trading history as I took it from a MACD trading system study as an example.

Of course, we could use the track record to compute derived and valuable information, to estimate the behaviour of the system under several position sizes, and calculate its weekly or monthly results based in the estimation, along with the different drawdown profiles shaped. Then, the trader could decide, based upon his personal tolerance for drawdown, which combination of Returns/drawdown fit his or her style and psychological tastes.

The point is, to get the information we must collect data. And we need information, a lot of it, to avoid falling into the “law of small numbers” fallacy, and also to optimize the system and our risk management.

Note: All images were produced using Multicharts 11 Trading Platform’s backtesting capabilities.

Categories
Forex Educational Library

The Meaning of Cutting Losses Short

Abstract

In this article, we deal with the different ways and aspects of the stop-loss setting. A crucial task for a successful trader.

Introduction

What a price to pay for bad wisdom? Too young to know too much too soon… (Suzanne Vega)

The decision where to cut losses if a trade is not working should be part of the trade selection process for every trade, and should be assessed in connection to the potential profit; so the risk to reward should comply with our trading rules.

One key example of the need for cutting losses short (in other words having high reward to risk trades) was given by trader Glen Ring when interviewed by Bruce Babcock (The Four Cardinal Principles of Trading).

He had a month when he made eight trades, with seven winners and one loser, but the net result was a losing month, just because of a single big loss.

The opposite may hold: you might experience eight trades with seven losers and still be profitable just because your system’s mean reward-to-risk ratio is excellent and that winning trade erased the losses of the seven losers.

The key lesson is: Although psychologically, we need to be right, we must focus on a reward-to-risk ratio, not in the frequency of our gains.

In Glen’s words: “Having those small losses is what keep us in the game, keeps your position for when you do catch a trend or big move. But, it’s a law of numbers to me. If we can make enough controlled-loss trades, even a blind squirrel is going to find a nut once in a while.

The Stop-Loss Concept

The stop-loss concept is related to position size. Trend following’s main idea is to catch the big trend. Its rate of success is reduced -below 35%-, but with potential big reward to risk ratios.

There’s a small chance for a trader to have ten losses in a row. A trader that risk no more than 2% of its equity on a single trade experiences a 20% drawdown at the end of 10 consecutive losses, but may still keep following the rules. A trader risking 5-6% will be 50 or 60% down, and undoubtedly will lose perspective and may stop following the rules, even though the system hasn’t failed.
The main lesson is: Trade thin instead of big at the beginning, analyze your potential drawdowns in losing streaks as a mean to optimize your position size of your system.

Minimizing losses means that we are in control. Being in control is the difference between being a speculator and a gambler. Being a speculator means we can decide on the odds. Be in control about when to enter the market and when to exit. That can’t be done gambling.

We’ll discuss the several methods top traders use in their trading systems. They can be divided into the following categories:

  • Chart-based stops
  • Indicator stops
  • Entry method stops
  • Volatility stops
  • Money management stops
  • Account equity stops
  • Margin-based stops


1.    chart-based stops

Chart-based stops are those stops put near a meaningful point on a chart. This may be related to a chart pattern, trend line or pivot point that represents support or resistance.

Cutting losses short don’t mean unrealistic tight stops, though. It’s important to give latitude enough to let the trade work.

So, cutting losses short means to close a trade if, by our rules, has touched the stop point. But that point shall be placed according to the logic of the price movement.

Also, it’s wise to let a wide margin at the beginning of the trade using a small position, but, as the trade develops in our favor, we should move the stop higher and, optionally, add to the position.

What happens if the chart stop defines a trade that’s too risky? In the futures market, the minimum risk one can take is the one assumed by trading one contract. In the case of currency markets, this isn’t an issue, so the answer is: reduce your position to the level you have set in your trading rules. The number one rule is to protect our capital.

The chart method to set the stop has its detractors. In Babcock’s book already mentioned, Jake Bernstein says that John Granville used to say: “if it’s obvious, it’s obviously wrong.” “Let’s put the stop at the low of the day.” Ten thousand people are thinking the same way. The odds are that approach is not going to work.

How To Set Stop Loss In Options Trading

The Last Day Rule:

Peter Brandt, mentioned in Babcock’s book, has what he calls “the last day rule”. He applies it to breakout trades to reduce losses on failed breakouts.

The rule calls for a stop set at the opposite extreme of the last day of the previous range pattern. If the break is to the upside, he sets the stop to the low of the last day within the pattern. If to the downside, he uses the high of that last day.

The use of retracements, Fibonacci:

Some traders use retracements as places to start a trade using Fibonacci retracements. One way to place entries and stops is, for instance, entries at a 50% retracement and stops at 62%, that way we plan for a 50% potential profit with a 12% risk; more than 4:1 RR.

Moving to break-even:

One method that helps release stress and anxiety from the trader is to move the stop to the break-even point if and when the price has moved to a level that allows to do it.  Then the rest of the trade is a free ride. This has been recommended by many authors focused on trader’s psychology (Alexander Elder, Mark Douglas, Van K. Tharp).

2.    indicator stops

Indicator stop means setting the stop by virtue of an indicator, such as a moving average or momentum.  It’s not a chart-based stop since it’s computationally based.

Indicator stops seek to optimize the relationship between cutting losses short and not getting chopped up at the same time. That’s difficult to achieve without studying past trades for improvement. Indicator stops tries to optimize the relationship between cutting losses short and not getting chopped up at the same time. That’s difficult to achieve without studying past trades for improvement.

To optimize stops we need to back (or forward) test which is the stop distance beyond which there is are more money lost than gained. For more on this, I recommend John Sweeney’s concept of Maximum Adverse Execution. To optimize stops we need to back (or forward) test which is the stop distance beyond which there is are more money lost than gained. For more on this, I recommend John Sweeney’s concept of Maximum Adverse Execution.

The main idea of the MAE using Sweeney’s words is:

 “It turns out that if your trading rules are consistent and can distinguish between good and bad trades, then, over many experiences, you can measure how far good trades go bad and, usually, see at what point a trade is more likely to end badly than profitably. That is the point at which you stop and/or reverse.”


How To Set Stop Loss In Options Trading | Forex Academy

How To Set Stop Loss In trading

(figures taken from John Sweeney’s book)

3.    entry method stops

By entry method stops, it means some stop point that is set by the entry method. It may be a reverse entry signal, or it may occur as a result of the violation of some or all of the trade’s entry conditions.

“The same methodology that says enter the trade has to tell you when the trade is wrong. [..] If a market exceeds the price and time projection windows, then the trade is wrong” (Robert Miner)

Robert Miner has a price and time zone. If price breaks the zone or if the time window is reached without gains, he closes the position.

4.    volatility stops

Volatility stops are stops placed at a distance from the entry calculated as some percentage of recent or historical volatility. In general, volatility is measured as a price range computed over a time-lapse.

Stan Tamulevich, interviewed by Babcock for his book, uses the three to four-day volatility. If the market takes out the distance of the last day, he quits the trade. Usually even less than that. If the market takes out 50% of last day move ¡t enters in a danger zone.

Russell Wasendorf, another trader interviewed, sets his stop outside the range set by historical volatility. Short-term volatility increases don’t change his plan. His method is more concerned with not getting shaken off a potentially winning position rather than improve its short-term risk.

5.    money management stops

Money management stops mean fixed dollar amount stops. It’s a combination of stops and dollar risk management.

The two main advantages the author sees are:

  • If the purpose of stop-loss is to manage risk, a dollar stop is the most direct way to manage it.
  •  That kind of stops don’t go to obvious places, except by coincidence, so the risk to be whipsawed by the market is reduced.

6.    account equity stops

An Equity stop is based on a fixed percentage of the account equity. A variant of money management stop.

It’s a methodology that starts by defining in dollar terms what’s the risk allowed by the account’s rolling balance of the trader. If we assume 1% risk is set,  this leads to a dollar risk amount for that account balance.

Then the risk-dollar amount of the potential trade is computed. If it falls within the 1% risk the trade is taken, opening the number of contracts within the 1% risk rule.

If the loss is not within the 1% rule, the entry point must be adapted to bring it close enough to the exit point, so the risk is no more than 1%.

7.    margin-based stops

A variation of the previous type. Stops are calculated by taking a percentage of the exchange margin. This is specific to futures trading.

8.    main points to remember

  • Cutting losses short is the most important rule in a trading plan
  • The trader should be more concerned with the reward-to-risk ratios than with the percentage of winning trades.
  • Chart-based stops set stop points in the proximity of market bottoms/tops.
  • Indicator-based stops look to optimize the stop point using math and historical analysis of past trades.
  • Volatility stops try to keep stop points away from the volatility cloud.
  • Account-equity stops move the entry point of a trade to a place that complies with the percent risk rules of the account.

9.    conclusions and criticism

Stop-loss definition is a difficult task, but it has to be designed with care, as is the main concept to success in trading.

In Mr. Babcock’s book, the primary focus is the futures market, that presents a very poor atomization of the position. I mean, the minimum size allowed in the futures market is ONE contract so that the minimum risk would be the risk of that single contract from an entry point to a stop point. That makes it difficult to split the concept of “cutting losses” with the concept of “position size.” In the currency markets, this is not the case, as we can do it down to micro-lots, which makes it possible to do independent optimization of the two concepts.

I think a combination of Chart or volatility-based stops is the initial stage towards the definition of this task as part of a trading system. But a second step might be to optimize stops using John Sweeney’s MAE concept. For this, we might need a computerized analysis of our past trades, or a back-test, if the system rules can be automated.

We may design a continuous improvement process, by a careful annotation of the behavior of our current stops for further analysis in search of better places.

Regarding position sizing, this is a subject for another essay, it suffices to say for the moment that we could use the before mentioned rule: don’t to risk more than 1% of our current trading account balance, and if you’re starting trading, don’t risk more than 25% of that. There’s a Spanish popular wisdom sentence: ” En dinero y amistad, la mitad de la mitad” (about money and friendship divide by half and then by half).

We should remember that the primary goal of a trader is to survive.

 ©Forex.Academy