Categories
Forex Course

137. Differentiating between a Retracement and a Reversal

Introduction

Broadly speaking, there are three states in the market – trend, range, and channel. If we were to go a little more in detail, a market has components like retracement and reversal. Identifying and differentiating between a retracement and reversal is a skill in itself. In this lesson, let’s go and understand what these terms mean and how to differentiate them.

What is Retracement?

Retracement is the terminology usually associated in a trending market. We know that in a trending market, the price moves in one specific direction. For instance, an uptrend is defined as a sequence of higher highs and higher lows. As per the definition of an uptrend, the prices do not keep moving higher and higher continuously.

After trending up to a certain point, the price temporarily moves in the opposite direction. This movement against the original trend is referred to as retracement. Technically, the price action from a higher high to the higher low is called a retracement.

Uptrend Example

Downtrend Example

What is a Reversal?

A reversal can be defined as the overall change in the direction of the market. A market can reverse from an uptrend to a downtrend, or from a downtrend to an uptrend.

Reversal to the Upside

In this type of reversal, initially, the market trends in a downtrend making lower lows and lower highs. Later, the market goes into a transition state where the price typically ranges for a while. In other words, the price stops making lower lows and lows highs. Instead, it makes equal lows or higher lows. Finally, the market starts to trend north by making higher highs and lower lows.

Reversal to the Downside

This reversal happens when the market transits from an uptrend to a downtrend. In an uptrend, the price makes higher highs and higher lows. But, when the trend begins to diminish, the higher highs turn into equal highs, and higher lows start to become equal lows. Finally, when the seller’s pressure comes in, the price begins to make lower lows and lower highs, forming a downtrend. Thus, the complete scenario is referred to as a reversal.

Predicting a possible reversal or retracement in the market is pretty challenging. If you’re stuck in a position and unsure if it is a retracement or a reversal, you may try the following options to manage the trade:

  • Hold onto your positions by keeping the stop loss as it is. If it is a retracement, you can ride the trade, else get stopped if it is a reversal. This is the simplest approach.
  • If you are more inclined towards a reversal than a retracement, then you may close your positions. Based on where the market breaks through, you can look for re-entry. But, you might have to compromise on the risk: reward.
  • You could close the entire position and stay away from the pair and look for other opportunities. This is the safest option possible, especially for conservative traders.
[wp_quiz id=”79176″]
Categories
Forex Daily Topic Forex Fibonacci

Draw Fibonacci Levels on Your Trading Chart

Fibonacci traders are to find out a good move, followed by a price correction. They keep their eyes on the 61.8% level with extreme attention. If the level of 61.8% produces a reversal candle, traders trigger for entry. Usually, the price goes up to the level of 161.8% if the price trends from 61.8%. This allows an excellent risk-reward to the traders as well. In today’s article, we are going to demonstrate an example of how the golden ratio of 61.8% plays such an important role in moving the market towards the trend. Let us get started.

The chart shows that it makes a bullish move upon producing a bullish engulfing candle. The price makes a downside correction and moves towards the North again. This time the price makes the move with good bullish momentum. The Fibonacci traders are to wait for the price to make a downside correction and draw Fibonacci levels to go long in the pair. Let us proceed to the next chart to find out whether it starts having downside correction or heads towards the North further.

This is an interesting move by the chart. It has a bearish gap, but the candle comes out as a bullish candle. Despite having an upper shadow, this is a bullish reversal candle. Let us find out how the price reacts upon getting such a bullish reversal candle.

The price heads towards the North with extreme bullish momentum. The bull outplays the bear. This is such a strong bullish move that the buyers would love to make full use of it. Do you notice something interesting? Yes, the price trends from the 61.8% zone. Let us draw the Fibonacci levels and see how it looks.

The chart shows that despite having a bearish gap, the chart produces a bullish candle within 61.8% zone and heads towards the North. It hits the level of 161.8% in a hurry as well. This is what the Fibonacci golden ratio level does almost all the time. There are different ways of trading and catch such a move. Some traders enter before the breakout, while some enter after the breakout at the highest high of the wave. Both have merits and demerits, which we will learn in our forthcoming Fibonacci lessons. Meanwhile, concentrate on your chart and practice drawing Fibonacci levels by pointing out the highest high and the lowest low. Start practicing this, so you get well acquainted with Fibonacci significant levels and how the price reacts to them. This will help you trade much better soon.

Categories
Forex Daily Topic Forex Fibonacci

Fibonacci Trading: The Golden Ratio

Fibonacci trading is one of the most prolific trading methods, which is widely used by Forex traders. Retracement length, Fibo levels as well as reversal candle are three factors that Fibonacci traders need to pay attention to. In today’s article, we are going to demonstrate an example of a chart, which makes an excellent bearish move after having a retracement. The length of retracement, the most significant Fibo level, and the reversal signal all play their part in this example. Thus, fasten your seat belt and read through.

The chart shows that it makes a strong bearish move and makes a breakout at long-held support. The price heads towards the South, searching for its support. The sellers are to wait for the price to have a retracement.

The price starts having retracement. It produces a bullish inside bar followed by another bullish candle. The sellers are to wait for the price to find its resistance and produce a bearish reversal candle. However, the Fibonacci traders are to wait for the price to produce a bearish reversal candle at a very particular level, which is the 61.8 level.

The chart produces a bearish engulfing candle closing well below the last bullish candle. The Fibonacci traders must draw the Fibonacci retracement levels to find out which level produces this reversal candle. If this is the level of 61.8, the Fibo sellers are going to go short in the pair.

The highest high is the level of 0.00, and the lowest low is the level of 100.0. The price has a retracement and produces a bearish engulfing candle right at Fibo level 61.8. Usually, when the level of 61.8 works as support/resistance, it drives the price towards the level of 161.8. This means the price may head towards the South and hit the level of 161.8 next. Let us proceed to the next chart and see what the price does here.

The price hits 161.8 level. It makes an upward correction on its way. However, it reaches the level at last. The last candle shows that it breaches the level of 161.8. The price may head towards the South further.

The level of 61.8 is called the Golden ratio. It is a super significant level as far as Fibonacci Retracement is concerned. The buyers in a buying market and the sellers in a selling market wait for the price to produce a reversal candle/signal candle to go long/short in a pair. Yes, there some equations for the traders to know and obey to be able to trade with Fibonacci retracement. Once they learn them well, Fibonacci trading can make them a handful.

Categories
Forex Daily Topic Forex Fibonacci

Fibonacci Retracement: A Magic Trading Tool

Financial traders rely a lot on a tool called Fibonacci Retracement. This shows the percentage of retracement that the price makes after making a strong bullish/bearish move. The percentage of retracement is very significant to the traders. There are some particular levels, where the price reacts heavily and creates a new trend. Thus, financial traders use Fibonacci Retracement tool to measure retracement length and find the potential whether it is going to create a new trend or not. The Forex traders love using the Fibonacci Retracement tool as well. Once we know how to draw it on the chart accordingly, we find out that the currency pairs on almost all the timeframes obey the Fibonacci retracement ratio.

Leonardo Fibonacci, an Italian mathematician, identified a series of numbers such as 0, 1, 1, 2, 3, 5, 8. 13, 21, 34, 55, etc. Each number is the sum of the preceding two numbers.  These numbers produce some significant ratios, such as 23.6. 38.2, 50, 61.8. 78.6, 100, 123.6, 138.2, 161.8. These ratios and the Fibonacci sequence are found in nature as well. Thus, people love using the sequence ratios in their design and plan. At the end of the day, people run financial markets. They buy or sell at certain levels. Since Fibonacci ratios are much related to our nature and life, traders love using these ratios to help decide where to buy and where to sell.

As far as Fibonacci ratios are concerned, the 61.8 is considered as the golden ratio. It is found in flower petals, seed heads, pinecones, fruits and vegetables, tree branches, shells, spiral galaxies, hurricanes, fingers, animal bodies, reproductive dynamics, animal fight patterns, DNA molecule, etc.

In the financial/Forex market, the ratios are used by using a tool called Fibonacci Retracement. There are other Fibonacci tools, but this one may be the trader’s most favorite.

In a buying market, a trader draws his Fibonacci retracement levels from the lowest low to highest high.

The level of 00.00 is the lowest low, and the 100.00 is the highest high of a bullish wave. Traders are to wait for the price to make a bearish retracement. All these levels are significant, and the price reacts to these levels. However, the buyers pay more attention when the price is around 61.8 level to go long in a pair.

In a bearish market, it is just the opposite. Let us have a look at how it looks like.

Fibonacci Retracement levels help traders spout out the trend’s initiating point. Thus, it becomes easy for the traders to take entry with excellent risk-reward. In our forthcoming articles, we are going to demonstrate charts on different pairs, time frames to find out how the price reacts to different Fibonacci levels. Stay tuned.

Categories
Forex Course

63. Reasons Why We Should Never Completely Depend On Fib levels?

Introduction

In the previous article, we learnt how exactly to trade using the Fibonacci levels. There are many other ways through which Fib levels can be traded. Some of them include trading these levels using S&R, Trendlines, and even candlestick patterns. Before learning all of these ways, we must know that these levels are not guaranteed and cannot be traded stand-alone. So in this article, let’s discuss why one should be very careful while trading Fibonacci retracements.

Fibonacci Levels Will Not Be Respected Always

Every technical level ultimately breaks at a certain point in time, and that is the case with Fibonacci levels as well. In the previous article, we had learnt that Fibonacci levels also act as potential support and resistance areas. So these levels do break just as how S&R levels break. Therefore we must keep in mind that these levels are not foolproof.

Let’s understand this with the help of an example. But before that, make sure to read our article on ‘How to trade Fib retracements’ to understand this better. You can find that lesson here.

In the price chart below, we can see an initial big move to the downside. So basically, here we must wait for the retracement, and that retracement must touch the Fibo levels. Let’s see what happens in the next step.

We saw the retracement (below chart) of the downward move, and we have placed the Fib levels from swing high to swing low since it is a downtrend.

Then we can see the retracement reaching the 50% Fib level and holding there. Ideally, at this point, the retracement must stop, and the market’s original downtrend should continue. Also, we should be placing our ‘sell’ trades as the Red confirmation candle can clearly be seen.

But, to our surprise, we observe that the price did not respect our strategy, and the market shot up to the north, violating all the Fibonacci levels, as shown in the below chart.

While Fibonacci retracement levels give us a high probability of the trade working in our favor, like any other technical analysis tool, they don’t always work. One can never be entirely certain that the price will respect the 50% or 38.2% or any Fibonacci level for that matter.

If you are an experienced technical trader, you wouldn’t have placed a sell trade in the above scenario. It was clear that the sellers are losing momentum. The formation of a bearish Doji candle at the bottom (below chart) is another confirmation of a trend reversal.

So we should be looking at the bigger picture, or we should take the help of any other technical tools to confirm the signals generated by the Fibonacci levels. Never completely depend on them.

Conclusion

Apart from the things that we discussed above, there is another issue while using these Fib ratios, which is determining the appropriate swing low and swing high. Everyone looks at charts differently. They trade at different time frames and have their own fundamental reason for buying or selling the currency pair.

Swing high for one trader might likely be different than swing high for another. And when the Fib ratios are placed incorrectly, of course, the trading signals generated won’t be accurate. Also, the prerequisite for Fibonacci trading is trending markets. When the market is in a consolidation or moving sideways, it is obviously not possible to trade with these ratios.

We hope you understood this lesson well. If you find this complicated or if you have any questions, please let us know in the comments below. Cheers.

[wp_quiz id=”64257″]
Categories
Forex Harmonic

The Cypher Pattern

The Cypher Pattern

The Cypher Pattern is another type of Harmonic Pattern – except it isn’t – but it is. This is one of the few patterns not identified by Scott Carney. Darren Oglesbee discovered this particular pattern.

This pattern is very similar to the Butterfly in both it’s construction and where it typically will occur (near the end of trends). However, the Cypher Pattern is a rare pattern and not one that shows up with a high amount of frequency. Don’t confuse rarity with being more powerful or profitable. I do not know enough about this pattern, nor have I had the opportunity to trade it enough to gauge it’s ‘power’ versus its peers. All I do know is that in the times I have traded it, its positive expectancy rate is high, no different than a Bat or Alternative Bat in my experience. The same goes for the Crab and Deep Crab, for that matter. Just like all of the other Harmonic Patterns that you will have learned about, the Cypher has specific rules and conditions that must be met for it to be a specified Cypher pattern.

Cypher Confirmation Conditions

  1. B must retrace to an expansive range between 38.2% and 61.8% of XA. At least 38.2% but not exceeding 61.8%
  2. C is an extension leg and moves beyond A – but must move to at least 127.2%, but it is normal for it to go as far as the 113% – 141.4%. It is considered invalid if it moves beyond the 141.4%
  3. CD leg should break the 78.6% level of XC.
  4. The PRZ (Potential Reversal Zone) of D is a wide range where the price must get to. Price can move anywhere between 38.2% to 61.8%.

I’ve created a simplified approach to how to ‘see’ this pattern.

Simplified Approach (Bullish Cypher)

  1. C must be higher than A.
  2. D must be less than B but greater than X.
  3. We should see a higher high (C > A) and a higher low (D > X).

Simplified Approach (Bearish Cypher)

  1. C must be less than A.
  2. D must be more than B but less than X.
  3. The same approach as above, reverse: lower high (D < X) and a lower low (C < A).

This pattern can be confusing (all harmonic patterns can be complicated), but in a nutshell, what we see happening with the Cypher pattern is the first pullback/throwback of a trend (B). After B, the small pullback/throwback of B occurs with the C leg. From a bullish perspective, when we see prices making lower highs and lower lows, but there is no follow-through shorting pressure, we should be on the lookout for some powerful and influential moves to occur in a very short period of time. It is not uncommon to see a bullish candle engulf several days of consolidation with this pattern.


Sources: Carney, S. M. (2010). Harmonic trading. Upper Saddle River, NJ: Financial Times/Prentice Hall.  Gilmore, B. T. (2000). Geometry of markets. Greenville, SC: Traders Press.  Pesavento, L., & Jouflas, L. (2008). Trade what you see: how to profit from pattern recognition. Hoboken: Wiley.

Categories
Forex Harmonic

The Bat Pattern

Harmonic Pattern Example: Bearish Bat

The Bat Pattern

The Bat Pattern is another harmonic pattern that was not identified by Gartley, but instead by the great Scott M. Carney – found in Volume One of his Harmonic Trading series (I believe that Mr. Carney’s work is essential in your trading library).

I am particularly grateful to Carney’s work because it was his work that introduced me to a very powerful Fibonacci retracement level: 88.6%. Previously, I have followed Connie Brown’s suggestions in her various books utilizing only the 23.6%, 50%, and 61.8% Fibonacci levels – the 88.6% is now a near-constant in my own analysis and trading. That particular level, the 88.6% level, is the primary level to reach with the Bat pattern.

One of the key characteristics of this pattern is the strength, power, and speed of the reversals that occur after a confirmed and completed pattern is verified. As a Gann based trader, this is the pattern I personally look for to identify the ‘confirmation’ swing in a new trend (the first higher low in a reversing downtrend and the first lower high in a reversing uptrend).

Bat Pattern Elements

  1. B wave must be less than the 61.8% retracement of XA – ideally the 38.2% or 50%.
  2. BC projection must be at least 1.618.
  3. The AB=CD pattern is required and is often extended.
  4. C has an expansive range between 38.2% and 88.6%.
  5. The 88.6% Fibonacci retracement is a defining and particular level to the Bat Pattern.
  6. The 88.% D retracement is the defining and exact limit of the end of this pattern.

Ideal Bullish Bat Conditions

  1. 50% retracement of XA.
  2. Exact 88.6% D retracement of XA.
  3. BC wave 200%.
  4. Alternate AB=CD 127% is required.
  5. C should be inside the 50% and 61.8% retracement range.

Ideal Bearish Bat Conditions

  1. B wave must be less than the 61.8% retracement of XA – ideally the 38.2% or 50%.
  2. BC projection must be at least 88.6%.
  3. BC projection minimum of 161.8% with the max extensions between 200% to 261.8%.
  4. AB=CD is required, but the Alternate 127% AB=CD is ideal.
  5. C wave retracement can vary between the 38.2% to 88.6% retracement levels.


Sources: Carney, S. M. (2010). Harmonic trading. Upper Saddle River, NJ: Financial Times/Prentice Hall.  Gilmore, B. T. (2000). Geometry of markets. Greenville, SC: Traders Press.  Pesavento, L., & Jouflas, L. (2008). Trade what you see: how to profit from pattern recognition. Hoboken: Wiley.

Categories
Forex Educational Library

Understanding The Fibonacci Sequence

Introduction

Fibonacci is probably the most famous tool for traders. In this article, we will explain its origin, how the more common levels are calculated, and how to use retracements and extension tools.

The Fibonacci sequence was discovered and developed by the Italian mathematician Leonardo Pisano “Fibonacci” (son of Bonaci Pisano). The Fibonacci Sequence, published in the year 1202 in his book “Liber Abaci” (Book of Calculus), exposes the problem of growth of a population of rabbits based on specific assumptions. Fibonacci concluded that each month the density of rabbit pairs was increasing from 1 to 2, then from 2 to 3, the next month from 3 to 5 and so on to infinity. In mathematical terms, the Fibonacci Sequence is:

In practical terms, the Fibonacci Sequence is:

 Understanding The Fibonacci Sequence

Now that we have calculated the sequence, we will determine the proportions that are related to this number series. In the first place, we will calculate the “Golden Ratio” or Phi (Φ) = 1.61803 and its inverse phi (1/Φ = φ) = 0.61803. Brown (2008) defines the Golden Ratio as a universal law that explains how everything with a growth and decay cycle evolves. In Table 2, we can see how the Fibonacci sequence converges to ratios 1.618 and 0.618; this can also be seen graphically in Figure 1.

The Fibonacci Sequence

1.618 and 0.618 Convergence

Fig 1: 1.618 and 0.618 Convergence (Source: Personal collection)

Fibonacci Levels Formation

Before calculating the various levels of Fibonacci, it is necessary to expose the concepts of retracement and projection. In figure 2, the US Dollar Index <DOLLAR> began a bearish movement on the 3rd of January 2017, registering a maximum level of 103,785, this move recorded a minimum lower than the previous minimum (99,465), after having reached 99,195 on the 2nd of February 2017, going back to 102,270. Once it reached this level, a new bearish cycle began with a projection that reached 90.985. This example is analogous to the bullish case.

Fibonacci Levels Formation

Fig 2: Retracement and Projection Movements. (source: Personal Collection)

Using the levels Phi Φ (1.618) and phi φ (0.618), we will calculate the different Fibonacci levels, as follows in Table 3:

Fibonacci retracement and projections calculation

Some traders prefer to use the level 0.764 and not 78.6, and vice-versa; this is not a critical factor for analysis and trading, the relevant factor is the decision that could take place when the price reaches this zone. Additionally, it is usual to add some levels in projections, for example, 227.2, 238.2, 3, 327.2, and so on.

Considering the example of the US Dollar Index, in figure 3 the DOLLAR finds resistance at 61.8 level (102.032), where the new bearish cycle takes place in continuation. We do not consider the F(61.8) as a per se rule strictly, sometimes the price finds resistance (or support) on another Fibonacci level, it is essential to follow what the price action is doing.

Fibonacci RETRACEMENT

Fig 2: Fibonacci Retracement (source: Personal Collection)


Once we have continuation signals, using the Fibonacci extension tool, we can define a forecast of the price movement target. In figure 4, DOLLAR follows in the bearish direction, the first objective expected is FE(100), FE(161.8) as the second target and third target FE(200). In our example, the Dollar targets are FE(100) 97.672, FE(161.8) 94.83 and finally FE(200) 93.074.

Fibonacci Extension

Fig 4: Fibonacci Extension. (source: Personal Collection)

Notes:

  • F(61.8) means 61.8 Fibonacci Retracement Level.
  • FE(161.8) means 161.8 Fibonacci Extension Level.


SUGGESTED READINGS:

  • Brown, C., (2008). Fibonacci Analysis. New York: Bloomberg Press.
  • Carney, S., (2010). Harmonic Trading Volume 1. New Jersey: Pearson Education Ltd.


KEYWORDS:


Fibonacci, Theory, Retracement, Extension.

©Forex.Academy

Categories
Forex Educational Library

Foundations of Fibonacci Retracements

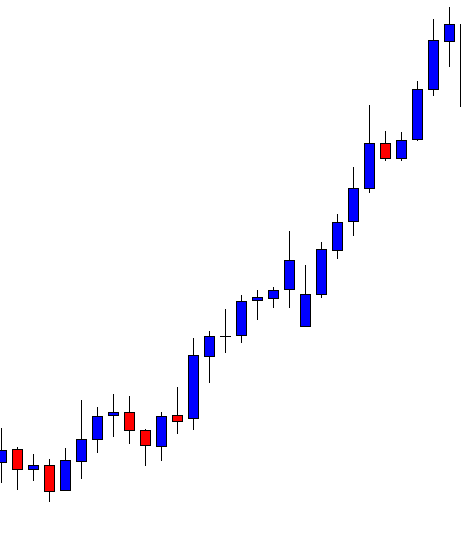
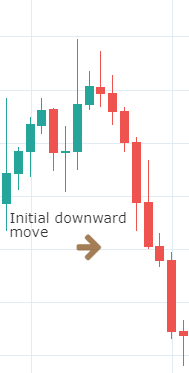
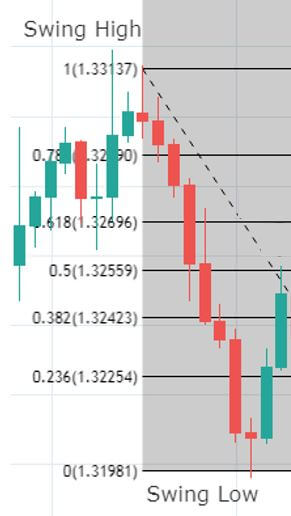
As it shall be further developed throughout this article, the first step when applying the Fibonacci method to construct support and resistance levels of a broader price trend is to identify and connect lower and higher points of wave impulses before a bullish move, and higher and lower points when the move is bearish.

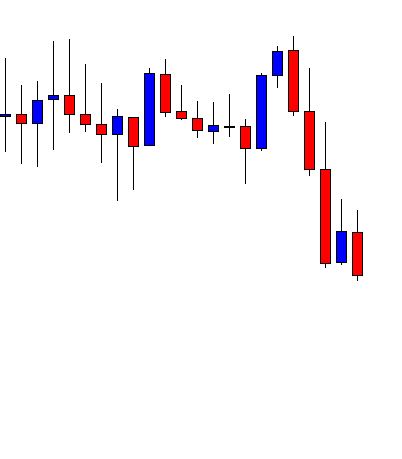
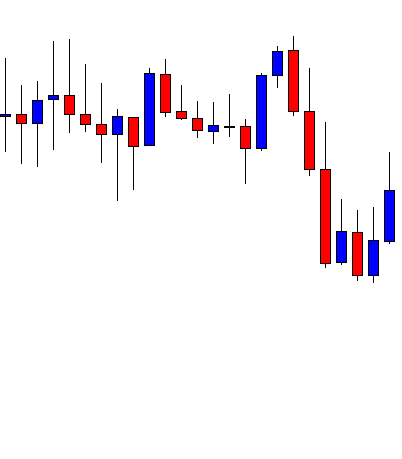
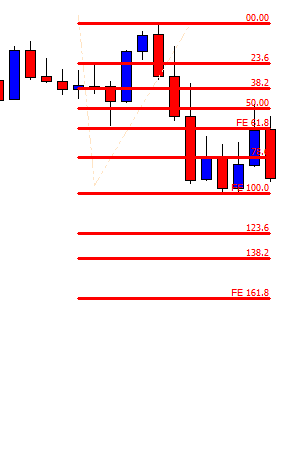
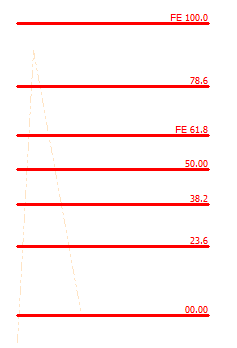
It is important to notice that Fibo percentages of any range when taken from high to low and from low to high correspond to 100. For example, as it is shown in the graph below, if one connects the higher and lower price levels of a bearish wave, the distance between the highest point and the 61.8% retracement equals 38.2% retrace if the connection was to be made from the lowest to the highest points in an inverted symmetric wave. In other words, Fibonacci retracements determine portions of the wave that coincides to 100 when summed up, so that the high price is to 61.8% as the lowest price is to 38.2%. The observation described above has immense implications when attempting to predict the strength of price after a breakout of a given cluster in concordance with other analytical tools. For instance, a 61.8% retracement would indicate that the counter-move is deep enough for us to regard price as losing steam in a broader trend so that a break higher or lower is more likely to complete the 38.2% extension. After all, Fibo ratios are, like any other technical tools, instruments of price prediction and not written-in-stone dogmas.

Foundations of Fibonacci Retracements

The graph above is taken on the USD/CAD and shows the simplest process of connecting the highest and lowest price points of a bearish wave in order to determine resistance levels of a possible retracement move.

When applying Fibo techniques to determine support and resistance price levels, it is important to avoid the following very common mistakes:

  1. Not any High or Low should be plugged with every Low or High to construct resistance or support levels respectively. The reason for this is that;
  2. Not every time interval has the same robustness, i.e., faster time-frames could see the complete counter-move as profit-taking without negating the impulse of a broader trend while a smaller counter-move of a broader time-frame could also be the completing of a broader wave.
  3. Depending on the chosen time-frame of the graph, a wave can be completed or not, thus the Fibo levels are correctly or incorrectly constructed. For example, some authors suggest that it is best to build Fibonacci retracements levels in ranges that include strong price impulses; or ranges when a subsequent sub-wave marks the final thrust of the price.
  4. The time validity of any Fibo setup depends on both the underlying time-frame of the graph and the degree with which a charted range has developed. Put it differently, when considering price as a “living entity”, it is relevant to notice that every technical setup is valid to a certain point and time.

Consequently, constructing Fibo retracement is far more complex than simply connecting some random Highs with Lows or Lows with Highs. Albeit the popularity of Fibo techniques, mainly due to its predictability power, they are only a method that should, in fact, be combined (better to say, completed) with other techniques. The cornerstone of Fibo retracement (and extensions) relates to the degree of robustness of the resulting pivots in terms of the strength with which such price levels succeed in preventing price breakouts, i.e., how well they serve as thresholds that manage to “hold” price within a given range in time and frequency.

It is typically assumed that robust support and resistance levels are the results of using Fibo tools from different divisions and sub-divisions of a certain price range. In other words, any price wave (i.e., oscillation) can be circumscribed in broader waves when observing the chart in a slower time-frame. For example, an 800-pips wave on a monthly chart could easily contain 10 sub-waves on a daily chart and 100 mini-waves. By incorporating slower charts, i.e., wider ranges, we achieve more robustness to the analysis. Adding multiple time-frames allows us to transform simple price levels into clusters and when such areas prove to consistently contain price, they become pivots.

A multi-dimensional approach is belonging (in its simplest form) to a third analytical methodology known as relational. Every trader must print robustness to the price levels he constructs so that a faster and more frequent scalper would combine the 5, 15 and 60 minutes charts while a long-term and more fundamental oriented trader would consider the 4 hours, daily and weekly charts. That leads us to the assumption that there is no “correct” or “incorrect” way to apply Fibo when building up supports and resistance levels; a construction is better or worse depending on how much it fulfills the needs of the trader.

Fibonacci Retracements

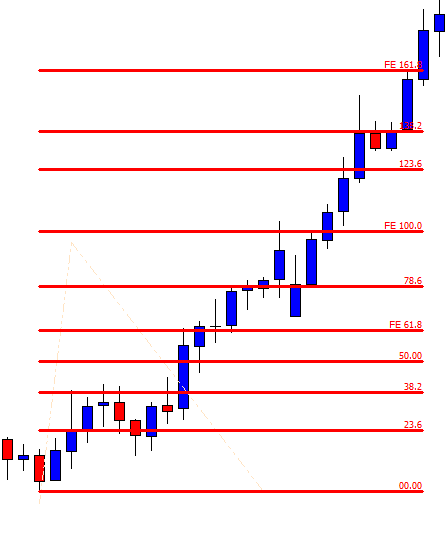
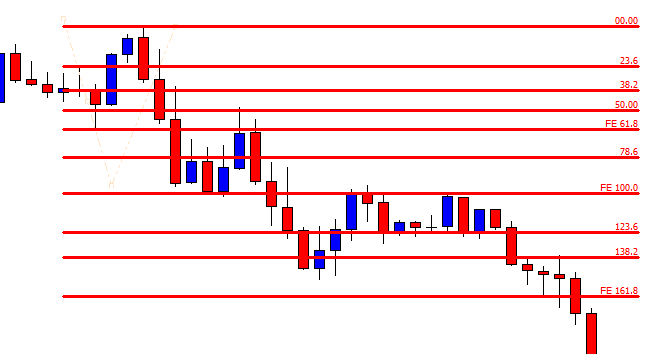
In the graph, you can see how the Fibonacci retracements should be applied if you want to find market resistance. Also, you can see that the market respects on several occasions important Fibonacci percentages such as 38.2%, 50% and 61.8% over the monthly period.

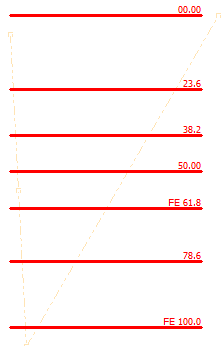
In the second example, you can see how Fibonacci retracement should be plotted to find market supports. The range was drawn from the bottom to the top of a bullish trend before subdividing the range to find market supports.

Foundations of Fibonacci Retracements - FA

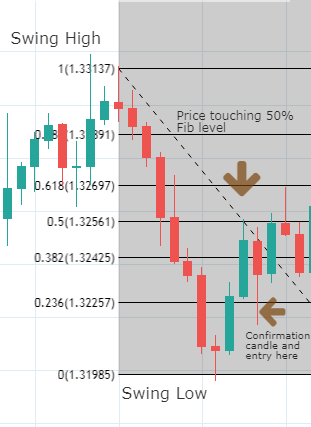
How to find the range to apply Fibonacci if the market is constantly expanding and shrinking continuously and the oscillations are not symmetrical? To start creating the ranges, there are occasions where the market gives the starting points to locate these ranges. For example, when there are gaps in a bearish market, you can locate the 50 Fibonacci percentage right in the middle of the gap trying to get it aligned. But it is not enough to align the line of 50% with the gap, it is necessary to observe that the high and low prices and the subdivisions are respected by the market in different horizons of time. For this, the subdivisions must be plotted to the axis so will be easier to see if the market has respected these points in its various oscillations. In addition, some points of the subdivision although they have not generated a rebound of the market, can be areas where it begins to develop a strong trend whether bullish or bearish.

After the correct range is selected, the question arises as to whether Fibonacci subdivisions within the range are major resistances or supports. To answer this, you must define a second range with the same starting point of the previous range, but with a different length. When these two ranges have been created, an entry goal will be generated that is called a confluence zone (i.e., price cluster). This area of confluence is formed when different Fibonacci ratios of several ranges overlap each other, showing that there are areas where Fibonacci levels fall at the same market price, it should be clarified that they are not necessarily the same percentages of the ranks.

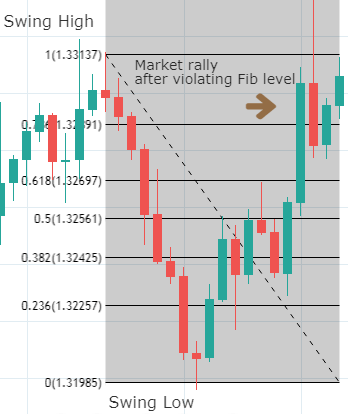
The confluence areas are tipping points in the price and these areas determine higher supports or resistances. Already knowing the areas or prices that are major resistances or supports, it will be possible to project the direction of the market in the future because it will be known which areas will generate a rebound in the market, or if it is the case that the market breaks it will trigger a strong movement when the market continues its tendency without rebounding. With this knowledge of important points, you can put stop loss points if the market rally takes an unexpected direction or if it exceeds areas of confluence.

To be more confident which will be the correct direction of the market, we need to create a third rank with their respective subdivisions. When the third rank is made in the market, we must be sure that its subdivisions have been respected by the market in the past more than once to ensure that they are not minor resistances or supports. With the third range already made, it will be possible to see sometimes that there is more than one zone of confluence between the subdivisions of the ranks. A key element will be to locate the stop-loss outside of the confluence zones because if it is located between these will not achieve the goal of stopping the losses but possibly stop the gains if a rebound is generated in the areas of confluence. It is also important to mention that Fibonacci ranges should be larger when the trade is long term to be able to observe the entire market panorama than in a short-term position and therefore also the stop loss point will be farther away in long-term horizon operations.

For example, the following graph shows the EUR/USD with three ranges traced with Fibonacci retracements. As you can see, there is a confluence zone around the price 1,19949 since several of the subdivisions of the ranks coincide at this point, forming a major resistance as it began to trace from a low price to different high prices. Another example to see the stroke of the three ranges and their confluence zones is the next graph of the AUD/USD, where you can see several areas of confluence that will be major supports given the way the ranges were plotted from a high price to different low prices. Below the area of 0.89870, there is a major support as well as the level of 0.69470.

Fibonacci Retracements Chart

Fibonacci Chart

 ©Forex.Academy