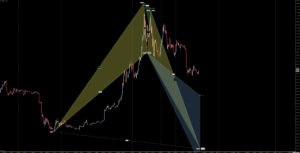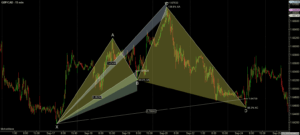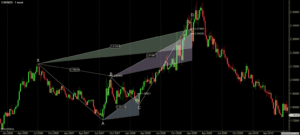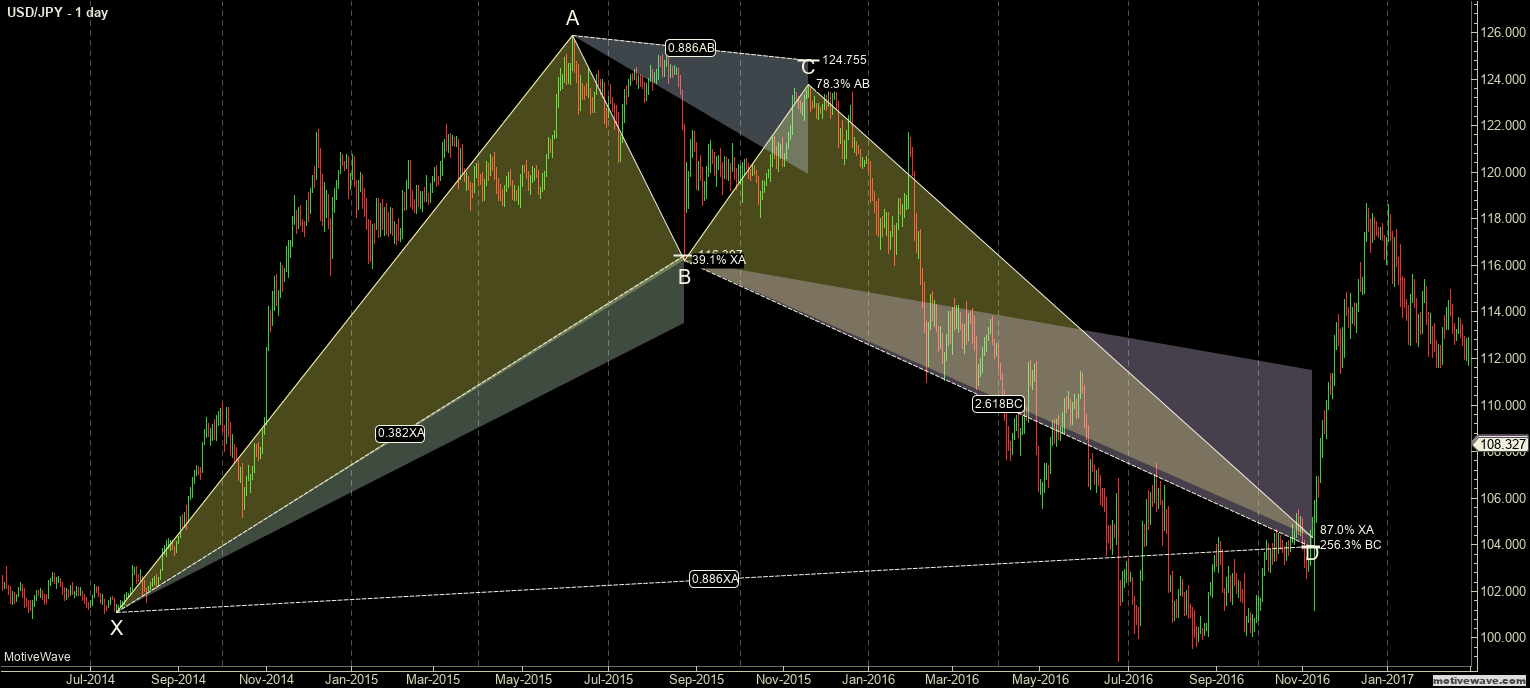
Harmonic Pattern Example: Bearish Bat

The Bat Pattern
The Bat Pattern is another harmonic pattern that was not identified by Gartley, but instead by the great Scott M. Carney – found in Volume One of his Harmonic Trading series (I believe that Mr. Carney’s work is essential in your trading library).
I am particularly grateful to Carney’s work because it was his work that introduced me to a very powerful Fibonacci retracement level: 88.6%. Previously, I have followed Connie Brown’s suggestions in her various books utilizing only the 23.6%, 50%, and 61.8% Fibonacci levels – the 88.6% is now a near-constant in my own analysis and trading. That particular level, the 88.6% level, is the primary level to reach with the Bat pattern.
One of the key characteristics of this pattern is the strength, power, and speed of the reversals that occur after a confirmed and completed pattern is verified. As a Gann based trader, this is the pattern I personally look for to identify the ‘confirmation’ swing in a new trend (the first higher low in a reversing downtrend and the first lower high in a reversing uptrend).
Bat Pattern Elements
- B wave must be less than the 61.8% retracement of XA – ideally the 38.2% or 50%.
- BC projection must be at least 1.618.
- The AB=CD pattern is required and is often extended.
- C has an expansive range between 38.2% and 88.6%.
- The 88.6% Fibonacci retracement is a defining and particular level to the Bat Pattern.
- The 88.% D retracement is the defining and exact limit of the end of this pattern.
Ideal Bullish Bat Conditions
- 50% retracement of XA.
- Exact 88.6% D retracement of XA.
- BC wave 200%.
- Alternate AB=CD 127% is required.
- C should be inside the 50% and 61.8% retracement range.
Ideal Bearish Bat Conditions
- B wave must be less than the 61.8% retracement of XA – ideally the 38.2% or 50%.
- BC projection must be at least 88.6%.
- BC projection minimum of 161.8% with the max extensions between 200% to 261.8%.
- AB=CD is required, but the Alternate 127% AB=CD is ideal.
- C wave retracement can vary between the 38.2% to 88.6% retracement levels.
Sources: Carney, S. M. (2010). Harmonic trading. Upper Saddle River, NJ: Financial Times/Prentice Hall. Gilmore, B. T. (2000). Geometry of markets. Greenville, SC: Traders Press. Pesavento, L., & Jouflas, L. (2008). Trade what you see: how to profit from pattern recognition. Hoboken: Wiley.