Introduction
We have learned the importance of Harmonic patterns in our previous articles. We also understood a couple of interesting harmonic patterns – The Butterfly & AB=CD. In this article, let’s understand what a ‘Bat’ pattern is, and how to make money trading this pattern. The Bat pattern is a part of the Harmonic group, and ‘Scott Carney’ discovered this pattern in the year 2001. Out of all the patterns present in the harmonic group, Bat pattern has the highest accuracy. This pattern can be extremely profitable when traded correctly.
It works very well on all the timeframes but try not to trade it in smaller timeframes because the price in these timeframes tends to reverse quickly. The Bat pattern comes in both bullish and bearish variations and is made up of five swing points X, A, B, C, and D. In a downtrend, the appearance of a bullish Bat pattern indicates a bullish reversal. In an uptrend, the appearance of a bearish Bat pattern indicates a bearish reversal.
One of the critical characteristics of the Bat pattern is the power, speed, and strength of the reversal that occurs after the appearance of this pattern on the price chart. Fibonacci ratios are the core strength of any harmonic pattern, and thanks to the advanced technology for providing the Fibs ratios to the Bat pattern to increase its accuracy.
Bat Pattern Rules
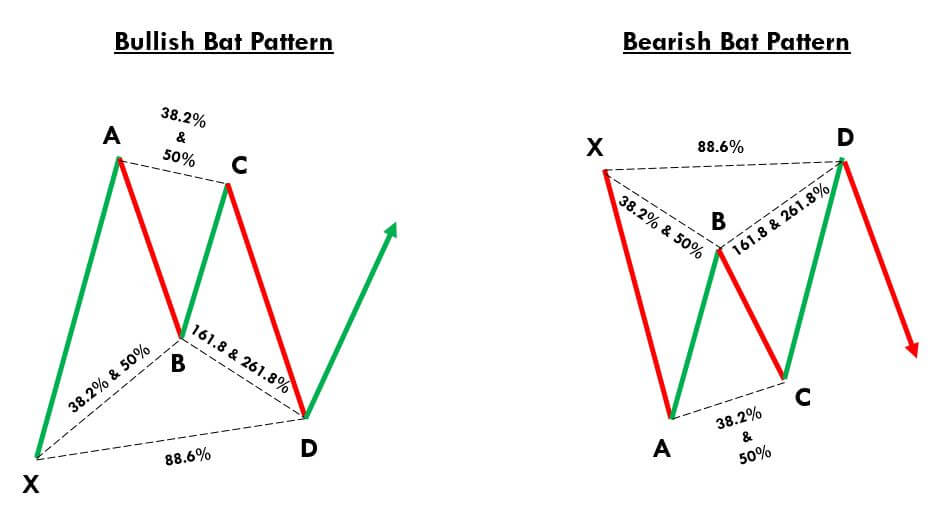
Just like most of the harmonic patterns, the Bat pattern is a four-leg reversal pattern that follows specific Fib ratios. A proper Bat pattern needs to fulfill the below criteria.
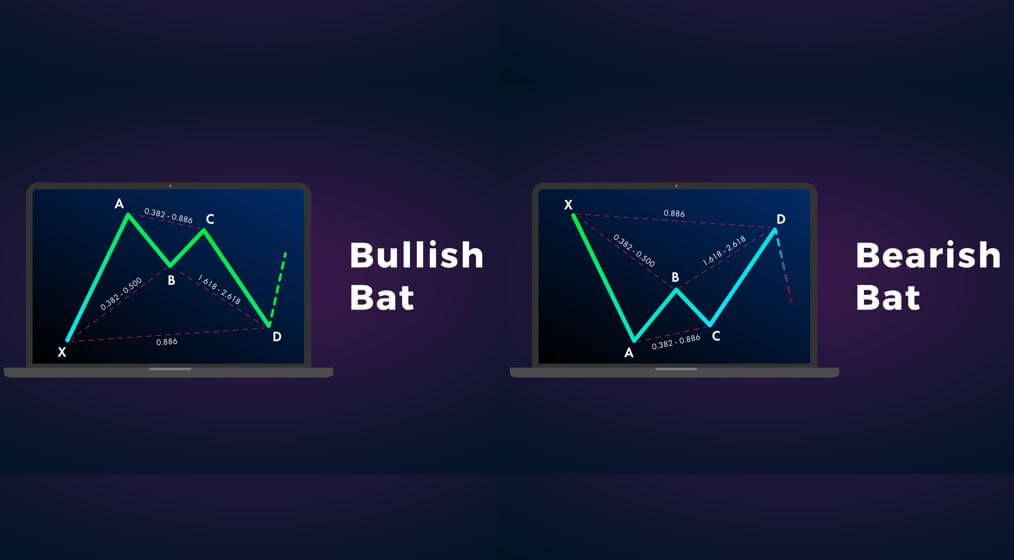
‘X-A’ – In its bullish form, the first XA move of the Bat pattern could be any random upward move on the price chart.
‘A-B’ – For a Bat pattern to get validated, the AB leg’s minimum retracement should be 38.2% of XA leg or maximum of 50% Fib levels. Scott Carney suggests that the retracement at 50% Fibs levels increase the accuracy of the signal generated.
‘B-C’ – The BC move can retrace up to a minimum of 38.2% Fib level of AB and a maximum of 88.6%.
‘C-D’ – CD is the last move that confirms the Bat pattern. This move should be at 88.6% Fibs retracement of XA leg, or it should be between 161.8% or 261.8% Fibs extension of the AB leg.
For a bearish Bat pattern, point X should be at a significant high. Conversely, for a bullish Bat pattern, point X should be at a significant low.
Below is the pictographic representation of the Bat Harmonic Chart Pattern.
Bat Pattern Trading Strategy
Trading The Bullish Bat Pattern
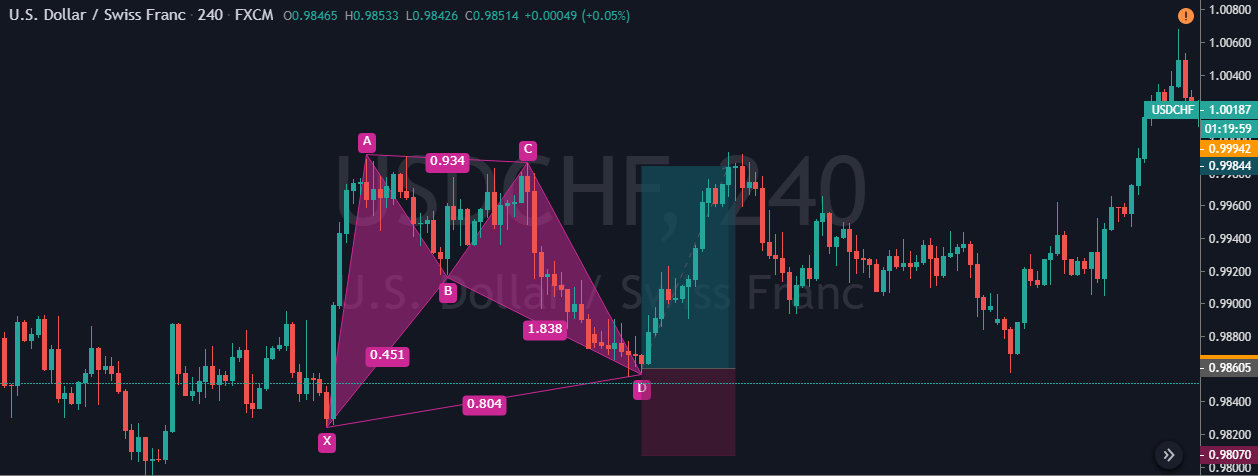
In the below USD/CHF four hours chart, we can see the formation of a bullish Bat pattern. These days, on most of the trading platforms, we can find all the harmonic tools which are combined with Fib levels. These tools get extremely handy when we need to quickly confirm the pattern. We use TradingView charts, and the harmonic pattern tool can be found in the left-side toolbar.
Coming to the strategy, our starting point X was at 0.9840 from where the move has started. The price action started to counter the trend from 0.9984. Let’s consider this as our point A, and the XA is nothing but a random bullish move in the market. Now we located our first swing high, so the next step is to count the market wave movement. The AB move retraces at 38.2% of the XA move, and the BC move goes up again and retraces at 88.6% of AB. Furthermore, the market prints the last move of the pattern, which is at 88.6% level of the XA move. So now we have got all the four touch patterns for a bullish Bat pattern on the price chart.
While back-testing, we found the market blasting to the north whenever the CD move finishes at 88.6% level. This is the reason why we took the buy entry as soon as the price-action completes the CD move. Overall it was an excellent risk-reward ratio trade. Also, when the CD move touches the 88.6% Fib level, it always provides a decent risk-reward ratio. The stop-loss is placed below the ‘X,’ and take-profit can either be placed at A or C points.
Trading The Bearish Bat Pattern
Both the bearish and bullish Bat patterns have the same rules. The only difference is that it appears inversely. So in this strategy, let’s trade the bearish Bat pattern with at most accuracy.
In the below NZD/USD daily chart, we have identified a bearish Bat pattern. The very first move has started from point X and ends at point A. This can be considered as a random bearish move. The price action has then reversed back and retraced at 38.2% level of the XA move forming the AB move. The market then goes into the counter direction and forms a BC leg, which is also retraced at 38.2% Fib level of the AB leg. The last leg was the CD move, and it finished close to the 88.6% Fibs level.
These swing highs and lows confirm the formation of a bearish Bat pattern on the price chart. So when the price action prints a bearish confirmation candle, we went short in this pair. Scott Carney described the points B, C and A as the first, second, and third target respectively. We can book profit at any of these points, or we can hold for deeper targets depending on the market situation.
In this particular trade, we didn’t book profits at B or C after seeing the momentum of the price. We were sure that the price could easily reach the last target. The price action did hold at point C for a longer time, which indicates that this trade might not work. Any armature trader would have panicked and closed their trades at breakeven.
But, as mentioned, whenever an ‘almost perfect’ Bat pattern is formed, the trade will definitely work. We must be patient and confident enough to stick to the strategy. Stop-loss placement is crucial, and one thumb rule while trading harmonic patterns is to place the stop-loss just below point X.
Conclusion
In short, harmonic patterns imply that the trends can be subdivided into smaller or larger waves using which the future price direction can be predicted. These harmonic patterns only work if the fibs ratios are aligned with the pattern. Some traders do not believe the authenticity of harmonic patterns, but we assure you that you can trade these patterns confidently. This ends the discussion on the Bat pattern. Remember that this pattern provides accurate entries as well as good RRR trades compared to other harmonic patterns. In the upcoming articles, let’s discuss Gartley and Crab patterns, which are equally important to learn.
We hope you find this article informative. In case of any questions, please let us know in the comments below. Cheers!

