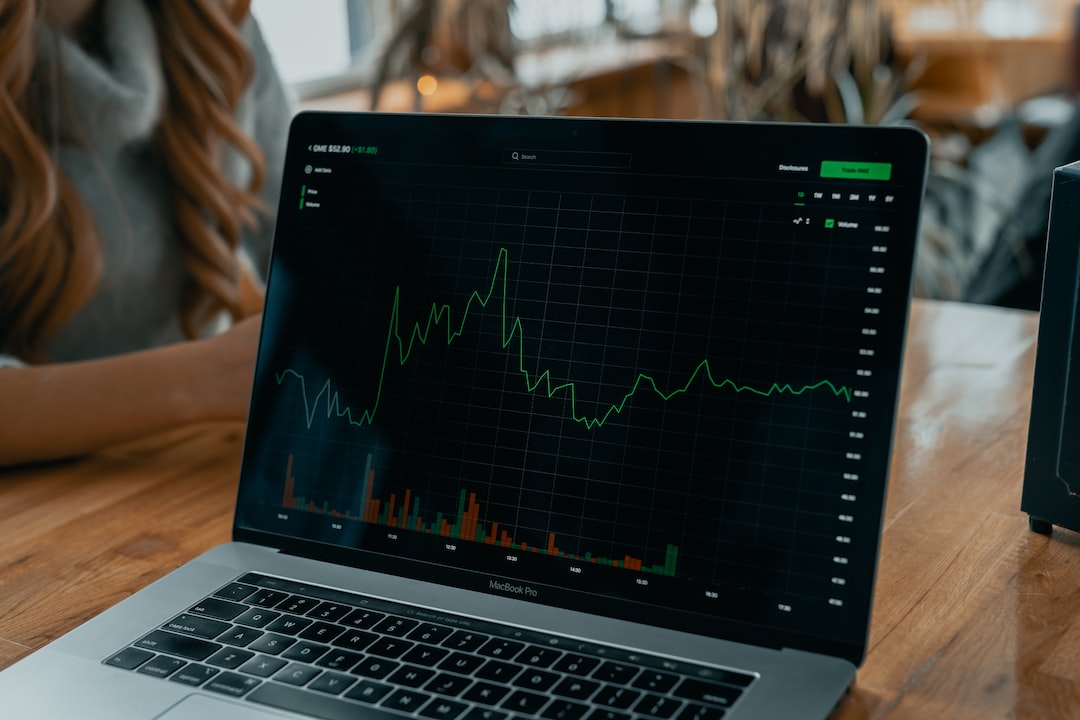
Harmonic forex chart patterns are an essential tool for traders to predict the future price movements of a currency pair. These patterns are formed by a series of price movements that conform to specific Fibonacci ratios, which are believed to be significant levels of support and resistance. By analyzing harmonic patterns, traders can project how far a currency pair may go in the future, giving them an edge in making profitable trading decisions.
Here are some steps to follow when projecting how far a harmonic forex chart pattern may go:
Step 1: Identify the Harmonic Pattern
The first step in projecting how far a harmonic forex chart pattern will go is to identify the pattern you are dealing with. There are four main harmonic patterns: the Gartley pattern, the Butterfly pattern, the Crab pattern, and the Bat pattern. Each of these patterns has specific ratios and levels of support and resistance that must be met to be considered a valid pattern.
Step 2: Measure the Pattern
Once you have identified the pattern, the next step is to measure it. This involves drawing Fibonacci retracement levels on the chart, from the high to the low of the harmonic pattern. These levels will help you determine the potential levels of support and resistance that the price may encounter during its movement.
Step 3: Calculate the Price Target
To project how far the harmonic forex chart pattern will go, you need to calculate the price target. The price target is typically calculated using Fibonacci extensions, which are also drawn on the chart. The extensions are drawn from the low to the high of the harmonic pattern, and the levels are based on the Fibonacci ratios of 1.272, 1.618, 2.618, and 4.236.
Step 4: Confirm the Pattern
Before making any trading decisions based on the projected price target, it is important to confirm the pattern. This can be done by analyzing other technical indicators such as moving averages, momentum indicators, and volume. If these indicators support the projected price target, then it is more likely to be accurate.
Step 5: Manage Your Risk
No matter how accurate your projection may be, there is always a risk involved in trading. Therefore, it is essential to manage your risk by setting stop-loss orders and taking profits at predetermined levels. This will help you minimize your losses and maximize your profits.
Conclusion
Harmonic forex chart patterns can be a powerful tool for traders to project how far a currency pair may go in the future. By following the steps outlined above, traders can identify, measure, and calculate the price target of a harmonic pattern, confirm it with other technical indicators, and manage their risk. However, it is important to note that no projection is foolproof, and traders should always exercise caution when making trading decisions.


