Categories
Forex Price Action

Fibonacci Trading: Fibonacci Levels Maximize Profit for Intraday Traders

In today’s lesson, we are going to demonstrate an H1 chart offering an entry by using intraday support/resistance. To go with it, Fibonacci levels are used to spot out the stop-loss and take-profit levels. Let us now get started.

The chart shows that the price makes a long bearish move. The H1 chart makes a breakout at the last day’s lowest low (black drawn line). Usually, the chart attracts the sellers to look for short opportunities upon getting a bearish reversal candle. However, look at the combination of the last three candles. It is called Morning Star, which is one of the strongest bullish reversal patterns.

The price heads towards the North and goes back in the last day’s lowest low. Moreover, it makes a breakout at today’s highest high as well (black drawn line). Within four candles, the chart looks good for the buyers. The buyers may look to go long in the pair upon getting a bullish reversal candle at the breakout level.

The chart produces a bearish candle. The breakout level seems to hold the price as a level of support. A bullish reversal candle at the level may attract the buyers to go long and push the price towards the North further.

Here it comes. The chart produces a bullish engulfing candle right at the breakout level. The buyers may trigger a long entry right after the last candle closes by setting stop loss below the lowest low of the signal candle. We are going to talk about the take profit level in a minute. Let us find out how the trade goes.

The chart produces a bullish candle. The price heads towards the upside with the next candle as well. However, the candle comes out as a Doji candle having a long upper shadow. It suggests that the price may make a bearish correction or make a bearish reversal. Since the trade setup is based on the H1 chart, the buyers may lose a good number of pips if they are to wait for the chart to produce a reversal candle to close their entry. It is tough to manage trade in the H1 chart manually. Thus, setting the take profit is the best way. The question is, where should we set our take profit? In this regard, Fibonacci levels come extremely handy. Let us draw the Fibonacci levels in the chart and find out how they work in the chart above.

There you go. The price produces a bullish reversal candle at 61.8% level and heads towards the level of 161.8%. It means the buyers may achieve 1:2 risk-reward easily by using Fibonacci levels in intraday trading. In our fore coming lessons, we are going to demonstrate more examples of integration of Fibonacci levels and intraday trading. Stay tuned.

Categories
Forex Daily Topic Forex Fibonacci

Fibonacci Trading: Fibonacci Levels Help Traders be Precise

Fibonacci Trading: Fibonacci Levels Help Traders be Precise

In today’s lesson, we are going to demonstrate an example of a chart where the price makes a bullish move from 78.6% Fibonacci level. The 78.6% Fibonacci level often makes the price reverse towards the trend’s direction. In today’s example, the price produces a Morning Star and heads towards the trend’s direction with good bullish momentum. Let us see how it happens.

It is an H4 chart. The price produces double bottom and heads towards the North with good bullish momentum. On its way, it produces only a single bearish candle. The buyers are to wait for the price to make a bearish correction and to get a bullish reversal candle to go long with a good risk-reward in the pair.

The chart produces a bearish inside bar. Then, it produces one more bearish candle. Look at the last candle. It comes out as a doji candle. It seems that the price may have found its support. A strong bullish reversal candle may attract the buyers to go long in the pair and push the price towards the North to make a new higher high.

The chart produces a bullish engulfing candle. The combination of the last three candles is called Morning Star. This is one of the strongest bullish reversal patterns in the Forex market. The buyers may trigger a long entry right after the last candle closes. They may set stop loss below the signal candle’s lowest low. We’ll find out the take-profit level in a minute. Let us first see how the trade goes here.

The price heads towards the trend’s direction with extreme bullish momentum. The last candle comes out as a bearish inside bar. It may make a bearish correction now. Some sellers may close their trade manually after the last candle. You may notice if they do that, they lose a few pips. How about if we knew that the price may make a bearish reversal from here before the last candle is produced. Yes, it is possible by using Fibonacci levels. Let us draw Fibonacci levels on the chart.

The chart shows that the price trends from 78.6% level. When the level of 78.6% makes the price move, it usually makes a reversal at 138.2%. Thus, if we set our take profit at 138.2%, we do not have to wait to get a bearish reversal candle to close our trade manually. It saves our time and gets us more pips too. This is why Fibonacci (extension/ retracement) is called a magic trading tool, since it helps traders in taking and exiting with precision.

Categories
Forex Fibonacci

Fibonacci Levels: How Much Does 50% Level Influence the Market?

In today’s lesson, we are going to demonstrate an example of a chart, in which the price makes a reversal from 50% Fibonacci level. We know if the price makes a reversal from 61.8%, it usually goes up to 161.8%; if it makes a reversal from 38.2%, it goes up to 138.2%. In both cases, traders get good risk-reward. Do you ever wonder what happens if the price makes a reversal from 50%? Let us find this out through an example.

The chart shows that the price heads towards the South with good bearish momentum. It produces two bullish candles and heads towards the South. Look at the last candle. It comes out as a bullish inside bar. It makes a bullish correction. However, the sellers may wait for a bearish engulfing candle to go short in the pair.

The price has been in a bullish correction. It produces some bearish reversal candles, but it does not create any bearish momentum. The last candle comes out with a little bullish body having a long upper shadow. Let us proceed to the next chart to find out what happens next.

The last candle comes out as a bearish engulfing candle. It is a strong sign that the price may head towards the South again. The sellers may flip over to the minor chart to trigger entry.

The price heads towards the South with extreme bearish pressure. The last candle comes out as a bearish Marubozu candle. It seems that the price may continue its bearish journey towards the South further. Let us find out what actually happens.

It does not continue its bearish journey. It finds its support. Upon producing a hammer, it heads towards the North with one more bullish candle. It seems that it may continue its bearish journey considering bearish engulfing candle as a reversal candle. Next, two candles come out as strong bearish candles too. What may be the reason that the price makes a bullish reversal here? Let us find this out with Fibonacci levels.

If we calculate, we find that the price makes a bearish reversal from Fibonacci 50% level. It then heads towards the South with extreme bearish momentum. However, it finds its support at the Fibonacci 100.00 level. Usually, this is what happens when the price trends from the 50% level. A question may be raised here whether we should take entry if the price trends from the 50% Fibo level. It depends on risk-reward. If it offers a good reward, then we may take an entry. In most cases, it does not offer a good reward; thus, we may skip taking those entries.


Categories
Forex Course

121. Trading The Bullish & Bearish AB=CD Harmonic Pattern

Introduction

The ABCD is one of the most straightforward patterns in the Harmonic lot. There are two types of ABCD patterns – Bullish AB=CD & Bearish AB=CD. For both the bearish and bullish versions, the AB and CD lines are the legs, whereas the BC line is considered the Retracement or correction. To confirm the formation of this pattern, we use Fibonacci levels that we have discussed in the previous course lessons.

By using the Fibonacci tool on leg AB, see if the BC retracement is reaching the 0.618 level. Next, the line CD should be the extension of 1.272 Fibonacci extensions of BC. This rule applies to both bearish and bullish AB=CD patterns. We go long or short when the price action reaches the point D of the corresponding pattern formed.

How To Trade The ABCD Harmonic Pattern

Bullish ABCD Pattern

The chart that you see below represents the formation of a bullish AB=CD pattern. The CD leg of the pattern is equal to the size of the AB leg. The BC move, which is a pullback, is 61.8% retracement of the AB move. Likewise, the CD move is the 127% retracement, which confirms the formation of a bullish AB=CD pattern on the EUR/USD Forex pair.

We have entered the market at point D, and the stop-loss is placed just below the D point. As you can see, we went for smaller stops, and there is a reason behind it. If the price action goes below point D, the pattern automatically gets invalid.

There are two take-profit areas in the pair. The first one is at point C, and the second is at point A. It all depends on at what point you desire to close your position. It is always advisable to close your positions at higher targets because the end goal for us is to milk the market as much as we can.

Bearish ABCD Pattern

The below NZD/CAD Forex pair represents the formation of a bearish AB=CD pattern. The AB leg of the pattern is equal to the CD leg. Furthermore, the BC is respecting the 61.8% retracement of the AB move, and the CD move was close to 127% extension of the BC move. We have gone short at point D as the price breakout happened.

In this example, we went for deeper targets. If the momentum of the prevailing trend is strong enough, going for a new lower low will be a good idea. The key to winning in trading is to follow the rules and think according to the market situation. These Harmonic patterns require a lot of patience and effort to trade. So it is strongly recommended to master this pattern in a demo account than to trade it in a live market.

Conclusion

The AB=CD is a reversal pattern that indicates the market trend reversal. The AB=CD pattern consists of three legs, and they form the zig-zag shape. This pattern is also known as a lightning bolt, as it looks like one. The AB=CD pattern can be used in any financial market and also in any trading timeframe. Follow the rules, no matter what, to make consistent profits from this pattern. Always execute your trade at point D and ride for the brand new higher high/lower low. Cheers.

[wp_quiz id=”76393″]
Categories
Forex Service Review

FiboPlus Fibonacci-Based Indicator Review

FiboPlus is a piece of software that can be found within the Indicators section of the MQL5 marketplace, there may be other indicators with similar names, so we have provided a link below so you know exactly which one we are talking about. The FiboPlus was created by Sergey Malysh on the 12th of September 2016, it has since been updated a number of times, the most recent update was on the 29th of December 2017 and the indicator is now on version 3.0.

Overview

FiboPlus is an indicator that has been designed for the MetaTrader 4 trading platform, it is a stated as a ready-made trading platform, based on the automatic construction of Fibonacci levels for both buying and selling, it can be used on any instrument and on any timeframe.

Some of the FiboPlus features:

  • Detection of trend direction (14 indicators)
  • Construction of horizontal levels, support and resistance lines, channels
  • Selection of a variant for calculating Fibonacci levels (six different methods)
  • Alert system (on-screen, E-Mail, Push notifications)

There is a wide range of parameters that can be changed, these will slightly alter the way that the indicator works, these include things like the language, the Fibonacci level options, alert settings, turning alerts on or off, emails, colors and more.

Service Cost

The indicator can be purchased outright for $80, this will give you unlimited access and use. You are also able to rent the indicator, there are a number of different options for renting it, you can rent it on a monthly basis which will cost you $20 per month, for three months it will cost you $40, for 6 months it will cost $50 and to rent it for 1 year it will cost you $70. There is also a free version available, this will have some limitations but we are not sure what they are.

Conclusion

There are six different reviews available for the FiboPlus indicator, each and every one of them is giving it a 5 out of 5 ratings.

“Inexpensive little helper 🙂 It helps me see the overall trend across multiple TF. Also, I use the S/R feature quite a bit.”

“Best indicator I’ve ever used so far! Made a lot of profit with it. Very valuable. I was looking all over the net for a Fibonacci indicator or EA and this is the best one I found.“

“I love using Fibonacci and finally I came across an indicator that does an excellent job with Fibonacci analysis. Looks good and works great!! Well done to the programmer.”

So there is a lot of positivity around the indicator and it seems to be working as intended. We would recommend that you download the free version, this will give you the opportunity to test it out and to make sure that it both suits your requirements and that you are able to get it set up correctly without any issues.

This Forex Indicator is currently available in the MQL5 marketplace: https://www.mql5.com/en/market/product/18097

Categories
Forex Fibonacci

Fibonacci Trading: How Fibonacci Levels Give Clues to the Traders

In today’s Fibonacci lesson, we are going to demonstrate an example of a chart, which makes a bearish move. We dig into the charts and find out how we can take an entry based on Fibonacci levels and how the levels may help us giving clues to execute our plan. Let us get started.

The above figure shows an H1 chart. The chart shows that the price makes a bearish move at a moderate pace. It seems that the price finds its support. It has been having consolidation around the level of support having bounces three times. The last candle in this chart comes out as a bullish Marubozu candle. This may push the price towards the North. However, the sellers may still have the hope that they may get a bearish breakout here. Let us proceed to the next chart to find out what the price does.

The chart produces a bearish engulfing candle breaching the level of support. The pair trades for two more candles after the breakout. An important point is to be noticed here that the price is having an upside correction after the breakout. Sometimes price keeps trending after a breakout, whereas sometimes price makes the correction. Fibonacci levels have an important role to play in this. Thus, if we use Fibonacci levels, we are able to find out whether the price trends or makes correction well ahead. Let us now find out how we take the entry. We are to flip over to the minor chart. Since this is an H1 chart, we may flip over to the 15 M chart to trigger the entry.

Look at the arrowed candle. The candle comes out as a bearish Marubozu candle forming track rail. The candle is formed right at a flipped resistance. A short entry may be triggered right after the arrowed candle closes. The chart also shows how the price heads towards the South after the signal candle. Let us now see the H1 chart with Fibonacci levels.

The chart shows that the price trends from 78.6% level. Thus, it may reverse at 138.2%. It hits 161.8% here. However, we may set our target at 138.2% if the price trends from 78.6% to be safe. The Stop Loss may be set here above 100.0 Fibonacci level.

These are the things we must remember when we trade a chart trending from a 78.6% level.

  1. The price may make a reversal at 138.2.
  2. If the price trends from 78.2%, it most probably makes a correction after the breakout. Otherwise, it does not give a good risk-reward as well.


Categories
Forex Fibonacci

Determining Higher Highs or Lower Lows to Draw Fibonacci Levels

Fibonacci levels are obtained by using higher highs or lower lows. A chart may have many higher highs/lower lows. Thus, Fibonacci levels can be obtained at different levels. A trader may find it difficult to spot out the levels where the price may react. In today’s lesson, we are going to see how different higher highs may lead us to having Fibonacci levels where the price does not react.

This is an H1 chart. The price heads towards the North with good bullish momentum before making a bearish correction. The point can be used to draw Fibonacci levels. The price then makes another bullish move and makes a new higher high. Some traders may want to use the last higher high to draw their Fibonacci levels. To make it clear, look at the chart below.

Some traders may use AB, while some others may use AC to draw Fibonacci levels. These two arms point out Fibonacci levels at different levels. Let us assume that we draw our Fibonacci levels by using AC.

The chart shows that the price after making the last higher high has started having a bearish correction. The buyers are to wait for the price to come at 78.6% level and make a breakout at the level of 100.0 to offer them a long entry. If the 78.6% is breached, 61.8% may do the same and offer them an entry as well. Let us proceed to the next chart to find out what happens next.

The price does not even come at 78.6%. It heads towards the North and makes a breakout at the level of 100.0. The price then never looks back. It hits the level of 161.8% in a hurry. The Fibonacci buyers do not find an entry here since the price does not trend from a 78.6% level. It trends way above the level of 78.6%.

Let us draw the Fibonacci levels with AB arm.

If we draw Fibonacci levels by using AB, we see that the price trends from 78.6% level. One candle breached through the level, but the next candle closes well above the level of 100.0. The buyers may set their target around 138.2% since it trends from 78.6%. However, it goes up to 161.8%.

To sum up the lesson, Fibonacci traders are to be well calculative at the time of selecting the first arm. With AC, there is no correction. The price trends towards the North straight. With AB, the price makes a correction and then makes another bullish move. Usually, a straight arm works well and provides accurate Fibonacci Fibonacci levels. Over here, we have seen that AB provides the Fibonacci levels, where the price reacts and help the buyers take a trading decision.


Categories
Forex Fibonacci

Fibonacci Trading: When Momentum is Lacking

Traders wait for the price to trend from 61.8% Fibonacci level. This is what attracts more traders to trade, which generates good momentum. When the price trends from 61.8% level, it usually goes up to 161.8%. Since the price gets enough space to move, it offers better risk-reward. This is another reason that Fibonacci traders love to trade in a chart when the price trends from 61.8%. However, the Forex market is uncertain. We may see that the price does not head towards 161.8% with good momentum upon trending from 61.8% from time to time. In today’s lesson, we are going to demonstrate an example of this.

This is an H1 chart. The chart shows that the price heads towards the South with good bearish momentum. Upon producing a strong bearish candle, it starts having a bullish correction. Fibonacci traders shall get themselves ready by drawing Fibo levels on the chart to find out potential short opportunities in the pair.

Here it is. The chart shows that the price breaches 78.6% level and trades above the level for two more candles. This means the price is in 61.8% zone. If the price trends from here, it may go towards 161.8% level. Yes, it would be better if the price goes towards the North and trends right from the level 61.8%. Nevertheless, the sellers still are to count the move from 61.8% zone. The chart produces a bearish engulfing candle followed by a doji candle. Since the reversal candle comes out as a bearish engulfing candle forming from 61.8% zone, some sellers may trigger a short entry (some may wait for the price to breach the last lowest low). Let us proceed to the next chart to find out what the price does.

The price heads towards the South and it makes a breakout at the last swing low as well. The pair may get more short orders now. However, the price does not head towards the South. It seems that 161.8% level is far away for the price to reach. It does not usually happen but this is how the Forex market runs. It does not always run on a single equation. A question may be raised here what does a trader do with his entry? Since it is an H1 chart based entry, it must be left behind and let it decide its fate by setting Stop Loss and Take Profit accordingly.

Categories
Forex Course

111. Trading Forex Market Using Elliot Wave Theory

Introduction

In all the previous lessons, we understood the terminology and interpretation of the popular Elliot Wave theory. Now we are well-versed with the subject to apply it to the forex market.

The Elliot Wave Theory is a wide concept and can be traded in several different ways. In this lesson, we shall analyze the forex currency pairs using Elliot wave concepts by combining it with some price action.

The best way to trade the Elliot waves

We know that according to the Elliot wave theory, there are two types of waves. There is an impulsive wave pattern made of 5 waves, and a corrective wave made of 3 waves. The impulsive wave is towards the trend, while the corrective wave is basically a pullback for the overall trend.

As a trader, we need to look for trades that payout well along with less risk. So, it is not ideal to trade all the impulsive waves and corrective waves.

Trade setup 1

The setup is to trade the impulsive waves. In the 5-wave impulsive pattern, three waves are along with the trend and two against it. Out of those three impulse waves, the ideal wave to catch is Wave 2. This is because, the Wave 2 is usually the strongest out of the three impulse waves, which significantly reduces the risk on the trade.

Trade Example

After the market makes the first wave, the price starts to pullback. But while the market is retracing, we won’t know where the market will hold and complete its second wave. So, we make use of other tools to determine where the market will resume its trend.

Consider the below price chart. As represented, the market made its first wave. Then, wave 2 began, where the market started to retrace. But, note that, at this point in point, we cannot confirm the end of wave 2. So, to determine the completion of wave 2, we shall be applying the Fibonacci retracement.

In the below chart, the fib retracement has been applied. We can see that the market began to hold at the 50% level. This hence confirms that wave-2 leg has come to an end. Thus, we can prepare to go long in anticipation of wave 3.

In the following chart, we can clearly see that the market held at the 50% fib level and ended up making a higher high, i.e., wave 3.

Trade setup 2

This is the type of setup where we consider the complete 5-3 wave pattern. In the below chart, the 5-wave impulsive pattern is represented with the black trend lines, while the 3-wave corrective pattern is represented by the red trend lines. Since in an Elliot wave pattern, the high of the third corrective wave must be below low of the first wave in the impulsive wave pattern, we can trigger the sell at the area shown in the chart.

This hence concludes our discussion on the Elliot Wave theory. In the next lesson, we’ll summarize this topic for your better understanding and then pick another interesting course.

[wp_quiz id=”72249″]
Categories
Forex Fibonacci

Fibonacci Levels Help Traders Make Better Trading Decision

In today’s lesson, we are going to demonstrate a chart where the price makes a strong bearish move from a Fibonacci level. It has two messages, which we will find out soon. Let us get started with the chart’s price action.

The chart shows that the price makes a strong bearish move. The last candle comes out as a long bearish candle, which states that the sellers dominate over the buyers. Traders may want to wait for the price to make a bullish correction to go short in the pair with more aggression.

The chart produces a bullish inside bar. The sellers are to keep their eyes on the pair to get a bearish reversal candle to go short. It seems that the pair may produce a strong bearish reversal candle (the signal candle) soon.

The chart produces a bearish inside bar, which is not the sellers’ favorite to go short. The price makes a little bearish move and heads towards the North again. Look at the last candle in the chart. It comes out as a bearish engulfing candle, which is one of the strongest bearish reversal candles.

As expected, the bearish engulfing candle drives the price towards the South. The sellers on the minor chart are going short. Thus, the price is about to make a breakout at the last swing low on the chart as well.

The price makes a breakout at the last swing low and heads towards the South further. Then, it produces two bullish candles in between but continues its bearish journey again. The price may have found its support since it produces four consecutive bullish candles. The price may continue its bearish journey, or it may make a bullish reversal. The bull looks good here. Let us draw Fibonacci levels and see whether it gives us a clue about the trend continuation or a reversal.

The chart produces a bullish inside bar right at 138.2 level. Please note that the price makes its bearish move from 78.6 level. The level of 78.6 has a strong relation with 138.2. If the price trends from 78.6, it often makes a reversal at 138.2. This is what happens here.

To sum up, if we learn the art of using Fibonacci levels and understand how a level is related to others, it becomes easy for us to take trading decisions such as entry, exit, and taking a partial profit. In the end, it makes us prolific traders.


Categories
Forex Fibonacci

Fibonacci Trading: How Fibonacci Levels Can be Used in Trading?

Fibonacci levels and price action around those levels give traders clue what they should do with their potential trade setup. The 61.8% level is the most significant level, which is paid attention by the traders to make a trading decision. The price usually goes towards the level of 161.8% when it trends from 61.8%. Since it creates enough space for the price to travel, different traders trade and make use of the wave-length in differently.  We will learn some other strategies that are integrated with Fibonacci levels. Meanwhile, let us demonstrate an example of a chart where the price reacts at 61.8% and trends towards 161.8% afterwards.

The chart shows that upon producing a double bottom, the price heads towards the North and makes a new higher high. The buyers are to wait for the price to make a bearish correction now.

The price heads towards the South upon producing a bearish inside bar. The last candle comes out as a bearish engulfing candle closing within a flipped support. Let us wait and see whether the level produces a bullish reversal candle.

The price produces three bullish candles at the flipped support. The last candle looks to be the strongest one. The price may head towards the North and makes a breakout at the highest high of the wave.

As expected, the price heads towards the North and makes a breakout at the highest high of the wave. The price continues its journey towards the North further. The last candle on the chart comes out as a bullish candle having a long upper shadow. Do you notice anything interesting here? Look at the next chart.

The price after making a bullish move, it starts having a bearish correction. The price consolidates around the 61.8% level. It produces a hammer and heads towards the North. It makes a breakout at the last highest high and heads towards the North with good bullish momentum. The price hits 161.8% as it usually does when it trends from 61.8% level.

Some traders go long in this chart before the price makes the bullish breakout. As long as 61.8% level produces a strong reversal candle, they trigger their entry. It provides an excellent risk-reward but less winning percentage. On the other hand, some traders trade once the price makes a breakout. This offers not that great a risk-reward but an excellent winning percentage.

Categories
Forex Daily Topic Forex Fibonacci

Fibonacci Trading: The Golden Ratio

Fibonacci trading is one of the most prolific trading methods, which is widely used by Forex traders. Retracement length, Fibo levels as well as reversal candle are three factors that Fibonacci traders need to pay attention to. In today’s article, we are going to demonstrate an example of a chart, which makes an excellent bearish move after having a retracement. The length of retracement, the most significant Fibo level, and the reversal signal all play their part in this example. Thus, fasten your seat belt and read through.

The chart shows that it makes a strong bearish move and makes a breakout at long-held support. The price heads towards the South, searching for its support. The sellers are to wait for the price to have a retracement.

The price starts having retracement. It produces a bullish inside bar followed by another bullish candle. The sellers are to wait for the price to find its resistance and produce a bearish reversal candle. However, the Fibonacci traders are to wait for the price to produce a bearish reversal candle at a very particular level, which is the 61.8 level.

The chart produces a bearish engulfing candle closing well below the last bullish candle. The Fibonacci traders must draw the Fibonacci retracement levels to find out which level produces this reversal candle. If this is the level of 61.8, the Fibo sellers are going to go short in the pair.

The highest high is the level of 0.00, and the lowest low is the level of 100.0. The price has a retracement and produces a bearish engulfing candle right at Fibo level 61.8. Usually, when the level of 61.8 works as support/resistance, it drives the price towards the level of 161.8. This means the price may head towards the South and hit the level of 161.8 next. Let us proceed to the next chart and see what the price does here.

The price hits 161.8 level. It makes an upward correction on its way. However, it reaches the level at last. The last candle shows that it breaches the level of 161.8. The price may head towards the South further.

The level of 61.8 is called the Golden ratio. It is a super significant level as far as Fibonacci Retracement is concerned. The buyers in a buying market and the sellers in a selling market wait for the price to produce a reversal candle/signal candle to go long/short in a pair. Yes, there some equations for the traders to know and obey to be able to trade with Fibonacci retracement. Once they learn them well, Fibonacci trading can make them a handful.

Categories
Forex Course

98. Do You Know There Are Four Types of Pivot Points?

Introduction

In all the previous lessons of pivot points, we considered the traditional pivot points. But this is not the only type of pivot points that are existing. There are three other types to it as well. In this lesson, we shall cover the four different types of pivot points that exist.

Types of Pivot Points

The four types of pivot point are mentioned as follows:

  • Traditional Pivot point
  • Woodie Pivot point
  • Camarilla Pivot point
  • Fibonacci Pivot point

Since we’ve already discussed the traditional pivot point in detail, we shall be concentrating on the rest of the types. Note that, in all the different types of pivot points we will be studying, the only difference is the calculation of the pivot point levels. As far as the concept to trade using these pivot points is concerned, it remains the same as the traditional approach.

Woodie Pivot Point

The Formulae

Pivot point (P) = (High + Low + 2Close) / 4

First Resistance (R1) = (2 x P) – Low

Second Resistance (R2) = P + High – Low

First Support (S1) = (2 x P) – High

Second Support (S1) = P – High + Low

From the above formulas, we can notice that the way of calculations is pretty different from that of the traditional type. In the traditional, we considered the difference between High and Low to calculate support and resistance levels. But, in this case, consider the range as well as the close of the previous day. Some traders prefer this over the traditional pivots because it gives more weightage to the close price of the previous day.

Camarilla Pivot Points

The Formulae

P = (High + Close + Low) / 3

S1 = Close – ((High – Low) x 1.0833)

S2 = Close – ((High – Low) x 1.1666)

S3 = Close – ((High – Low) x 1.2500)

S4 = Close – ((High – Low) x 1.5000)

R4 = Close + ((High – Low) x 1.5000)

R3 = Close + ((High – Low) x 1.2500)

R2 = Close + ((High – Low) x 1.1666)

R1 = Close + ((High – Low) x 1.0833)

If we look closely, we can infer that the support and resistance levels are calculated using the range and the close price similar to the Woodie calculation. The only major difference being, in Camarilla, four levels of Support and Resistance is calculated and is multiplied by a multiplier.

The theory with which Camarilla was created is based on the concept that the price has a natural tendency to return to the mean (here, close of the previous day). So, the simple strategy here is to sell when the price reaches the R3 or R4 level and buy when the price bottoms to S3 or S4 level. However, if the price breaches the S4 or R4 level, it indicates a strong trend in the market.

Fibonacci Pivot Points

The Formulae

P = (High + Low + Close) / 3

S1 = P – ((High – Low) x 0.382)

S2 = P – ((High – Low) x 0.618)

S3 = P – ((High – Low) x 1.000)

R3 = P + ((High – Low) x 1.000)

R2 = P + ((High – Low) x 0.618)

R1 = P + ((High – Low) x 0.382)

For calculating Fibonacci level, the pivot point level is calculated using the traditional method. Then the Support and Resistance levels are obtained by finding the product of the previous day’s range and the corresponding Fib level. The most used Fib levels are 38.2%, 61.8%, and 100%. Finally, adding/subtracting this value with the pivot point yields the Support and Resistance levels.

All of these indicators will be available with most of the brokers and charting tool software. Consider trying all of these pivot points on a demo account and use the ones that work the best for you. This hence brings us to the end of this lesson as well as the concepts involved in the pivot points. In the next lesson, we’ll summarize this topic and move ahead with another interesting technical analysis tool. Cheers!

[wp_quiz id=”70131″]
Categories
Forex Course Guides

Forex Course 3.0 – Complete Guide

Hello everyone,

Firstly, we want to thank you guys for following us throughout the course so well. We feel privileged that we are helping you guys in becoming better traders. Especially in Course 3.0, we have discussed some of the most crucial aspects of technical trading, which are essential for every aspiring technical trader to know. We have seen the quiz results for all the course articles that you guys have taken, and that gave us a gist of how well you’ll be following the topics discussed.

However, for the people who want to revisit a few topics, we would like to make their lives easier. So we are putting up a list of topics that we have discussed in this course. Also, this article will act as a quick revision guide for all the basics involved in Technical Analysis.

In this course, we have started by discussing the concept of Candlesticks and its fundamentals. Then we learned how to trade various candlestick patterns along with their importance. Introduction to Fibonacci trading has been done, and we also have paired the Fib levels with various indicators to generate accurate trading signals. We extended that discussion to Moving Averages and its types. Finally, we have learned the principles of indicator-based trading, where at least 10 of the most popular indicators have been discussed.

Below are the corresponding links for each of the topics that we have discussed in this course.

Candlestick Charts

Concept of CandlesticksIntroduction | Anatomy | Fundamentals

Trading Candlestick PatternsSingle Continuous | Single Reversal | Dual Continuous                                                   Dual Reversal | Triple Continuous | Triple Reversal

Deeper InsightCandlestick Patterns Cheat Sheet | Candlestick + S&R

Fibonacci Trading

Introduction | Entry Using Fib Levels | Challenges of using Fib levels | Fib + S&R Candlestick Patterns + Fib Levels | Fib + Trendlines | Fib for TP & Fib for SL | Summary

Moving Averages

Introduction | SMA | EMA | SMA vs. EMA | MAs to identify the trend | MA Crossover Strategy | MA + S&R | Summary 

Indicator-Based Trading

Introduction | Pros & Cons | Bollinger Bands | RSI | MACD | Donchain Channel | RVI | TSI | Stochastic | Ichimoku Cloud | Parabolic SAR | ADX | ATR 

With this, we have ended our Course 3.0, and soon we will be starting our Course 4.0, where we will be discussing some of the advanced topics in Technical Trading. So stay tuned and watch this space for more interesting and informative content. Cheers!

Categories
Forex Basic Strategies

Trading The Bullish & Bearish Bat Pattern Like A Pro

Introduction

We have learned the importance of Harmonic patterns in our previous articles. We also understood a couple of interesting harmonic patterns – The Butterfly & AB=CD. In this article, let’s understand what a ‘Bat’ pattern is, and how to make money trading this pattern. The Bat pattern is a part of the Harmonic group, and ‘Scott Carney’ discovered this pattern in the year 2001. Out of all the patterns present in the harmonic group, Bat pattern has the highest accuracy. This pattern can be extremely profitable when traded correctly.

It works very well on all the timeframes but try not to trade it in smaller timeframes because the price in these timeframes tends to reverse quickly. The Bat pattern comes in both bullish and bearish variations and is made up of five swing points X, A, B, C, and D. In a downtrend, the appearance of a bullish Bat pattern indicates a bullish reversal. In an uptrend, the appearance of a bearish Bat pattern indicates a bearish reversal.

One of the critical characteristics of the Bat pattern is the power, speed, and strength of the reversal that occurs after the appearance of this pattern on the price chart. Fibonacci ratios are the core strength of any harmonic pattern, and thanks to the advanced technology for providing the Fibs ratios to the Bat pattern to increase its accuracy.

Bat Pattern Rules

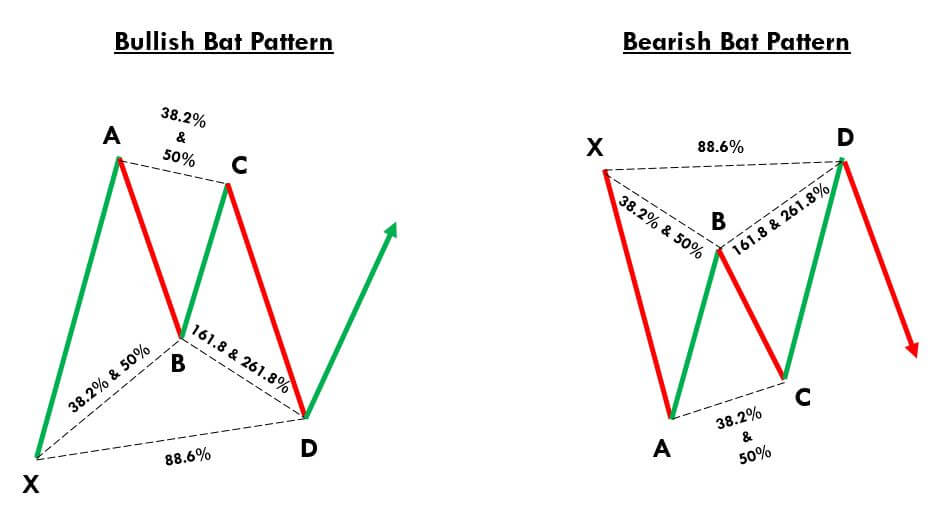
Just like most of the harmonic patterns, the Bat pattern is a four-leg reversal pattern that follows specific Fib ratios. A proper Bat pattern needs to fulfill the below criteria.

‘X-A’ – In its bullish form, the first XA move of the Bat pattern could be any random upward move on the price chart.

‘A-B’ – For a Bat pattern to get validated, the AB leg’s minimum retracement should be 38.2% of XA leg or maximum of 50% Fib levels. Scott Carney suggests that the retracement at 50% Fibs levels increase the accuracy of the signal generated.

‘B-C’ – The BC move can retrace up to a minimum of 38.2% Fib level of AB and a maximum of 88.6%.

‘C-D’ – CD is the last move that confirms the Bat pattern. This move should be at 88.6% Fibs retracement of XA leg, or it should be between 161.8% or 261.8% Fibs extension of the AB leg.

For a bearish Bat pattern, point X should be at a significant high. Conversely, for a bullish Bat pattern, point X should be at a significant low.

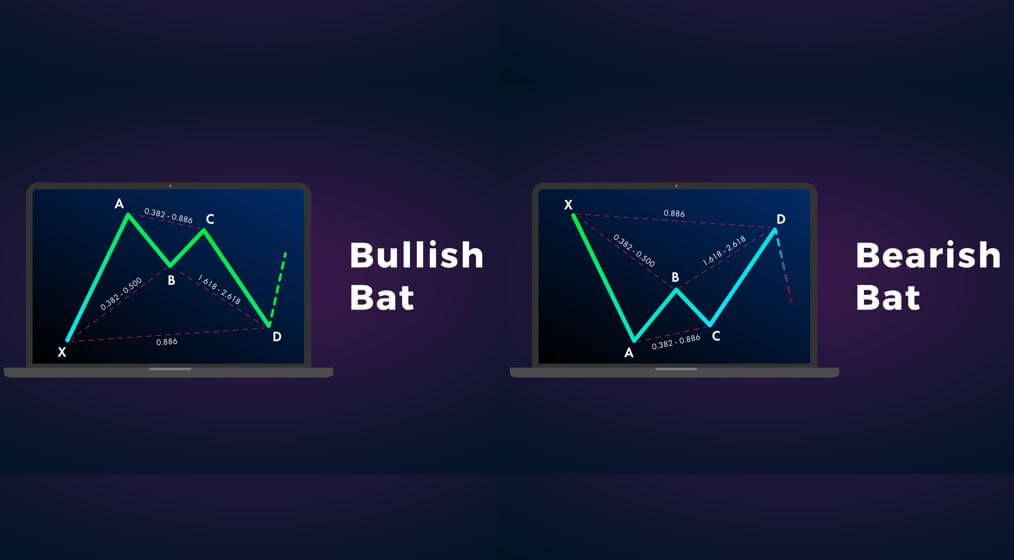
Below is the pictographic representation of the Bat Harmonic Chart Pattern.

Bat Pattern Trading Strategy

Trading The Bullish Bat Pattern

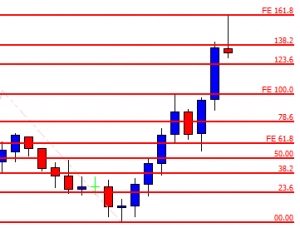
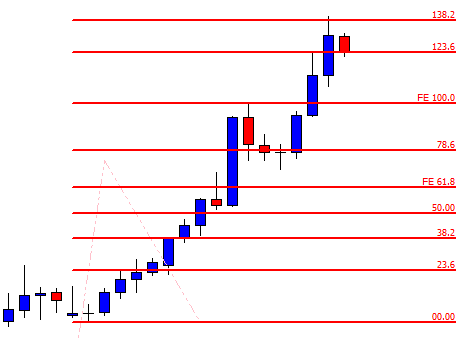
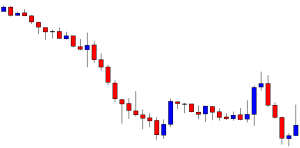
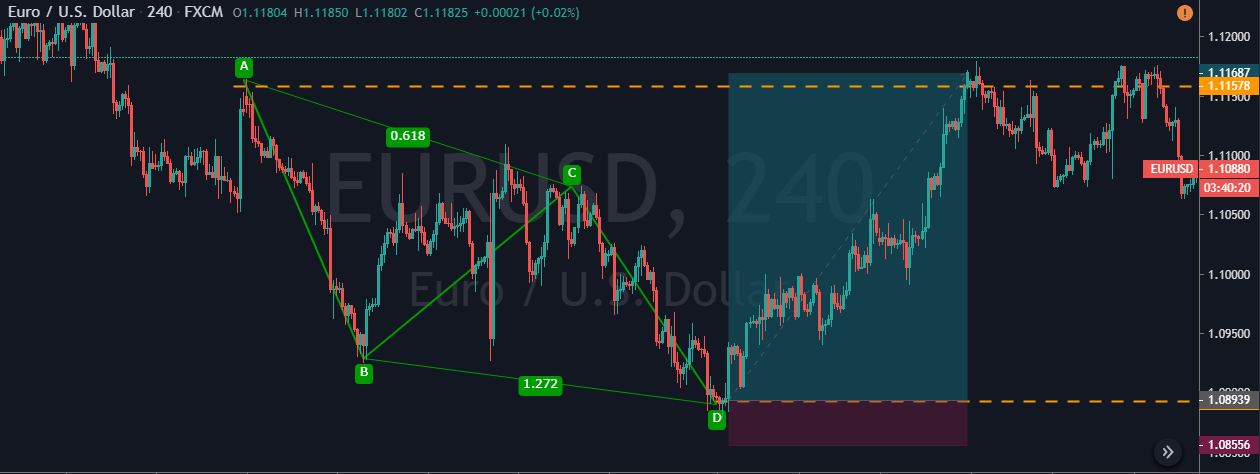
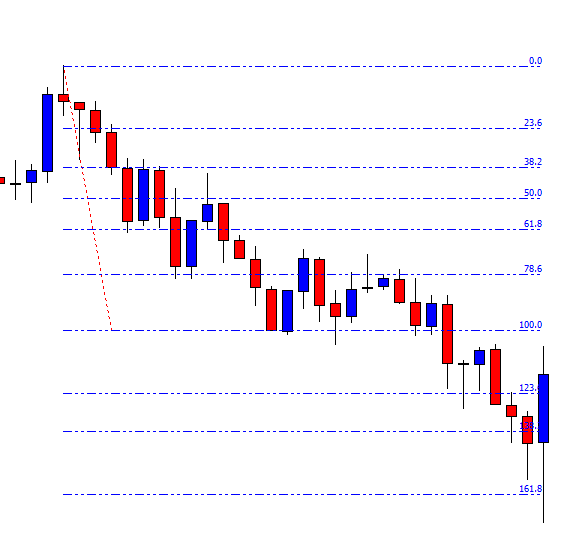
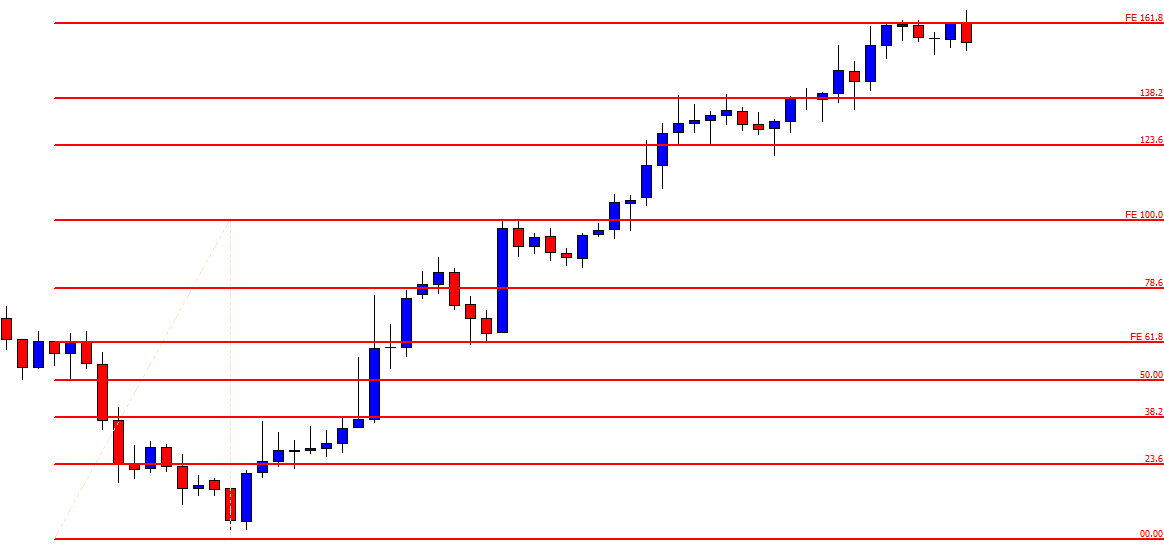
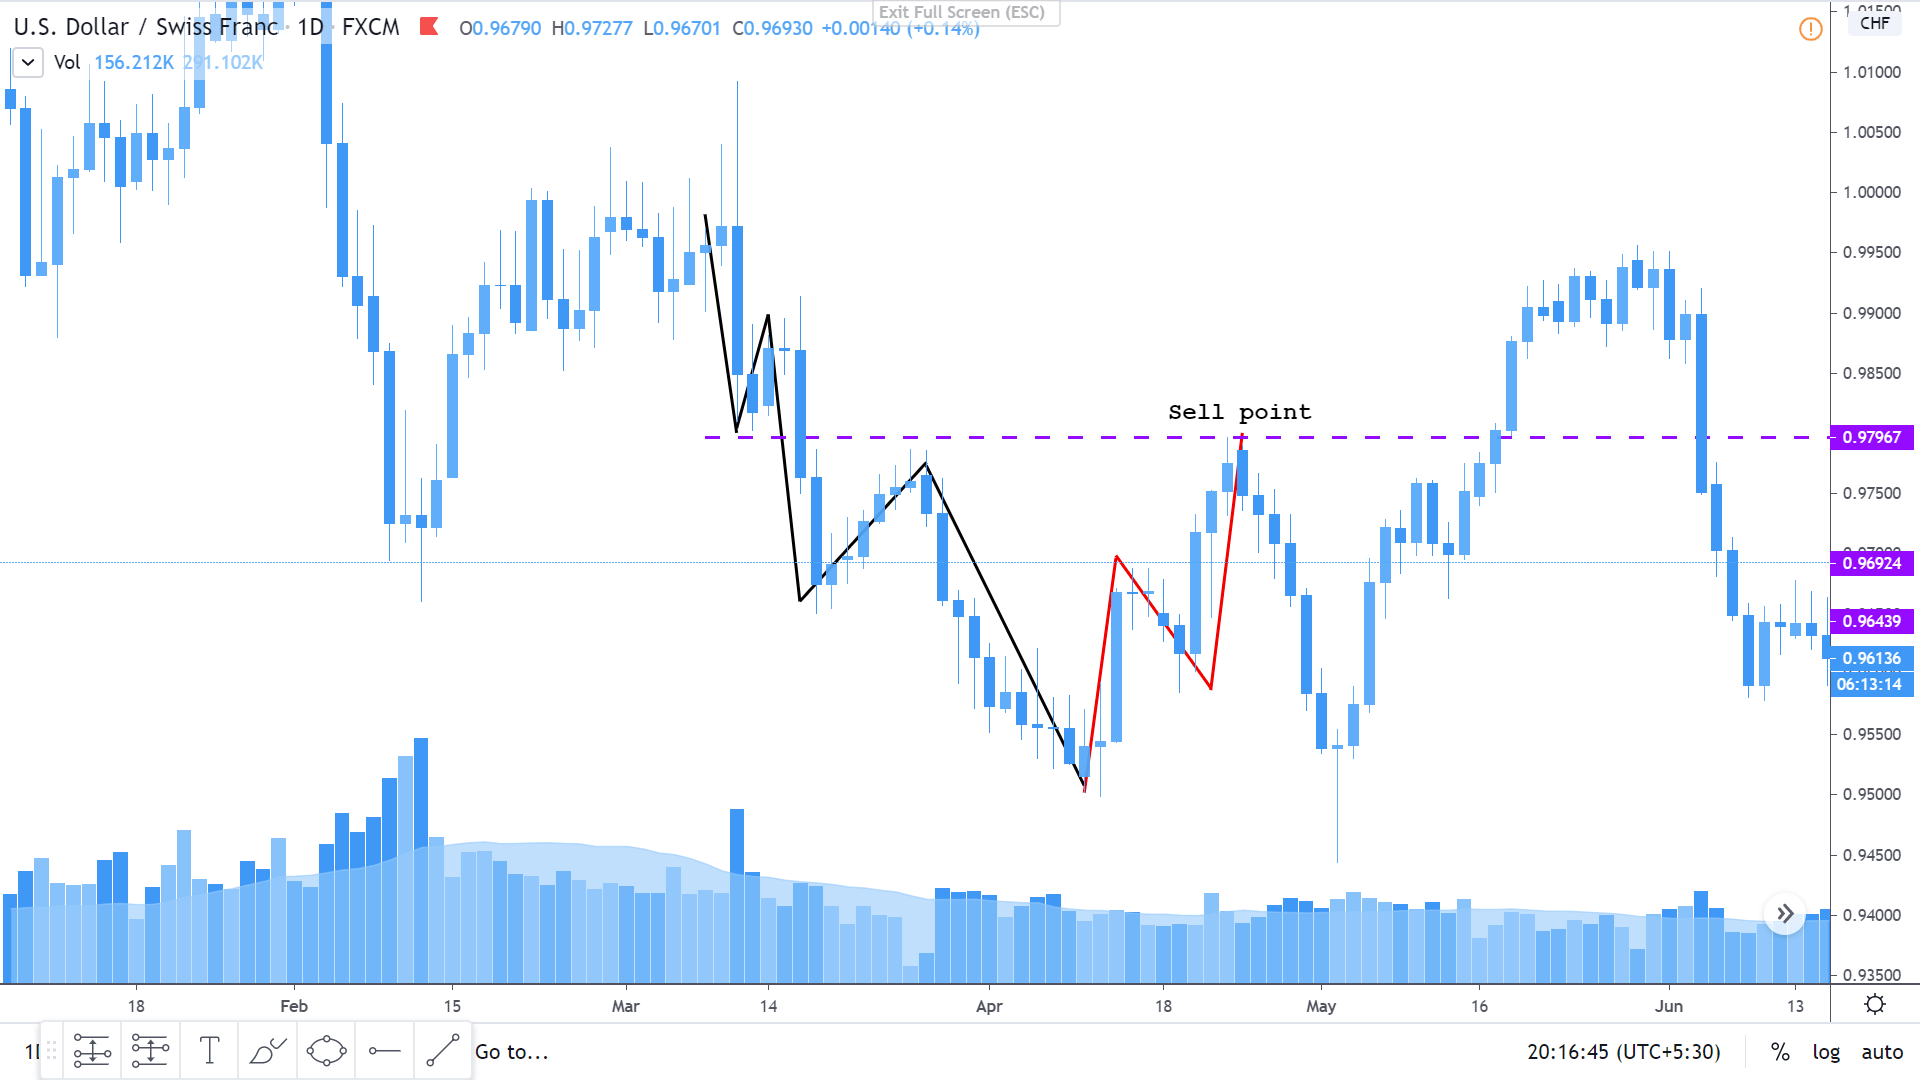
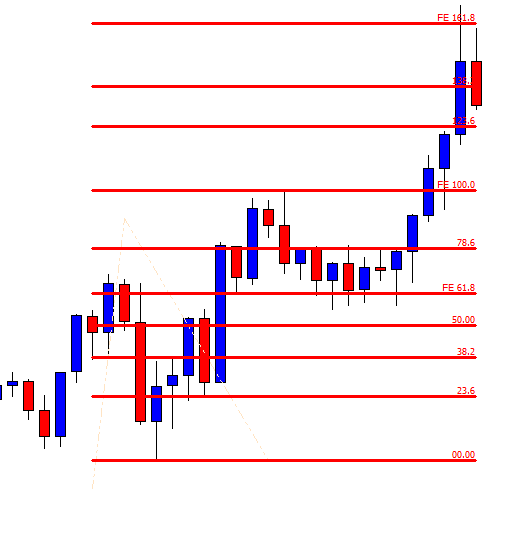
In the below USD/CHF four hours chart, we can see the formation of a bullish Bat pattern. These days, on most of the trading platforms, we can find all the harmonic tools which are combined with Fib levels. These tools get extremely handy when we need to quickly confirm the pattern. We use TradingView charts, and the harmonic pattern tool can be found in the left-side toolbar.

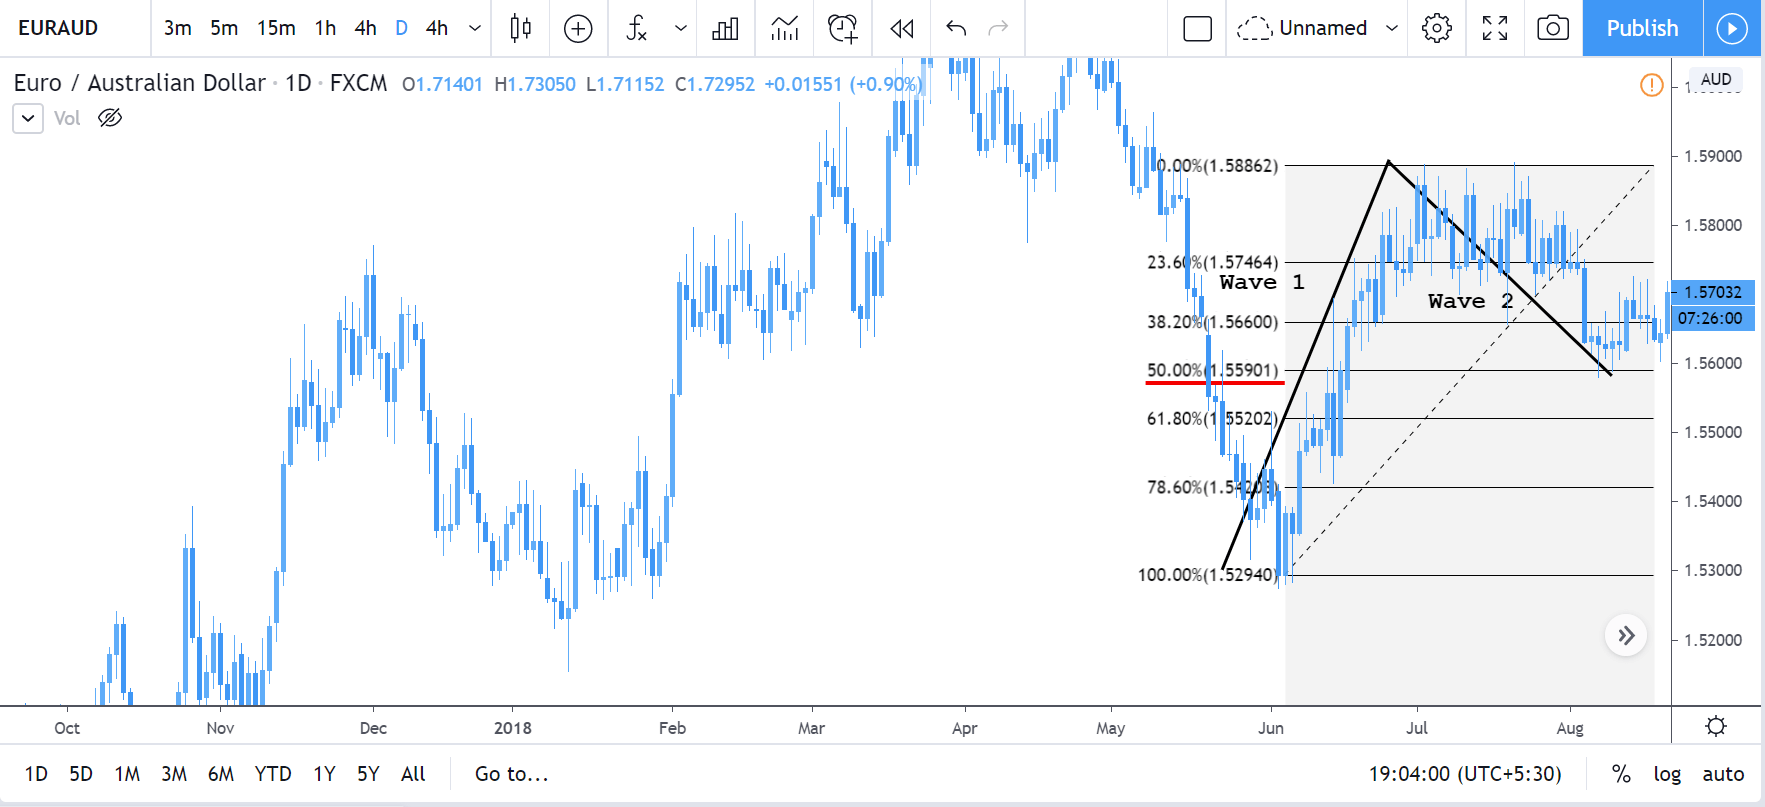
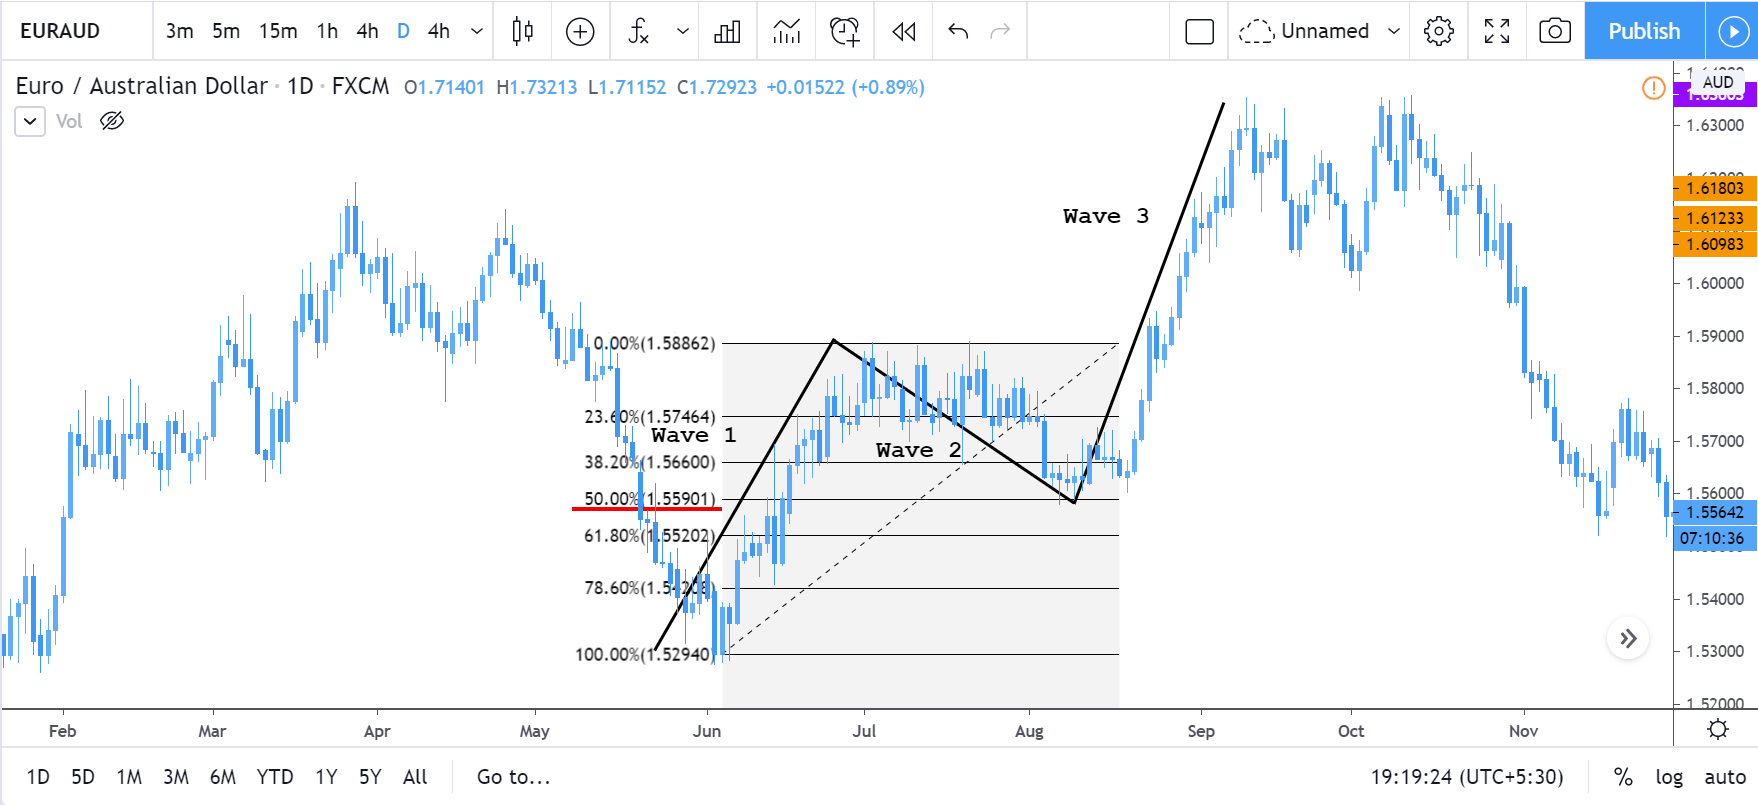
Coming to the strategy, our starting point X was at 0.9840 from where the move has started. The price action started to counter the trend from 0.9984. Let’s consider this as our point A, and the XA is nothing but a random bullish move in the market. Now we located our first swing high, so the next step is to count the market wave movement. The AB move retraces at 38.2% of the XA move, and the BC move goes up again and retraces at 88.6% of AB. Furthermore, the market prints the last move of the pattern, which is at 88.6% level of the XA move. So now we have got all the four touch patterns for a bullish Bat pattern on the price chart.

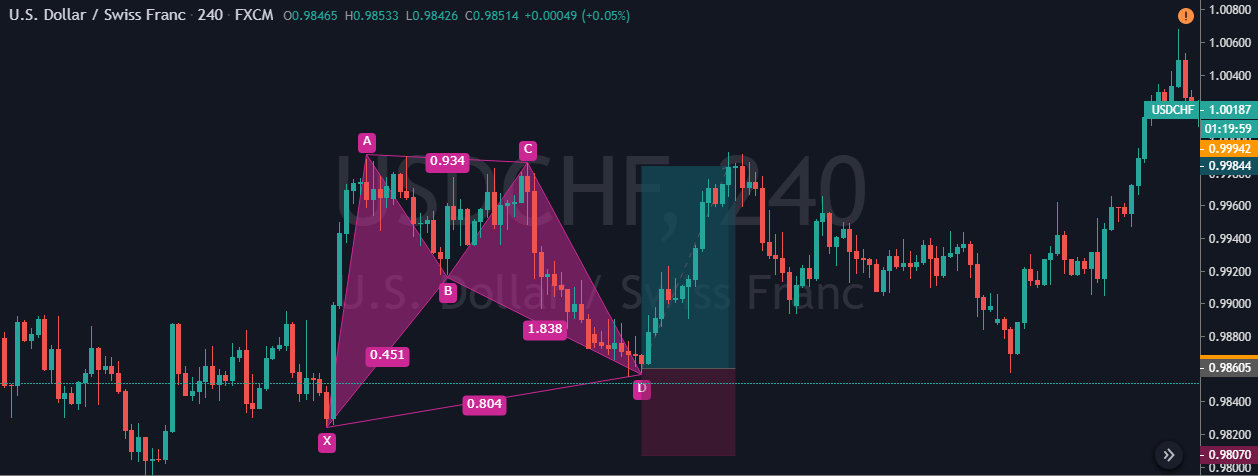
While back-testing, we found the market blasting to the north whenever the CD move finishes at 88.6% level. This is the reason why we took the buy entry as soon as the price-action completes the CD move. Overall it was an excellent risk-reward ratio trade. Also, when the CD move touches the 88.6% Fib level, it always provides a decent risk-reward ratio. The stop-loss is placed below the ‘X,’ and take-profit can either be placed at A or C points.

Trading The Bearish Bat Pattern

Both the bearish and bullish Bat patterns have the same rules. The only difference is that it appears inversely. So in this strategy, let’s trade the bearish Bat pattern with at most accuracy.

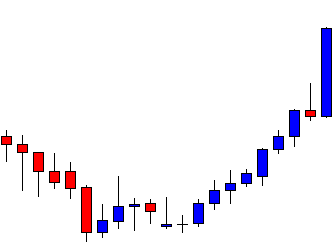
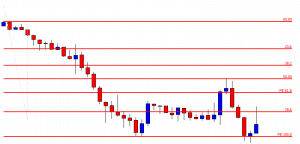
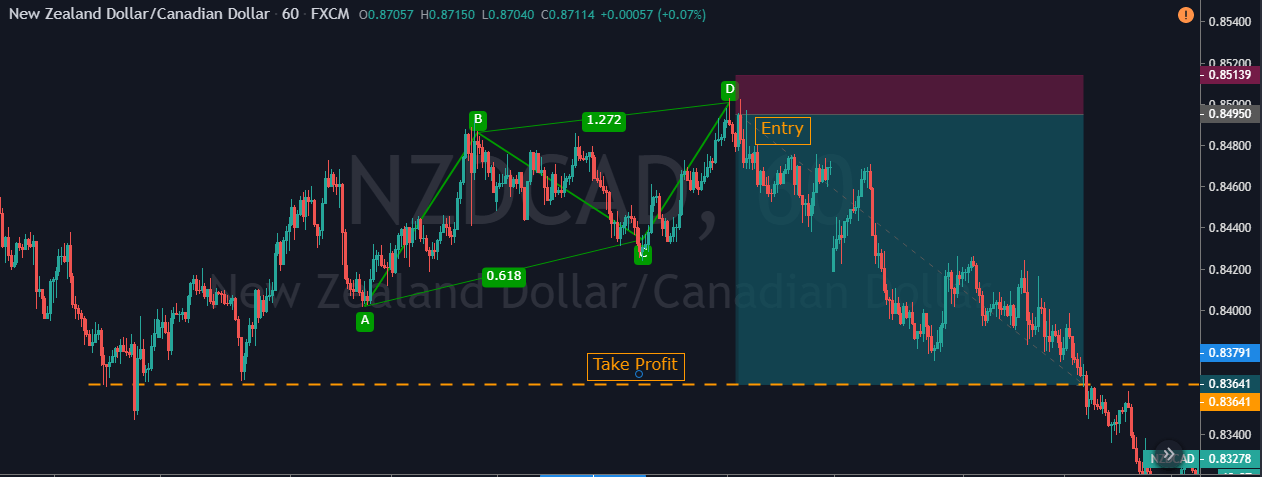
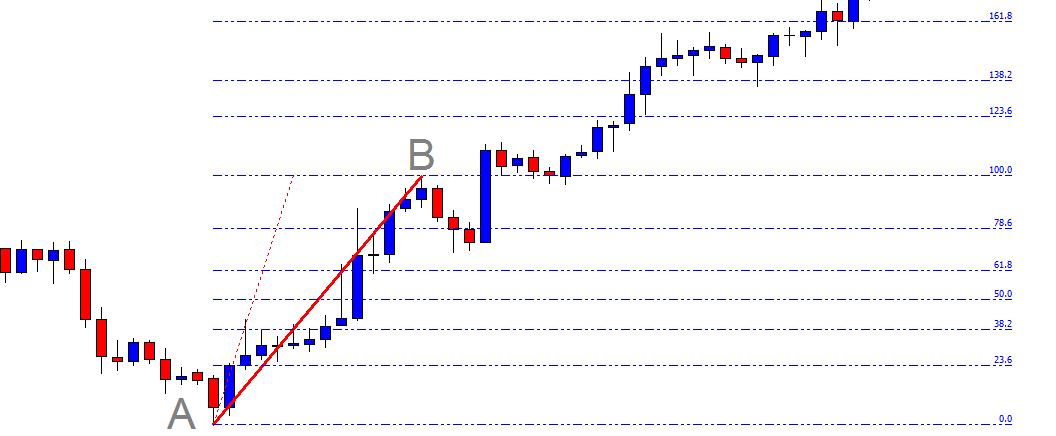
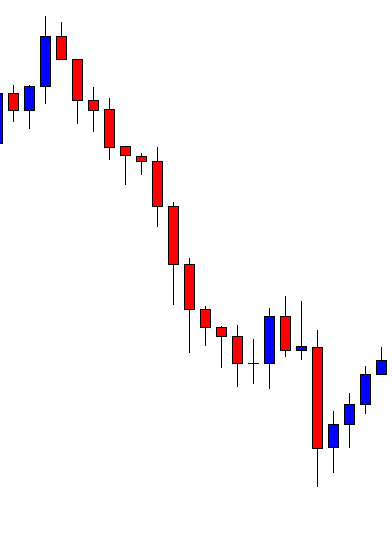
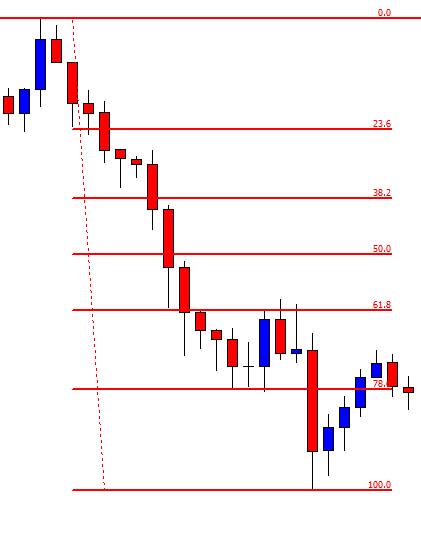
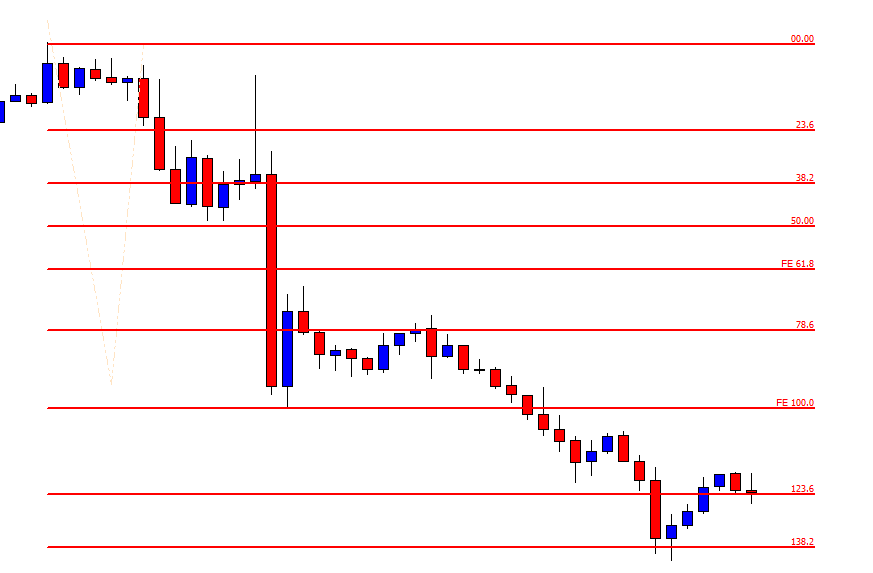
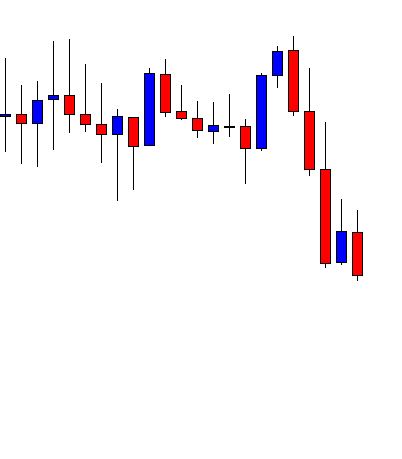
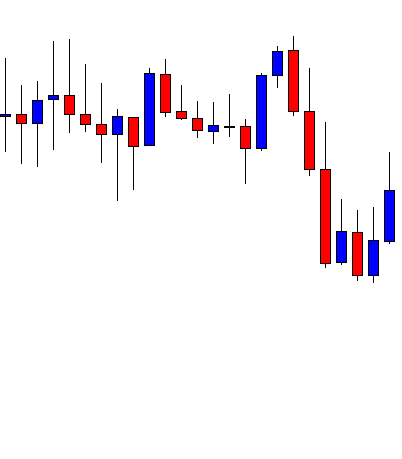
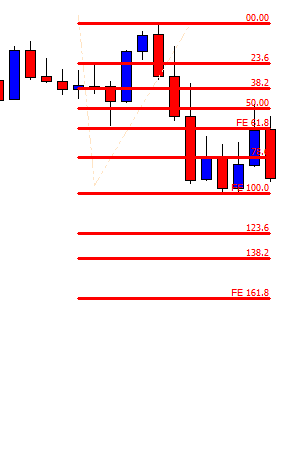
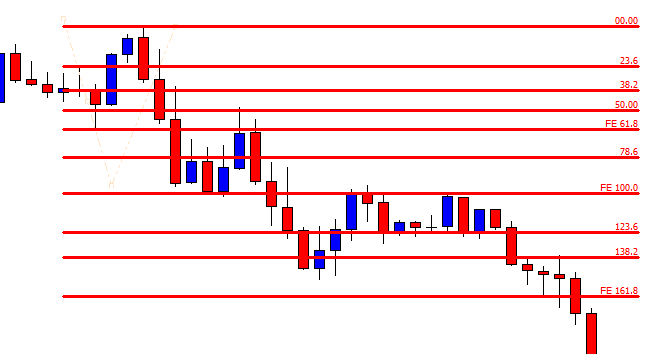
In the below NZD/USD daily chart, we have identified a bearish Bat pattern. The very first move has started from point X and ends at point A. This can be considered as a random bearish move. The price action has then reversed back and retraced at 38.2% level of the XA move forming the AB move. The market then goes into the counter direction and forms a BC leg, which is also retraced at 38.2% Fib level of the AB leg. The last leg was the CD move, and it finished close to the 88.6% Fibs level.

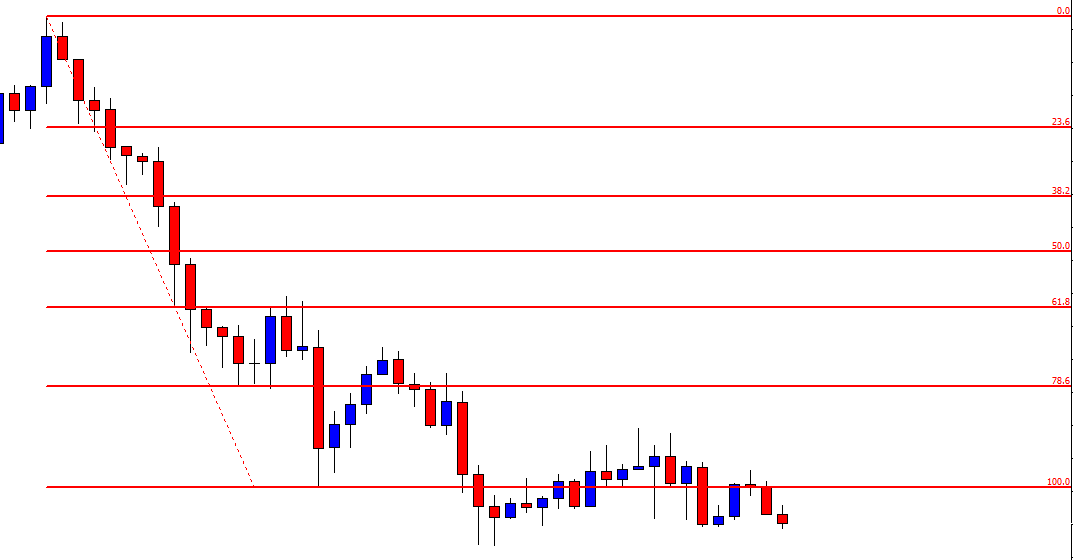
These swing highs and lows confirm the formation of a bearish Bat pattern on the price chart. So when the price action prints a bearish confirmation candle, we went short in this pair. Scott Carney described the points B, C and A as the first, second, and third target respectively. We can book profit at any of these points, or we can hold for deeper targets depending on the market situation.

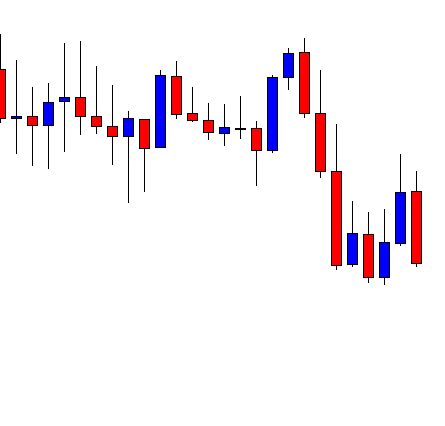
In this particular trade, we didn’t book profits at B or C after seeing the momentum of the price. We were sure that the price could easily reach the last target. The price action did hold at point C for a longer time, which indicates that this trade might not work. Any armature trader would have panicked and closed their trades at breakeven.

But, as mentioned, whenever an ‘almost perfect’ Bat pattern is formed, the trade will definitely work. We must be patient and confident enough to stick to the strategy. Stop-loss placement is crucial, and one thumb rule while trading harmonic patterns is to place the stop-loss just below point X.

Conclusion

In short, harmonic patterns imply that the trends can be subdivided into smaller or larger waves using which the future price direction can be predicted. These harmonic patterns only work if the fibs ratios are aligned with the pattern. Some traders do not believe the authenticity of harmonic patterns, but we assure you that you can trade these patterns confidently. This ends the discussion on the Bat pattern. Remember that this pattern provides accurate entries as well as good RRR trades compared to other harmonic patterns. In the upcoming articles, let’s discuss Gartley and Crab patterns, which are equally important to learn.

We hope you find this article informative. In case of any questions, please let us know in the comments below. Cheers!