Introduction
H.M Gartley published a book known as ‘Profits in the Stock Market’ in 1932. In this book, Gartley shared the entire group of harmonic patterns that are widely being used by traders across the world. AB=CD is one such pattern from the harmonic group. As time has passed, professional traders and market technicians improved this pattern a lot. They have also incorporated the Fibonacci ratios to this pattern, which will be discussed in this article.
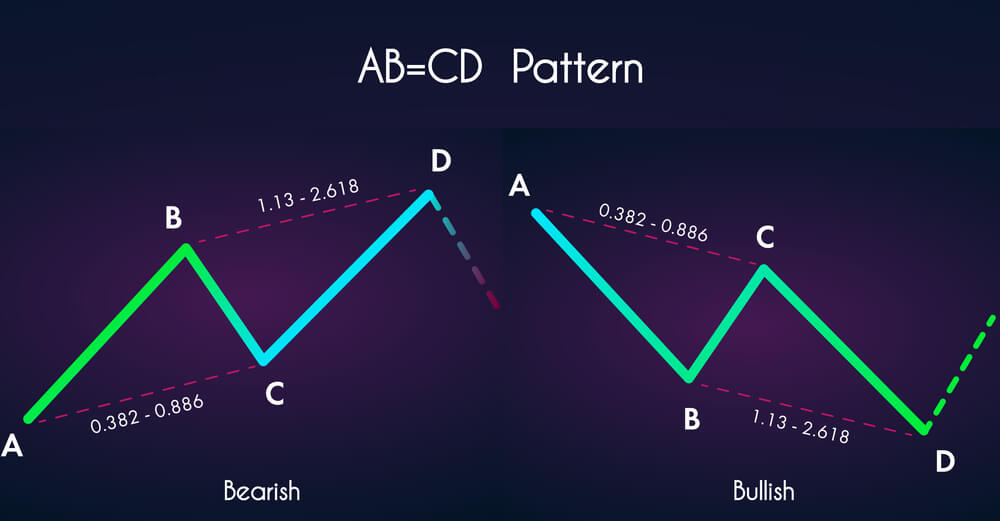
AB=CD is a reversal pattern that helps traders in predicting when the price action of an underlying asset is about to reverse. It is a visual geometric pattern comprised of three consecutive price swings. This pattern helps to identify the trading opportunities in all types of markets, on any timeframe, and in any kind of market condition. Bullish AB=CD pattern helps traders in identifying higher probability buy trades, whereas bearish AB=CD patterns help in determining selling opportunities.
This pattern includes a total of four letters – A, B, C, D. Each turning point represents a significant high or low on the chart. These turning points are referred to as AB move, BC move, and the CD move. Let’s see how traders must perceive this pattern in the upcoming sections.
AB=CD Pattern Rules
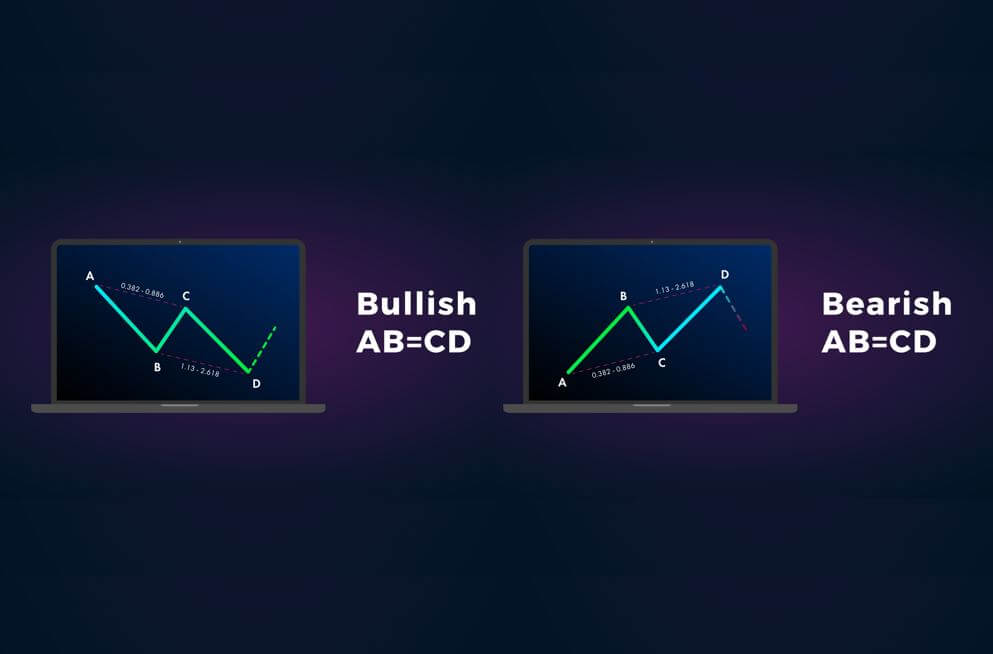
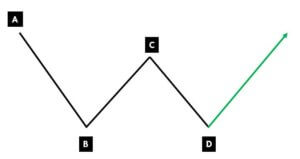
Bullish AB=CD Pattern
- The bullish AB=CD pattern always appears in a downtrend.
- First of all, point A to B will be any random downtrend move.
- Then the price action must go into the counter side of the AB move, printing the B to C move.
- The original selling trend should resume and print the CD leg resembling the AB leg.
- Once all these three moves are completed, we can conclude that the market has printed the bullish AB=CD pattern
- Activate the buy trades only at point D.
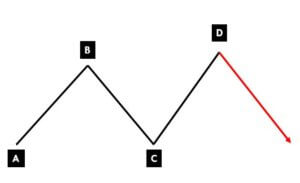
Bearish AB=CD Pattern
- Bearish AB=CD pattern is nothing but a mirror image of the Bullish AB=CD pattern.
- The pattern begins with a bullish line from point A to B.
- These points could be any random move in an uptrend.
- B to C move should reverse the trend of the market but shouldn’t cross point A.
- C to D move should be equal in size to point A and B.
- Once all these moves are completed, we can conclude that the market has printed the bearish AB=CD pattern
- Start taking sell trades only from point D.
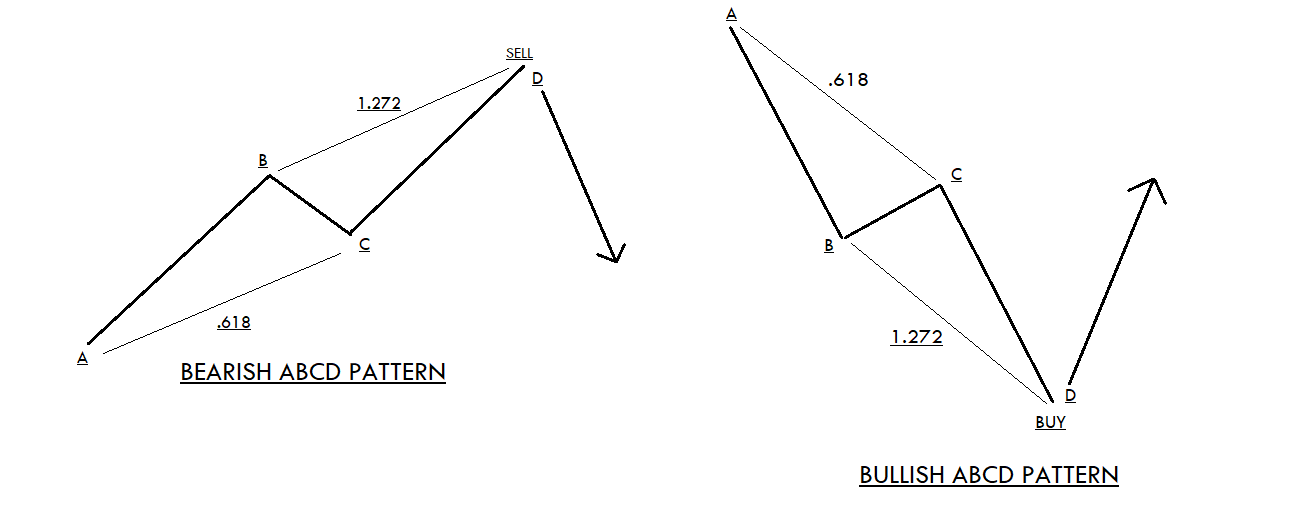
AB=CD Pattern – Fibonacci Ratios
As already mentioned, Fibonacci ratios can be used to confirm the validity of the AB=CD patter. Below are the fib levels that are incorporated in the AB=CD pattern by trading experts for pattern validation.
BC leg is the 61.8% Fib retracement of AB leg.

CD leg is the 127.2% Fib retracement of BC leg.
Only at these retracement levels, the length of AB will be equal to the length of the CD.
Only take the trades if these above Fibonacci levels are matching with the setup on your charts. Ignore the setup if the Fib levels aren’t matching.
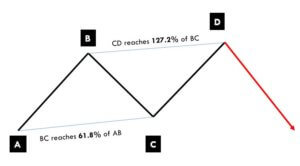
As you can see in the above image, the BC move retraces 61.8 of the AB and CD move is the 127.2% extension of the BC move. Also, the length of the AB move is equal to the extent of CD, i.e., both the movements must take the same time to develop on the charts. If any underlying currency pair is confirming all the mentioned rules, only then we can safely anticipate a higher probability trade.
AB= CD Pattern Trading Strategy
We believe by now, you understood the formation of the AB=CD pattern very well. Now let’s combine this pattern with the Fibs ratio as discussed to learn how to trade this pattern in the right way. As soon as we identify this pattern on the price chart, the only problem most of the traders have is while determining the accurate Fib ratios. Novice or intermediate traders go wrong most of the time in this aspect. As a result, they lose their trade. So make sure always to set the accurate fibs ratio and only then trade the AB=CD setup.
Bullish AB=CD Pattern
In the below EUR/USD 240 minutes chart, we can see that the pair was in an overall downtrend. We can also see that the CD move is equal in size to AB move. Also, after applying Fib ratios, we now know that the BC is 61.8% retracement of the AB move, and CD is the 127% extension of the BC. Therefore we can confirm the validity of the Bullish AB=CD pattern.
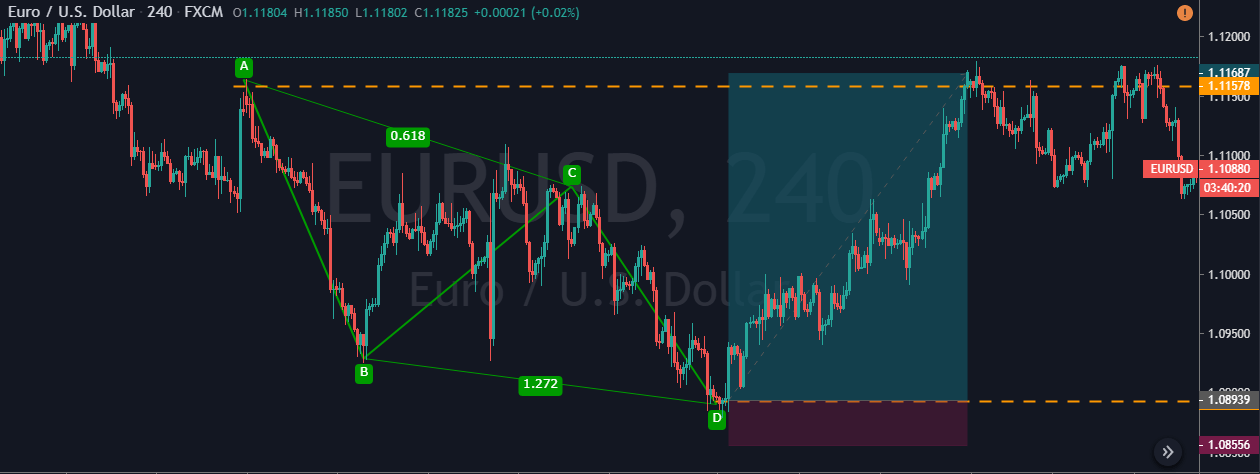
Entry, Stop-loss & Take Profit
Execute a buying trade at point D. Furthermore, always place the stops just below the D point. This is because, if price action goes beyond this point, it invalidates the pattern. This pattern provides two ‘take profit’ targets. The first one is point C, and the other is point A. We have closed our full position at point A because after activating our trade, the price action immediately blasted to the north. This indicates that we can expect more extended targets in this pair.
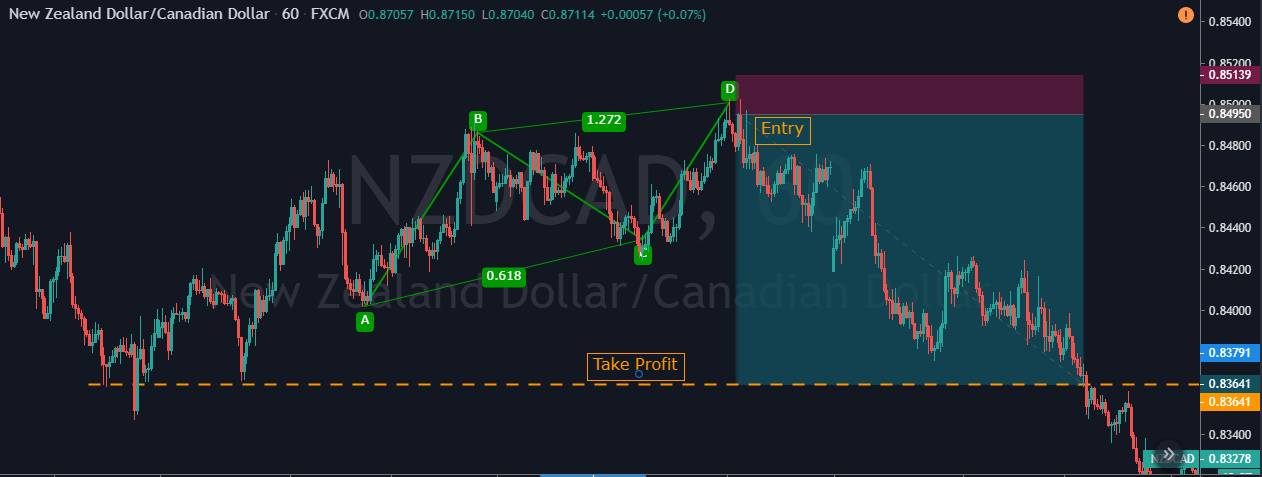
Bearish AB=CD Pattern
In the below 60 minute chart of the NZD/CAD Forex pair, the market was in an uptrend. This means that if at all, we are expecting an AB=CD pattern, it will be bearish. Notice that the AB is completely equal in size to the CD move. Following the rules of the pattern is critical while trading the AB=CD pattern. After applying Fibs, we can see that the BC is 61.8% retracement of the AB move, and the CD move was also a 127% extension of the BC move on the price chart. This confirms the authenticity of the bearish AB=CD pattern. We have executed a sell trade at point D. Although it was not a smooth ride, we have closed our full position at the major support area.
Bottom Line
AB=CD is one of the most popular trading patterns in the market. It is straightforward to identify, confirm, and trade as well. Also, we get to see this pattern frequently in the market, and traders can pair it with other forms of technical analysis to improve the odds of their trades. Always remember to follow the rules of the game; else, it is very difficult to win the game of trading. We hope you find this strategy useful. Try applying this strategy on a demo account and then apply it on the live charts. If you have enough questions, let us know in the comments below. Cheers!