Introduction
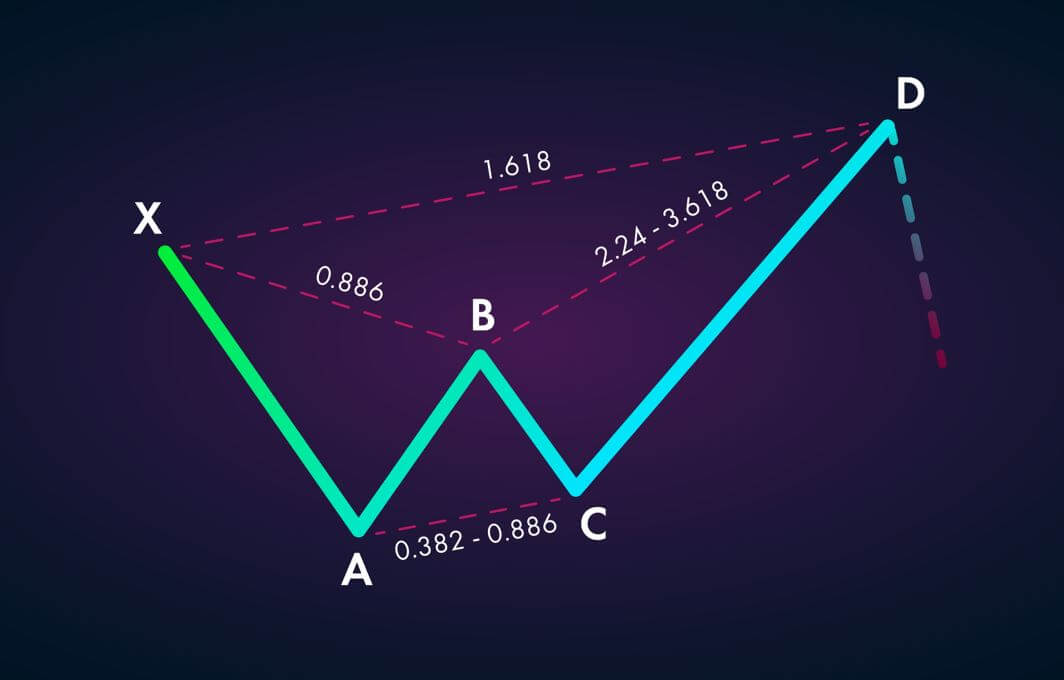
Crab is the last pattern that we are going to discuss in the harmonic group. Just like other patterns, the Carb is also identified and traded using the Fibonacci levels in order to determine the precise turning points. The Crab is a reversal pattern and is composed of four legs – XA, AB, BC, and C-D. Let’s understand them in detail below.

The Four Legs Of Crab Pattern
XA – In its bullish version, the first leg forms when the price action rises sharply from the point X to point A.
AB – The AB move goes against the actual market direction and retraces between 38.2% to 61.8% of the distance covered by the XA leg.
BC – In the BC leg, the price action resumes its original direction and retraces between 38.2% to 88.6% of the distance covered by the AB leg.
CD – The CD is the final leg that confirms the formation of the Crab pattern. Place the sell order when the CD leg reaches the 161.8% Fibs extension of the AB leg.
Trading The Crab Pattern
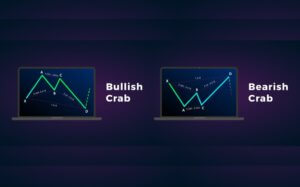
Bullish Crab Pattern
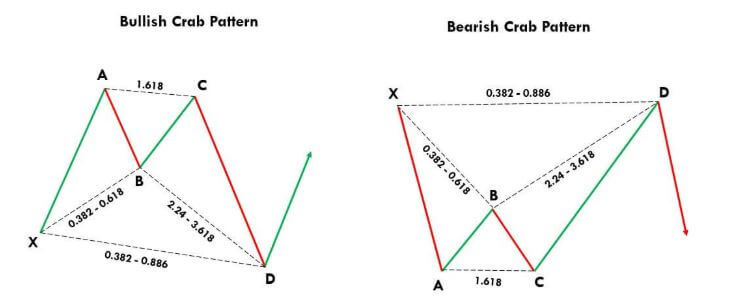
In the below GBP/USD Forex pair, we have identified the formation of the Crab pattern. The first movement XA can be considered any random bullish move. The second leg AB was a counter-trend, and it reached the 61.8% Fib leg of the XA leg. For the third move, price action goes up, and it retraces 38.2% of the XA leg. The last leg was the CD move, which 161.8% of the AB leg. The fourth leg confirms the pattern formation on the price chart.

We activated our trade at point D with stops below point D and taking profit at point A.
Bearish Crab Pattern
The price chart below represents the formation of a bearish crab pattern on the price chart. The first leg XA was the random move, and second leg AB goes up, and it retraces at 38.2% of the XA leg. The next third leg was the BC move, and it retraces 88.6% of the AB move. The last leg CD was the decision-making move, and it closes at 161.8% of the AB leg.

The trade activation was at point D, and the stop was a bit above the trade, and to book profits, we opted out for the most recent lower low.
Conclusion
The Crab pattern rarely appears on the price chart, but when it does, it provides excellent risk to reward ratio trades. If you are new to harmonic trading, practice trading this pattern on a demo account first and only then trade on the live account. Always remember to trade the Bearish Crab pattern in an uptrend, and Bullish Crab patterns in a downtrend only. Cheers!