Introduction
Silver is a precious metal standing after Gold. It is a vital asset to understand and forecast the potential movements in the commodity market. This is because buyers and sellers trade the silver market based on global macro trends. Moreover, Silver highly correlates with the Gold Spot prices. XAG/USD is the ticker for Silver against the US Dollar. XAG can be traded against other fiat currencies as well.
Understanding XAG/USD
Silver is a commodity that is traded in troy ounces (Oz), just like any other precious metal. The market price of XAG/USD represents the value of the US Dollar for 1 ounce (Oz) of Silver. It is quoted as 1 XAG per X USD. For example, if the market price of XAG/USD is 17.432, it signifies that each ounce of Gold is worth $17.432.
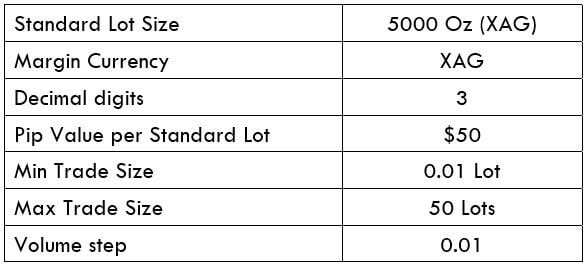
XAG/USD Specification
Spread
Spread is essentially the difference between the buying price and the selling price. The spread varies on the based account-model used.
ECN: 15 | STP: 21
Fee
A fee is basically the commission on the trade. It applies only to ECN accounts, not STP accounts.
Slippage
The arithmetic difference between the price asked by the trader and the price given by the Broker is referred to as slippage. It occurs due to two reasons: High market volatility & Broker’s execution speed
Trading Range in XAG/USD
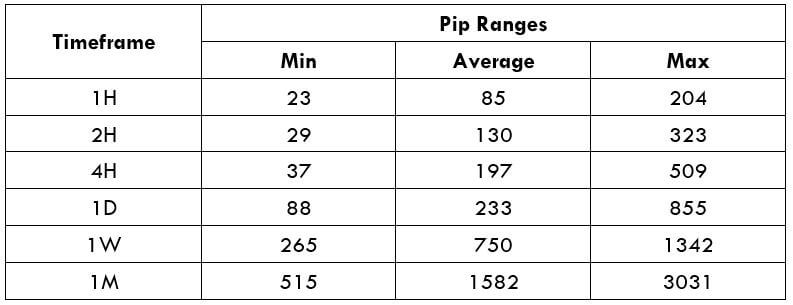
The minimum, average, and maximum pip movement in different time frames is represented in the following table. It can be used to assess your risk on the trade.
Procedure to assess Pip Ranges
- Add the ATR indicator to your chart
- Set the period to 1
- Add a 200-period SMA to this indicator
- Shrink the chart so you can assess a large time period
- Select your desired timeframe
- Measure the floor level and set this value as the min
- Measure the level of the 200-period SMA and set this as the average
- Measure the peak levels and set this as Max.
XAG/USD Cost as a Percent of the Trading Range
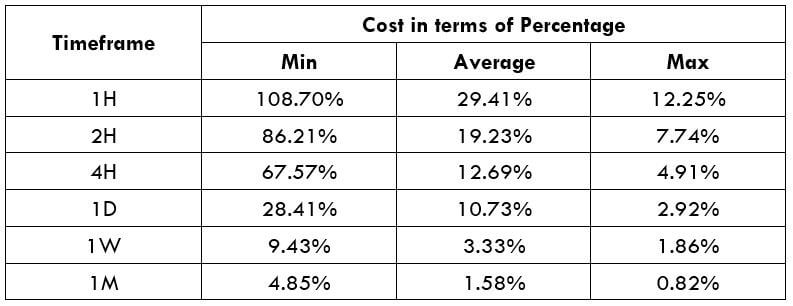
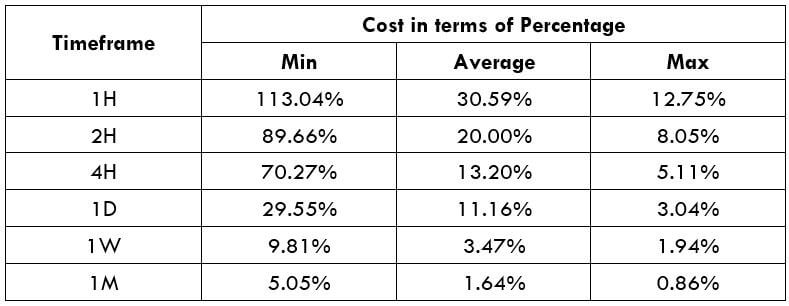
Cost a percent of the trading range is the representation of the variation in fees on the trade-in different time frames for varying volatility.
ECN Model Account
Spread = 15 | Slippage = 5 | Trading fee = 5
Total fee = Spread + Slippage + Trading fee
Total fee = 15 + 5 + 5 = 25 (pips)
STP Model Account
Spread = 21 | Slippage = 5 | Trading fee = 0
Total fee = Spread + Slippage + Trading fee
Total fee = 21 + 5 + 0 = 26 (pips)
Trading the XAG/USD
Silver Spot is extensively traded in the commodity market, after Gold Spot. It offers enough volatility and liquidity for traders to participate in the market. Silver highly correlates to Gold. Traders can use it as a proxy to place their bets on Silver prices. The technical analysis can be used on Silver as applied to any other market. Even though there is enough volatility in this pair, it is not ideal for entering any time into the market. The reason for it can be accounted for through the cost percentage table.
The cost percentage table represents how expensive a trade is going to be based on the time frame and volatility. Note that, the absolute total cost will remain the same irrespective of the two factors but will vary relatively. For instance, a 1H trader must pay the same fee a 4H trader pays for their trade. But, there a catch; the 4H trader generates more P/L than a 1H trader.
Thus, to have a balance between the P/L and fee on the trade, one must trade when the market volatility at or above the average values. Trading in low volatility markets will cause hurdles in the market to reach your target. Hence, we will have to pay the same costs, even for a small P/L.

