Categories
Forex Assets

Why Are Digitized Gold and Silver Perfect for Diversification?

Today, people have more and more investment options, from classics like gold and silver to recent innovations like Bitcoin and other cryptocurrencies. But there is one type of asset that has stood the test of time: precious metals. Here’s why what may seem like an old-school outdated product is still very interesting from the point of view of a young digital native investor.

A Brief History of Gold and Silver

The civilization of the Incas referred to silver and gold as “sun sweat” and “moon tears”. In ancient Greek mythology, gold represented the glory of the immortals. And even historical figures like Sir Isaac Newton believed in the long-discredited pseudo-science of “alchemy,” which aimed to turn basic metals into gold. The history of gold as money dates back to around 550 B.C. and government-issued fiat coins, such as the US dollar, used to be directly linked to gold in a monetary system known as the gold standard. And let’s not forget the statues of the Academy Awards, the World Cup trophy, or the medals for first place in the Olympics. All bright, beautiful, solid gold.

In January 2019 the purchase of gold by central banks reached its peak of the last 50 years, mainly because countries like Russia are changing their reserves from US dollar to gold. At the present time, the world consumption of newly produced gold is around 50% in jewelry, 40% in investments, and 10% in the industry. With 440 tons per year, China is the world’s largest gold-producing country. In January 2019 the purchase of gold by central banks reached its peak of the last 50 years, mainly because countries like Russia are changing their reserves from US dollar to gold.

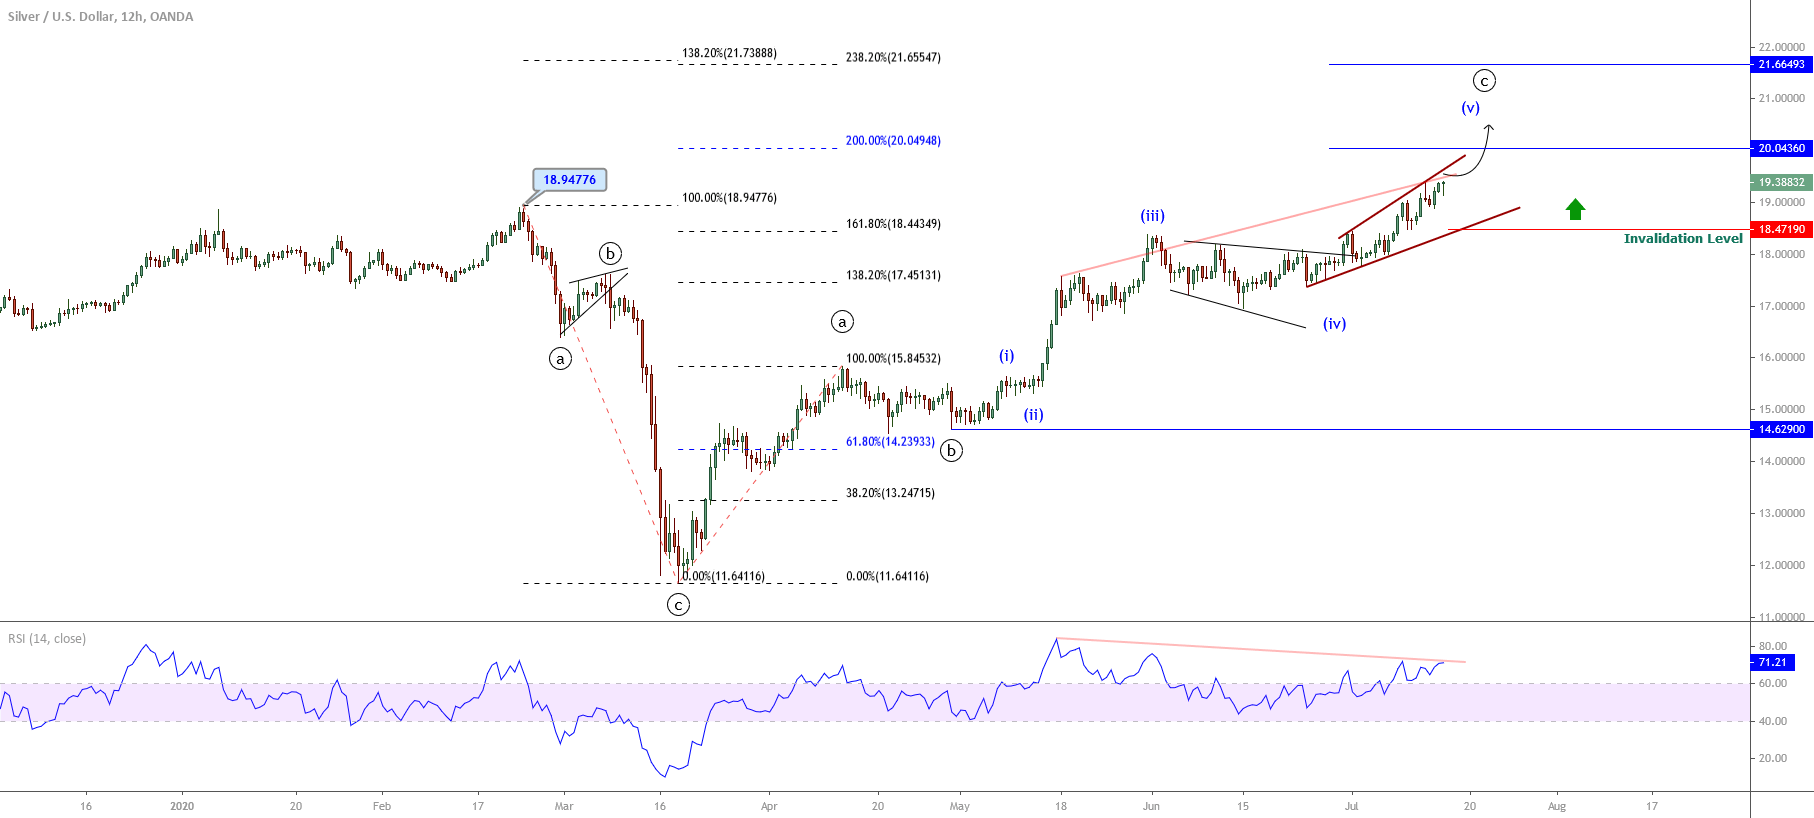
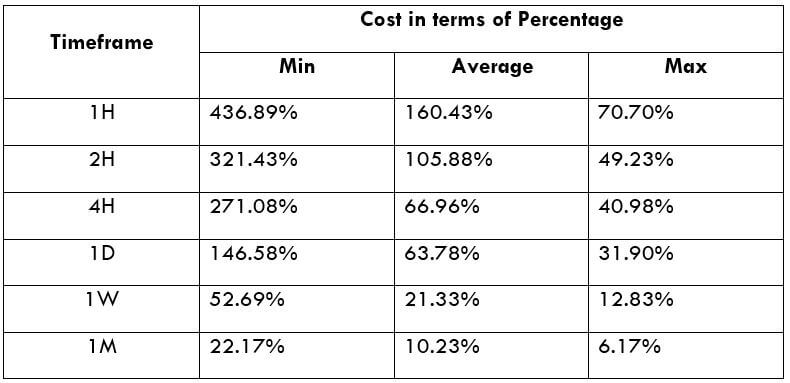
Silver, on the other hand, remains the second most popular precious metal just behind gold. It is also used for jewelry, as an investment asset, and as an industrial resource. Many investors appreciate silver as an investment, as it tends to be more volatile than gold due to its lower trading volume.

Inflation-Proof Investment and Portfolio Diversification

Analysts have long argued that gold acts as a hedge against inflation and protects investors against market volatility and unpredictability. A general rule is to have 5-10% gold exposure in the portfolio.

For younger investors with higher risk tolerance and higher return expectations, gold might look like a conservative investment. But it can complement and enhance an investor’s overall portfolio by balancing technology-oriented assets with a time-tested commodity.

Gold is both a creator of wealth and a keeper of wealth. As young investors, you have to keep your eyes on the finish line, probably several decades in the future. Since people now live and work longer, long-term investment strategies that include stabilizing asset classes are crucial.

Why Digitize Gold and silver?

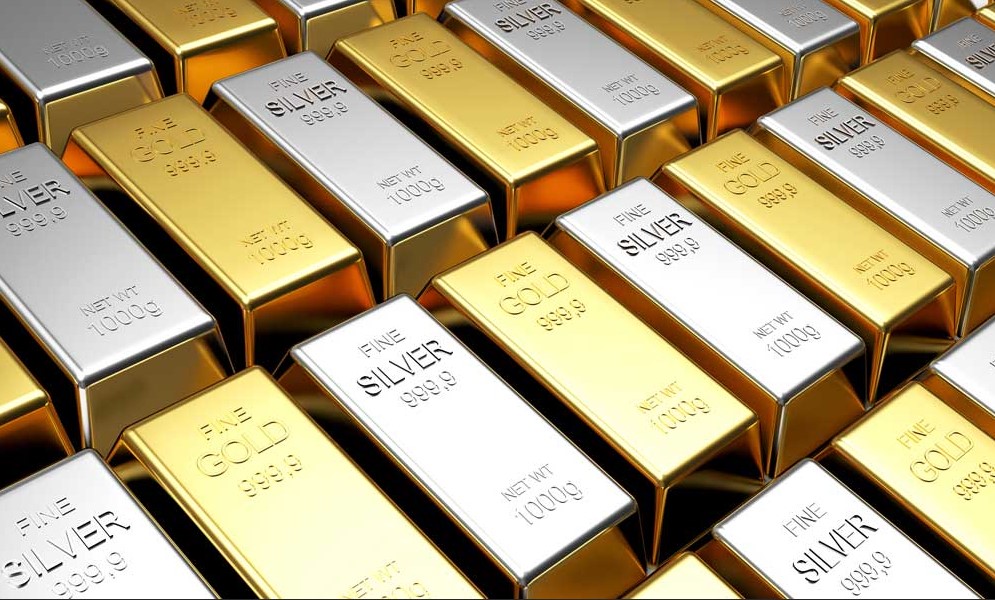
Possessing physical gold and silver has always been desirable for many. There is something tangible about it. Its physical quality means that you can see it, feel it, weigh it and admire its beauty. From a golden calf, a golden fleece and gold crowns to streets paved with gold, this metal has constituted a fundamental element of our collective human history and its images have filtered even into our language (for example, “as good as gold”, “worth its weight in gold”, etc.). In a word, gold is timeless.

There are companies that offer the best of both worlds: Purchases and possess digitized physical gold or silver. But you can exchange it with the same convenience and user experience you’re used to with other digital assets.

But possessing physical gold or silver has its disadvantages. You need to visit a gold trader or at least order physical coins or gold bullion at your store. Then you have to take care of security on your own and keep it at home. In case someone comes in and steals it, you need proper insurance and also a special safe to cover it. An alternative is to keep it in a safe deposit box at the bank or on a gold trader, which means you have to move there and pay relatively high commissions for it.

Categories
Forex Elliott Wave Forex Market Analysis

Silver Unveils an Incomplete Corrective Structure

Overview

Silver price advances in an incomplete corrective structure that remains in progress, after the precious metal topped at its highest level since March 2013. The market sentiment continues dominated by the bullish side. Nevertheless, the incomplete Elliott wave structure suggests that the precious metal could see a new low.

Market Sentiment Overview

The Silver price continues fading from the yearly highs that carried the price toward annual highs at $29.85 per ounce in early August. However, the precious metal eases over 19% from the yearly high, Silver advances 35.2% (YTD).

The following daily chart displays the Silver’s 52-week high and low range. The figure highlights the consolidation of Silver below $25.30 per ounce and the price action running below the 60-day weighted moving average. This market context suggests that the precious metal traders downgraded their market sentiment from extremely bullish to bullish.

On the other hand, according to the Commitment of Traders report, it is observed that the big participants’ speculative net positions remain on the bullish side. In this context, the descents developed by precious metal suggest that market participants are involved in a take-profit activity and do not represent a change in the current upward trend.

Therefore, in the long-term overview, the market sentiment remains bullish. Nevertheless, in the short-term, the declines observed represent a taking profit activity. Finally, as long as there is no confirmation of new signs of a new rally, our bias remains on the neutral side.

Elliott Wave Outlook

The next chart illustrates Silver in its log-scale 8-hour timeframe, which reveals the price action is developing the last move of a cycle, which began on March 18th when the precious metal found fresh buyers at $11.61 per ounce. The incorporation of new buyers drove the precious metal to a bullish impulsive structure development completed on August 06th when Silver reached $29.86 per ounce.

Once Silver prices found resistance at $29.86, it completed a five-wave sequence of Minute degree identified in black. Simultaneously, according to the price fractality principle, Silver finished the first wave of Minor degree labeled in green.

According to the Elliott Wave Theory, once completed the five-wave impulsive sequence, the price reacts in the opposite direction developing a three-wave movement. From the previous chart, Silver reveals that its corrective structure is incomplete.

In particular, the precious metal advances in its wave ((c)) of Minute degree identified in black. In turn, the internal structure of the wave ((c)) has pending the bearish movement of the wave (v) of the Minuette degree identified in blue. The last move will likely re-test the descending channel’s base, dropping between $21.35 and $19.44 per ounce.

Once Silver completes the bearish five-wave sequence of wave ((c)), traders may start looking for positioning alternatives on the bullish side. Finally, considering that wave 1 of Minor degree presents an extended wave’s characteristics, wave 3 of the same degree should not be the largest wave of the impulsive sequence of Minor degree.

In short, Silver’s market sentiment remains on the bullish side; however, the price moves in an incomplete corrective structure that could lead to new price lows. Once the short-term bearish sequence is completed, Silver could start producing entry signals on the bullish side, corresponding to the primary trend.

Categories
Forex Market Analysis

Silver: Sustained Bullish Pressure

Silver advances over 3.14% this week, increasing its gains by the sixth week in a row. The precious metal could visit the $20 per ounce, the highest level since September 2016.

The Market Sentiment

Silver, in its weekly chart, reveals that institutional participants hold a bullish sentiment. The speculative positioning identified in green, taken from the Commitment of Traders report (CoT) issued each Friday by the CFTC, confirms that institutional traders hold its long positions expecting new higher highs. At the same time, both the COT report as the price action doesn’t reveal signals of a reversal trend.

On the other hand, the strong upward momentum that can be seen on the precious metal is driving it near its 52-week high located at $19.65 per ounce. This market context leads us to expect an increment in volatility on the metal sector, which could hit new highs.

The following daily chart reveals that Silver volume remains above the 250 trading sessions average. The relatively high volume level along with its price advancement confirms that the current uptrend remains intact.

The Elliott Wave Outlook

The Elliott wave perspective sketched in the following 12-hour chart exposes an incomplete bullish five-wave sequence, which could drive prices to exceed the $20 per ounce.

The precious metal started an incomplete bullish sequence last March 18th when the price found fresh buyers at $11.64 per ounce. Once Silver started its recovery, the market participants sent it into an internal five-wave rally to $15.84 per ounce, where it completed wave ((a)) of Minute degree labeled in black.

In the previous chart, we observe a narrow-range corrective sequence developed into a three-wave structural series that failed to achieve a new lower low. This market context warns us about the potential strong upward momentum that could drive Silver toward new higher highs. In fact, the price action reveals an incomplete fifth wave of Minuette degree labeled in blue, which remains in progress.

The RSI oscillator reveals a bearish divergence, which leads us to confirm that Silver currently moves in its fifth wave, possibly belonging to a wave ((c)) of Minute degree. In an alternative count sequence, Silver could be advancing in a wave ((3)) of Minute degree.

Considering the Elliott Wave rule of extensions, the current fifth wave could be the extended wave of the entire upward sequence. On the other hand, the Fibonacci projection suggests that the precious metal could extend its gains in a range from $20.04 to $21.66 per ounce.

Finally, as long as the price action continues advancing above the $18.47, the short-term trend will continue being led by the bull traders.

Categories
Forex Assets

XPT/USD – How Expensive Is It To Trade This Commodity Asset Class?

Introduction

Platinum is one of the rarest precious metal found in the Earth’s crust. Only a few hundred tons are produced annually. The name Platinum is derived from a Spanish word platina (little silver).

Similar to how other precious metals like Gold and Silver are traded in the exchange market, Platinum is also actively traded in the market. Its ISO code is XPT and is highly traded against the US Dollar with the ticker XPT/USD.

Understanding XPT/USD

Platinum is a precious metal that is measured in troy ounces (Oz). The market price of XPT/USD represents the value of the US Dollar for one troy oz of Platinum. It is quoted as 1 XPT per X USD. For instance, if the current market price of XPT/USD is 814.50, then it means that each oz of Pl is worth 814.50 USD.

XPT/USD Specification

Spread

It is the difference between the bid and the ask prices. The typical spread in Platinum is usually around 700 pips.

Fee

Unlike currency pairs, Platinum is traded as a Contract for difference (CFD). There are three different types of the fee charged for such trades:

  • Commission charge
  • Overnight fee

Thus, the total fee will be,

Total fee = Spread + commission + overnight

For our example, we shall ignore the overnight fee as it completely depends on how long aa trader is willing to hold his positions. So, the revised fee will be,

Total fee = Spread + commission = 700 + 200 = 900 pips

Trading Range in XPT/USD

The trading range is a representation of volatility in the pair for different time frames in a tabular format. It gives the minimum, average, and maximum volatility in the pair for various time frames.

Procedure to assess Pip Ranges

  1. Add the ATR indicator to your chart
  2. Set the period to 1
  3. Add a 200-period SMA to this indicator
  4. Shrink the chart so you can assess a large time period
  5. Select your desired timeframe
  6. Measure the floor level and set this value as the min
  7. Measure the level of the 200-period SMA and set this as the average
  8. Measure the peak levels and set this as Max.

XPT/USD Cost as a Percent of the Trading Range

Cost as a % of the trading range illustrates the variation in the cost of trade by considering the time frame and volatility of the instrument. Mathematically, it is the ratio of the volatility value and the total cost represented in terms of a percentage.

Total fee = Spread + commission = 700 + 200 = 900 pips

Trading the XPT/USD

Platinum is one of the highly traded commodities in the exchange market. But its trading volume is lesser than Gold Spot and Silver Spot. Nonetheless, it has enough volatility and liquidity for retail traders to participate in the market.

Platinum is primarily driven by supply and demand that comes from fundamental factors. These factors are different from that of Gold and Silver, yet some do apply on Pl. When it comes to technical analysis, all the techniques apply that is used in other markets.

As mentioned, Platinum is traded as CFD, and each trade has a commission, overnight, and spread involved in it. This fee is fixed irrespective of the volatility of the market and the time frame traded. But there is a catch here. Even though the fee is fixed, the fee varies relatively. Meaning, a trader aiming high profit must pay the same fee as a trader aiming for small profits. The former is typically a large time frame trader, while the latter is a trader trading relatively smaller time frame.

Since the timeframe is something that cannot be fixed, one can relatively reduce costs by considering the volatility of the market. As the above table evidently depicts, as the volatility increases, the relative fee on the trade decreases. Thus, one must consider trading when the volatility of the pair is at or above the average volatility.

Categories
Forex Assets

Asset Analysis – Analyzing The XAG/USD Asset Class

Introduction

Silver is a precious metal standing after Gold. It is a vital asset to understand and forecast the potential movements in the commodity market. This is because buyers and sellers trade the silver market based on global macro trends. Moreover, Silver highly correlates with the Gold Spot prices. XAG/USD is the ticker for Silver against the US Dollar. XAG can be traded against other fiat currencies as well.

Understanding XAG/USD

Silver is a commodity that is traded in troy ounces (Oz), just like any other precious metal. The market price of XAG/USD represents the value of the US Dollar for 1 ounce (Oz) of Silver. It is quoted as 1 XAG per X USD. For example, if the market price of XAG/USD is 17.432, it signifies that each ounce of Gold is worth $17.432.

XAG/USD Specification

Spread

Spread is essentially the difference between the buying price and the selling price. The spread varies on the based account-model used.

ECN: 15 | STP: 21

Fee

A fee is basically the commission on the trade. It applies only to ECN accounts, not STP accounts.

Slippage

The arithmetic difference between the price asked by the trader and the price given by the Broker is referred to as slippage. It occurs due to two reasons: High market volatility & Broker’s execution speed

Trading Range in XAG/USD

The minimum, average, and maximum pip movement in different time frames is represented in the following table. It can be used to assess your risk on the trade.

Procedure to assess Pip Ranges

  1. Add the ATR indicator to your chart
  2. Set the period to 1
  3. Add a 200-period SMA to this indicator
  4. Shrink the chart so you can assess a large time period
  5. Select your desired timeframe
  6. Measure the floor level and set this value as the min
  7. Measure the level of the 200-period SMA and set this as the average
  8. Measure the peak levels and set this as Max.

XAG/USD Cost as a Percent of the Trading Range

Cost a percent of the trading range is the representation of the variation in fees on the trade-in different time frames for varying volatility.

ECN Model Account

Spread = 15 | Slippage = 5 | Trading fee = 5

Total fee = Spread + Slippage + Trading fee

Total fee = 15 + 5 + 5 = 25 (pips)

STP Model Account

Spread = 21 | Slippage = 5 | Trading fee = 0

Total fee = Spread + Slippage + Trading fee

Total fee = 21 + 5 + 0 = 26 (pips)

Trading the XAG/USD

Silver Spot is extensively traded in the commodity market, after Gold Spot. It offers enough volatility and liquidity for traders to participate in the market. Silver highly correlates to Gold. Traders can use it as a proxy to place their bets on Silver prices. The technical analysis can be used on Silver as applied to any other market. Even though there is enough volatility in this pair, it is not ideal for entering any time into the market. The reason for it can be accounted for through the cost percentage table.

The cost percentage table represents how expensive a trade is going to be based on the time frame and volatility. Note that, the absolute total cost will remain the same irrespective of the two factors but will vary relatively. For instance, a 1H trader must pay the same fee a 4H trader pays for their trade. But, there a catch; the 4H trader generates more P/L than a 1H trader.

Thus, to have a balance between the P/L and fee on the trade, one must trade when the market volatility at or above the average values. Trading in low volatility markets will cause hurdles in the market to reach your target. Hence, we will have to pay the same costs, even for a small P/L.

Categories
Forex Market

What Should You Know About Trading Metals?

Introduction

We have discussed metal commodities briefly in the previous article. In this article, let’s understand trading metals in detail. Trading precious metals were only possible by wealthy investors in earlier days. But now, every retail forex trader gets to trade these metals with the advent of CFD trading. Hence, a lot of investors hold metals in their portfolios by investing a significant chunk of their money in metals. Metals create a balanced portfolio as they are considered a hedge against inflation. Metals such as gold and silver can be treated as safe-haven bets since their scarcity provides support to their value.

Gold – The highly traded metal

Among all the metals, Gold is the most actively traded metal. This metal possesses intrinsic properties such as durability, malleability, and conductivity. These properties offered by gold account for its superiority. They also find their primary use in jewelry making. As with other commodities, forces of demand and supply determine prices of gold. The gold market is also influenced by risk parameters, market sentiment, and inflation trends. Investors turn to gold and invest heavily when there are signs of a global economic slowdown. The slowdown could be due to reasons like recession, political crisis, or government debt.

Because of these reasons, Gold is mostly traded by long term investors. They only look for signs of gold entering a bull or bear market. The trend can be determined with the help of equity indices. A strengthening economy means weaker demand for gold.

Silver

Silver is seen as the best metal trading option right after gold. It has its own merits. This metal is used in various industries, making it more sensitive to business conditions and trading activities. Hence, the prices of silver are more volatile than that of gold. So we can say that silver is ideal for short term traders.

Platinum

Platinum is also seen to gain value during times of economic and financial crisis. However, because of scarcity in the availability of platinum, the price is much higher compared to gold. Therefore it is less frequently traded. It still is a robust and safe-haven alternative, especially when the Gold is overbought in the market. The industrial use of Platinum is kind of similar to that of silver, making it price-sensitive to business conditions. In recent times, the demand for platinum in industrial usage is reduced by the increased use of catalytic converters.

You can trade metals with Forex brokers too

One of the important advantages of trading metals is that they give protection against inflation, which is not offered by any other financial instrument. Taking this into consideration, a lot of Forex brokers offer above mentioned precious metal trading against major currencies such as the US dollar, Japanese yen, Euro, Australian dollar, Canadian dollar, and British pound. You will also find metals such as Copper and Palladium on their platform. Some of the metal currency pairs include XAU/USD (Gold), XAG/USD (Silver) and XPT/USD (Platinum).

Conclusion

Even if it obvious, we must tell you that buying and selling precious metals do not mean the actual delivery of these commodities. We trade these metals over the counter (OTC). In this type of trading, there is high risk involved. So make sure you have a risk management plan in place, else there is a possibility of you losing all the money you have in your trading account. Some vital risk management tools include stop-loss and order cancellation. They will always protect the balance of your account.