Categories
Beginners Forex Education Forex Market

Determining the Strength of the Market by Analyzing the VSA

With this publication, we will look at an incredible method of market analysis based on the volume Volume Spread Analysis (VSA), developed by the famous American financial analyst Tom Williams and published in the book «Master the Markets». This is an unusual view that deals with how market makers manipulate crowd behavior.

Not to recount the book, so in this series of articles, we will focus on the practical side of the method with a traditional reference to cryptocurrency trading. You can apply this method to any financial instrument, my examples will be in the BTCUSD pair.

Now, let’s discuss the theoretical principles of price formation in the market and how large capital traders influence the market. I will define the main concepts that I will use throughout the course. Therefore, you should study this article if you are interested in VSA and want to better understand the actions of large traders.

What are Trading Volumes?

Even if you’re just starting your trading career, you’ve probably found the following phrase: “The market goes up when demand prevails oversupply. And, on the contrary, the market will suffer a decline at the moment when supply is surpassing demand”. We need to study the principles suggested by this phrase in order to better understand what the volume of trade means.

For those who could not find a similar term, I must explain that, in trading, is the number of lots traded on the market within a specific period. Firstly, it should be understood that the volume taken in isolation does not provide much information. But, if what we do is compare the current volume with the previous day’s volume, or a week earlier…, you will see clearly the changes in business activity.

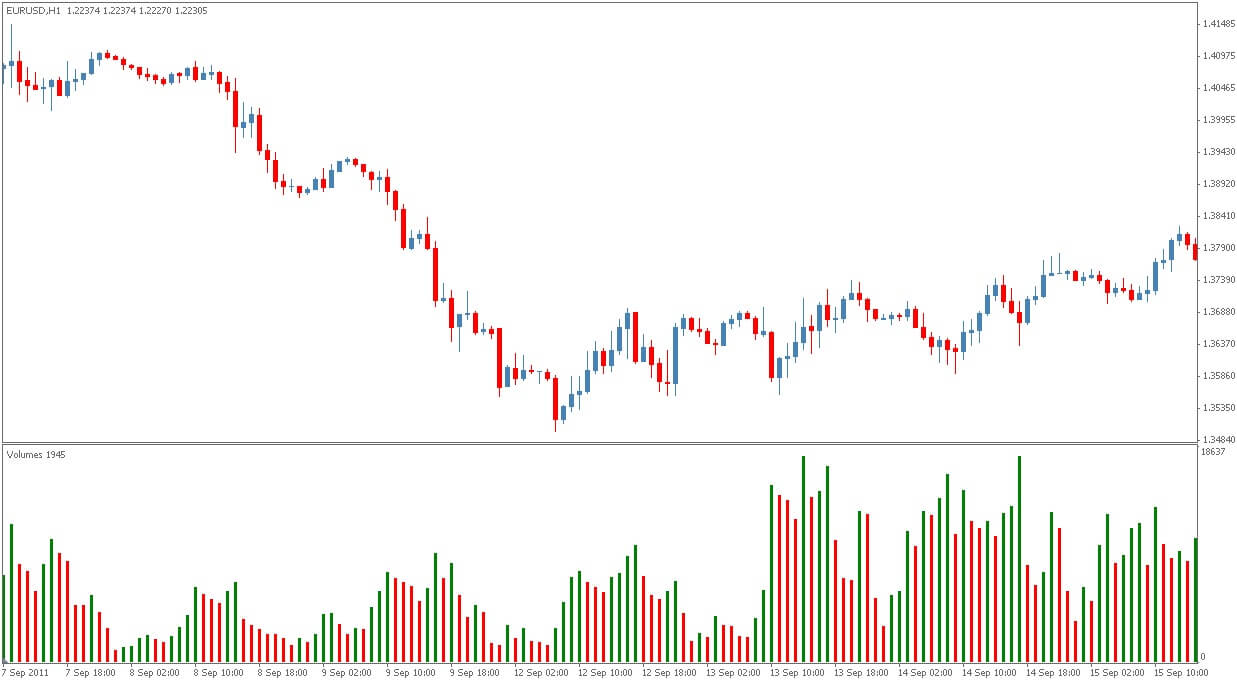
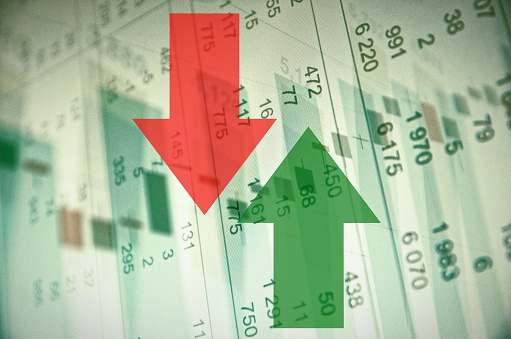
To better understand market processes, let us compare a change in volume with the price differential. This will show the feeling of the great players: bullies or bassists. Remember, the spread is the difference between high and low prices during a particular period.

In practice, price movements do not always correspond to current market activity. There are often cases where, after a small increase in volume, the price increases sharply, confusing many traders. But if you have already studied the concept of inertia, then you will have everything clearer. Then, in this situation, the market can be compared to a car in which driving at high speed will go uphill for a while, even if the driver has taken his foot off the accelerator.

What is Volume Spread Analysis?

The VSA method provides a complex approach to market analysis, which defines the relationships between asset price, spread, and volume. The last indicator shows the activity in the market. While the spread speaks of the amplitude of the price movement.

In establishing the relationships between these two characteristics, we strive to identify the imbalance between demand and supply. For the most part, it is a consequence of transactions opened by large operators, and in the trading environment, it is considered one of the most significant reasons for the market to move in one direction or another. In turn, knowing the imbalance and the true causes of its occurrence, we can easily predict the direction of future price movement.

Principles for the Movement of Assets

Volumes, like stock market trends, are also divided into bullish and bearish. The bullish volume increases the volume in the upward movements and decreases the volume in the downward movements. Consequently, the bearish volume increases the volume in downward movements and decreases the volume in upward movements.

Now let us examine the concepts of accumulation and distribution…

Cumulation means buying as many shares as possible, without significantly increasing the price compared to your own purchase, until there are few or no shares available at the price level you have been buying. This purchase usually occurs after a bearish move in the stock market and there are the best prices to buy.

Once most shares have been removed from the hands of other traders (ordinary natural persons), there won’t be much action left to sell at an additional price. In other words, resistance to the bullish movement has been neutralized. Then, in this situation, we can expect a steady increase in prices until syndicated traders perceive prices too high to sell those assets that just bought.

Distribution is the sale of assets, which should ideally be achieved without lowering the price against the sale of the market maker. This operation is done to take advantage of the profits of selling at the conditional peak of a bullish market. At the same time, most of these great players place large orders not even at a fixed cost, but at a range of prices.

If the total volume of transactions is so large that prices are forced to fall, the sale is suspended. Traders have another opportunity to sell securities profitably in the next wave upwards. Once professionals have sold most of their holdings, a bearish market begins because markets tend to fall without professional support.

Now, you understand that big forks see both sides of the market at the same time, which gives them a big advantage over common traders. To better understand the market, study the concepts of strong and weak holders.

Strong forks are professionals who have convenient positions and are able to easily read the market. Despite their ability, they can open more unprofitable operations than profitable ones, but close them quickly, considering losses as inevitable trading costs.

Weak holders are often new market amateurs, tied to their capital and therefore make emotional decisions, which are often at odds with common sense. They are often subjected to market pressure when prices turn against them, which is why they suffer heavy losses.

If we combine these concepts with those described above, we can summarize that: a bullish market is like this when a significant transfer of shares from weak holders to strong holders, usually with a loss for weak holders. A bearish market occurs when there has been a substantial transfer of shares from strong holders to weak holders, usually with a gain for strong holders.

When the market moves from one major trend state to another, an event called a buying or selling climax will occur. As a definition, it is an imbalance of demand and supply that causes a bullish market to become a bearish market or vice versa.

The climax of the purchase arises at a time of high demand for the asset and the active dumping of securities by the big players, which makes continuous growth impossible. In addition, in the bullish bar, the volume looks exceptionally high, accompanied by a new maximum and a widespread. At the end of the purchase climax, the market will close in the middle or high of the candle.

The selling climax, as seen in the name, is the exact opposite of a buying climax and usually occurs at the time of high sales. It presents an extremely high volume in downward movements, accompanied by wide spreads, with the price entering the local minimum. In the last phase of the sale climax, the price will close in the middle or under the candle.

Causes of Price Reversal

There are only two main reasons why there is a reversal of long-term trends in the market:

  1. Most traders panic after observing substantial drops in a market (often from bad news) and usually follow their instinct to sell. Professional traders, in turn, think differently, asking a question: “Are big market players prepared to buy mass stock at these price levels?” If this is fulfilled, this will be a sign that indicates the strength of the market.
  2. After substantial increases, usually for good news, most will get angry by missing the upward movement and will rush to buy. At this point, their professional colleagues are only interested in the willingness of big players to sell enough securities at the current price to meet demand. As you’ve already guessed, mass sales are a sign of market weakness.

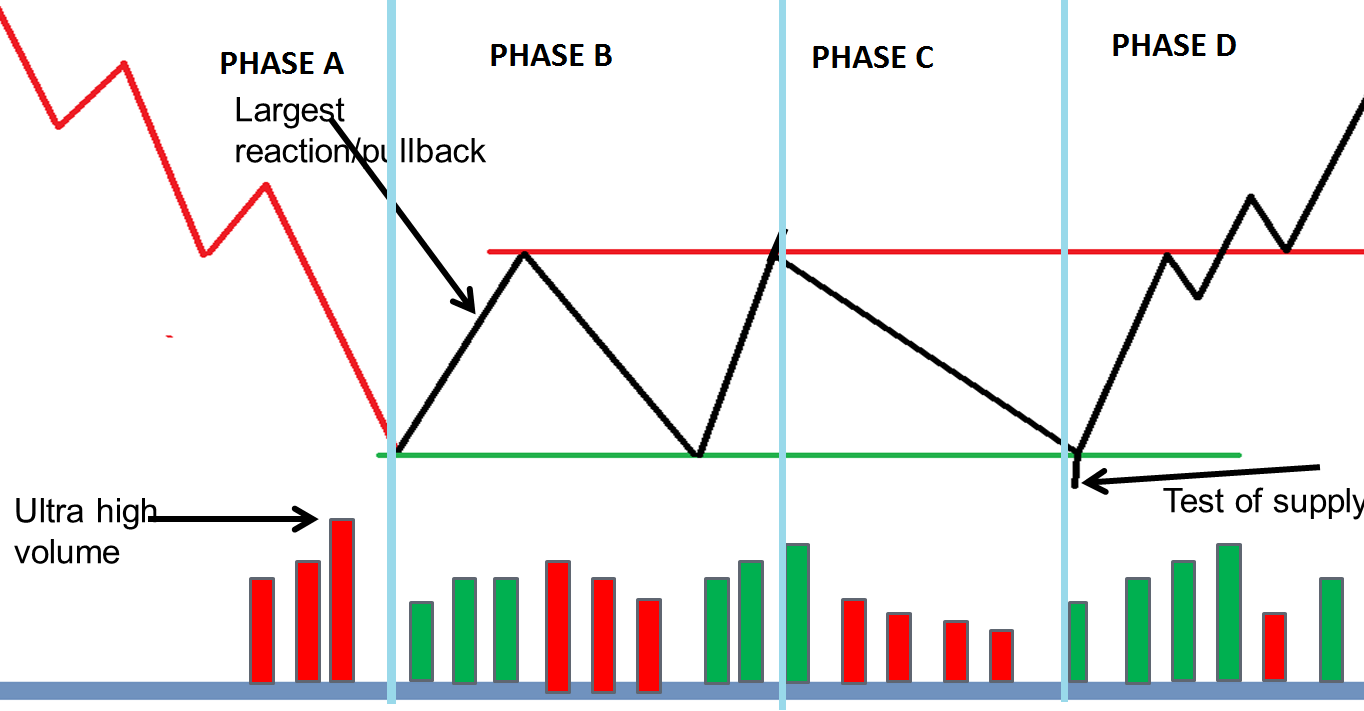
Fundamentals of Market Reading

First, it is necessary to understand that markets move in so-called phases. Looking at the changes in volumes and price spreads, we can see that the market builds a cause for the next phase. The duration of the phases may vary. At the same time, it is normally assumed that short phases lead to small changes, while long ones lead to serious steps. In addition, we will group spreads in width, narrow, or simply average, which will allow us to delve into the current processes.

Definition of Market Strength

Marketers generally process and match purchase and sale orders from traders around the world. It’s your job to create a market. To perform its functions, the creator must have sufficiently large participation or values. If you do not have enough quantities on your books to trade at the current price level, you can move the price to a more appropriate level.

Often there are situations in which the bullish movement manages to get a better price from the floor of the bag. Why are you getting a good price? Incredible kindness from the creators? The reason is different. In fact, the market value perceived by market makers is much lower than theirs, because they have already received enough sales orders and want to get rid of them quickly, expecting a reversal of the trend or at least the transition from the market to the uncertainty stage.

Such action, repeated many times with any other buyer, will tend to reduce the spread of the day towards contraction. In other words, the upper price limit will be minimal. If, on the other hand, market makers have a bullish view, they will increase the price on their purchase order, giving you what appears to be a low price. This, repeatedly, causes the spread to expand as the price is constantly marked during the day.

Then, by simple observation of the extension of the bar, we can know the references of those who can see both ends of the market.

Another example is when you find market gaps or price gaps. This term in the technical analysis refers to a situation where there is a gap between the closing of the first bar and the opening of the next bar. For example, the market opens when market makers trap as many traders as possible in a potentially weak market and lose trades and create additional stress. As a rule, weak gaps are always in the zones of new highs, when the news is good and the bullish market seems to last forever.

It should be noted that gaps can be seen in strong markets. However, in such cases, a serious difference can be noticed in the form of an extended plane. Traders who have been trapped inside the channel will panic, convulsively trying to exit the trade at a price very similar to what they first entered. Some of them expect a break in price after having bought assets close at the upper limits of the channel. Others bought at the bottom, but do not see any serious upward movement.

In turn, professional traders are aware of the situation and, looking for the time it takes to sell their own assets, to keep the bullish sentiment raise prices, or open a new candle with a gap up. The volume increases, substantially supporting the movement. This leads to the conclusion that the movement of price is not a deceptive maneuver and the big players really see the strength of the market.

Broad spreads in most cases are designed to block most traders out of the market rather than trying to absorb them. This will tend to postpone, as it goes against human nature, buying something today that could have been bought cheaper yesterday. Such manipulations also frighten market participants who opened short positions near the last minimum in the constant bad news that appeared during this period.

So we draw an obvious conclusion. The volume that usually shows a healthy increase is the bullish volume. However, excessive volume is never a good sign, this indicates that supply can saturate demand. The low volume warns you of a clearly misleading upward movement. In this case, professionals perceive the market as weak, refusing to participate in the bullish movement. The amplifier of this signal will be the presence of a flat before the price jumps to low volumes.

We must also pay attention to the low volume rates in the downbars. This is a sign that the strength of the upward trend remains high, and the upward movement will continue in the foreseeable future.

For a bearish movement, the indications are the opposite. A bearish trend is strong when the falling bars have a high volume. However, excessive volume warns that the fall in price may not be natural and that demand may affect supply.

If the volume is decreasing on bearish sails, the sales pressure is also decreasing, which means that professionals are not interested in a further drop in prices. The market may be declining for longer due to inertia, but, soon, the price may increase due to insufficient supply.

Categories
Beginners Forex Education Forex Market

Overview of “Dark Pools” (AKA Parallel Markets)

In finance, a «dark pool» is a private market used by its participants to trade in different types of securities. They are basically parallel markets operating outside the most well-known regular markets. Liquidity in these markets is called «dark pool liquidity» (sorry I did not find a suitable translation for the term).

The bulk of dark pool transactions represent high-volume transactions conducted by financial institutions, such as those executed outside public markets such as the New York Stock Exchange and NASDAQ, so that they remain confidential and beyond the reach of the general public investor. The fragmentation of financial trading sites and electronic trading has allowed dark pools to be created and they can normally be accessed through cross-network or directly between market participants through private contractual arrangements. Some dark pools can be accessible to the public and can be accessed through retail brokers.

The main advantage for institutional investors in the use of dark pools is that they allow sellers to sell or buy very large volumes of stocks without showing their position to others, which avoids the impact on the market as neither the size of the transaction nor the identity is revealed until the transaction is executed. But, this means that some market participants are at a disadvantage, as they cannot see the transactions before it is executed; prices are agreed by dark pool participants, so the market is no longer transparent.

There are mainly three types of dark pools:

Independent undertakings established to provide a single differentiated basis for trading with different assets.

The dark pools are owned by a broker where the broker’s clients interact, most commonly with other broker clients (and possibly even with operators working for the company itself) under conditions of anonymity.

Some public markets set up their own dark pools to offer their customers the benefits of anonymity and non-deployment of orders in conjunction with a stock market «infrastructure».

Depending on the exact way a dark pool operates and interacts with other places, it can be considered and in fact, referred to as a «gray pool».

Dark pools have become increasingly relevant since 2007, with dozens of different parallel markets representing a substantial portion of US stock trading, a trend we will surely see in other countries as well. There are several types of dark pools and these can be run in multiple ways, including automatically, throughout the day, or at scheduled times.

Origin of Dark Pools

With the advent of supercomputers that are able to execute programs created by algorithms in a matter of milliseconds, high-frequency trading (HFT) is already dominating the daily volume of trading in many markets. For example, in the stock market HFT technology allows institutional traders to execute their multi-million dollar stock block orders ahead of other investors, taking advantage of fractional increases or falls in stock prices. When subsequent orders are executed, the benefits will be instantaneously earned by HFT traders who then close their positions. This way of legal piracy can be occurring dozens of times a day, producing huge profits for HFT traders.

Eventually, the HFT became an increasingly widespread practice in the markets, to the point that it became increasingly difficult to execute large operations through a single exchange. Because HFT’s large orders had to be spread across multiple markets, this alerted competitors that they could get in front of the order and snatch the inventory, rising stock prices. All this happened in milliseconds after the initial order was placed.

To avoid transparency of public markets and ensure liquidity for high-volume operations, several investment banks established private markets, which became known as dark pools. For traders with large orders who cannot place on public stock exchanges, or who do not want to make their intentions known, dark pools provide a market of buyers and sellers with sufficient liquidity to execute the transaction. By 2016, there were more than 50 dark pools in operation in the United States alone, mainly run by investment banks.

How do Dark Pools Work?

Liquidity can be collected off the market in dark pools using FIX and APIs. Dark groups are actually very similar to standard markets with very similar order types, prioritization rules, and pricing rules. However, liquidity is not deliberately advertised – there is no market depth information. In addition, they prefer not to display and display transactions in any public data feed as standard markets, or if they are legally obliged to do so, they will do so with the greatest possible legal delay, all this to reduce the impact on the market of any transaction. Dark pools are often formed from order books of brokers and other sources of off-market liquidity. When comparing these markets, careful controls should be made as to how liquidity numbers were calculated: some count both sides of the transaction, or even count the liquidity that was placed but not taken.

Dark pools offer institutional investors many of the efficiencies associated with trading in the order books of traditional markets, but without showing their shares to others. These markets avoid this risk because neither the price nor the identity of the company they are trading are shown. Operations in dark pools are recorded as Over-The-Counter transactions. Therefore, detailed information on volumes and types of transactions is left to the network to inform customers if they wish and are contractually bound.

Dark pools allow large amounts of funds to be pooled and large volumes of securities moved without investors having to show what they are doing and what their intentions are. State-of-the-art e-commerce platforms and the total lack of human interaction have reduced the time scale in market movements. This increased responsiveness of an asset’s price to market pressures has made it increasingly difficult to move large volumes of securities without affecting price. Thus, these markets can protect investors from market participants who use HFT (high-frequency trading) in a predatory manner.

Dark Pools and Price Discovery

For an asset that can only be publicly traded, it is generally assumed that the standard pricing process ensures that at any time the price is quite “fair” or “right”. But, few assets are available in this category as most can be traded off the market without adding transaction information to a publicly accessible data source. As a proportion of the daily volume generated by the asset traded so secretly increases, the public price could be considered fair as long as certain limits are not exceeded. However, if public trading continues to decline as hidden trading increases, it could reach the point where the public price does not take into account all information about the asset (in particular, it does not take into account what is traded in a hidden manner) and therefore the public price could no longer be considered as «fair».

However, where dark pool transactions are incorporated into a post-transaction transparency regime, investors have access to this information as part of a consolidated list of transactions. This can help the discovery of prices.

Regulation of Dark Pools

Although considered legal, dark pools can operate with very little transparency. Those who have been able to denounce the HFT as an unfair advantage to other investors have also condemned zero transparency in dark pools since they can perfectly hide conflicts of interest. The Securities and Exchange Commission (SEC) in the United States has stepped up scrutiny of these markets for complaints related to front-side practices. Illegal running occurs when institutional traders place their order in front of a customer’s order to capitalize on the rise in stock prices. Dark pools advocates insist that they provide essential liquidity, allowing markets to operate more efficiently.

Some traders using a liquidity-based strategy consider that dark pool liquidity should be advertised to allow a more «fair» trading for all parties involved.

Categories
Beginners Forex Education Forex Market

Forex Vs. Stock Trading: Which Carries More Risk and Why?

Is forex trading riskier than stock trading? And Why? To answer this question we must analyze what is the best market to trade, whether Forex or stocks, and that is what we will try to reveal in this article because a person who is just beginning in order to know the different markets you have to decide in which of them you will make your investment and two of the best options are precisely Forex or stocks.

Over time, money is losing value as a result of inflation and a large part of your capital may disappear if you don’t work. So what you should do is have your resources constantly work for you. In order to achieve this goal, one of the ways to achieve this is to become a trader, a race full of emotions that begins when you choose a market to start trading. In the following paragraphs, we will make a comparison between two giants of the modern economy: stocks vs Forex.

The Stock Market

Stocks are financial instruments that provide the ownership of a company. Depending on the number of stocks held, a person can become the owner of a business together with the other shareholders and is entitled to the profits (or losses) that are given. It should be mentioned that the percentage of the company controlled by the investor is equal to the number of its stocks. The higher the number of shares you have, the greater your participation will be and you will enjoy better profits.

Thousands of people and institutions gather in the stock market to negotiate securities that represent ownership of several companies listed on the market. The stock market has been the main asset exchange market since the time of the industrial revolution. But thanks to the arrival of new technologies and the expansion of the Internet, other markets have emerged that counterbalance traditional actions.

Credit: pacforex.com

The Forex Market

Forex, also known as the currency market, refers to the market where participants trade and exchange coins from any country. Currency is how money is officially issued by a nation’s central bank and serves as a means of exchange outside and within a given economy. There are people and companies that carry out transactions from different nations, therefore it is necessary a scenario in which it is possible to exchange these different currencies.

“We will analyze the most relevant aspects of Forex vs Stocks to determine which may be the best investment.”

Ease of Access

Forex trading, in contrast to the stock market, is not based on physical stock exchanges but is OTC (over the counter). This means that negotiations are conducted via the Internet and people can access them anytime and anywhere, which translates into superb accessibility.

We must know that today, the negotiations with stocks (and in general with any financial instrument) are conducted via the Internet. Anyone who wants to trade, whether with currencies or stocks, just select a broker, open an account and download the trading platform. In this respect, both the Forex and stock markets are easily accessible.

Credit: Investment School

Leverage

First of all, it should be borne in mind that, both in stocks and in the foreign exchange market, entry requirements are minimal and in some cases, it is possible to open accounts without making any deposits. An important element to consider is leverage, which can be accessed when negotiating. This leverage is like a loan that the broker makes to its clients to make a trade with more money than we have.

In the stock market, the usual leverage is 1:2 (you can borrow 2 dollars for every dollar you have of capital), while in Forex it can reach 500:1. There is no need to be too smart to choose the best option. The high margins offered by brokers give this point to the currency market. But…leverage can become a problem for some traders, especially for those starting out in this market. This tool allows you to multiply profits, but the same will happen with losses. So you need to use leverage with responsibility and knowledge.

Another aspect to compare between Forex and the stock market is the different trading costs. In Forex, commissions are usually lower due to the large number of brokers that exist. On the other hand, stock exchange brokers charge commissions, spreads, and other fees that can significantly increase commercial costs.

It may seem that these small costs do not have much incidence because they will mean a few cents, but as time goes by you will see how they add up and become a major expense. These small expenses can deplete a portion of your earnings. At this second point, the Forex market takes the lead with its higher leverage ratios and lower transaction costs.

Operating Hours

Probably the most obvious difference, when comparing Forex to stock trading, is trading schedules. The stock market is limited by timetables of exchanges worldwide. Forex is open 5 days a week and 24 hours a day. This Forex feature allows people to trade at any time, providing for investors who have traditional jobs. But, although the Forex market is widely accessible, there are hours with higher volumes and therefore better opportunities.

One of the features of Forex is that volatility and liquidity levels remain relatively constant over time, allowing traders to generate profits in the short term. However, that doesn’t mean that you should envy yourself to the market and spend all your time viewing the graphics. The market won’t go anywhere.

Another positive aspect of foreign exchange trading is that if you open a position and get important information that forces you to close the position, you can do it immediately without waiting for the opening of the stock exchange. When deciding between trading stocks or currencies, the advantage of Forex is obvious. Its great accessibility is a plus.

Diversity of Offers

One of the most diverse markets is the stock market. There you will find the stocks of hundreds of open capital companies belonging to a wide variety of sectors and industries. This may seem positive, but such diversity can become confusing and prevent a quick analysis of available options. Can you imagine having to analyze hundreds of stocks and then buy just one of them?

Looking at the Forex market versus the stock market, it is possible to show that with currencies the scenario is significantly different. In Forex, the most quoted instruments are the so-called major pairs (groups of currencies composed of the most important currencies) and the US dollar is part of the vast majority of transactions. A trader who is aware of the key factors affecting the dollar will have a good overview of the other currencies.

Similarly, most Forex brokers offer one more possibility: CFDs (difference contracts). These instruments allow transactions with different assets without actually having them. ¡ That means even on Forex you can trade stocks! And so, when comparing Forex vs stocks, it is the currency market that takes the lead once again thanks to CFDs.

In conclusion, thanks to its greater accessibility, vast amount of possibilities, and superior freedom, Forex manages to position itself as a better investment option than stocks. While it is true that Forex risk may be higher because of increased leverage, we have options to have good risk management and minimize them.

Categories
Beginners Forex Education Forex Market

How Is COVID-19 Impacting the Forex Market?

I’m not here today to talk about algorithmic trading or systems or tools. I’d like to tell you something that is in the focus of traders in recent days and especially because it is an important issue because it affects the lives of many people. As you know, if it affects people’s lives it affects the economy and, of course, the currency market. But how does the forex market react in this environment? We’ll tell you…

I’m sure you’ve heard of Covid, but just in case, let’s discuss. It is a virus that we can catch through the mouth, ears, nose, and even the eyes and affects the respiratory system. Symptoms are dry throat, cough, sneezing, muscle cramps, breathing problems, high fever and can be as fatal as kidney failure leading to death.

It seems that there is a consensus and that the virus started in Wuhan (China) in about December 2019 last month and has traveled through Japan, Thailand, and now America. There are several hundred people infected and he has several deaths on his back.

How Coronavirus Impacts Markets

Understanding history will help us understand the reaction of markets in a similar case, bearing in mind that each circumstance is different from the previous one. The outbreak of the virus is reminiscent of the SARS pandemic in 2002 and 2003 that killed some 800 people, most of them from China and Hong Kong, according to World Health Organization data.

SARS had a significant impact on Asian currencies, in its rates and actions from the point where infections were officially identified by the World Health Organization in February 2003 to the peak of new daily infections.

How many times have we already warned that the markets least like fear and uncertainty? With this background, the investor keeps his portfolio and prefers to be out of the market before possible strong movements that affect him in a bad way. This leads to falls in global indices and greater volatility in the foreign exchange market.

Coronavirus and the Currency Market

To the point, Ruben. It is clear that because of the nature of the coronavirus the currencies that are most affected are the Asian ones. The Japanese yen (JPY) is acting as a refuge, as it usually does in times of economic uncertainty. That is why we can see in most crossings how it is being strengthened with respect to other currencies. The Chinese yuan (CNH) is looking very weak and in most pairs, we can see strong movements down the currency.

Also important is the Australian Dollar (AUD) which, due to its direct relationship with China, is being negatively affected. This is because of Australia’s trade relationship with China. Any signs of slowdown or risk directly affect AUD.

What to Do As a Trader

It is impossible to predict what happens with active x and establish clear rules for buying or selling in these situations. The ideal is as we always say to rely on cost-effective systems that have an advantage and management with connection and disconnection rules. Systems should be created by already contemplating data or market scenarios with high and low volatility. That being so, you should have no problem when events happen. Manage your systems as if you were a watch and adjust your risk so when the volatility is triggered it affects you as little as possible.

There are traders who prefer to stay out until everything happens, fully understandable as well. But remember that most of the time there’s going to be some event that’s going to create uncertainty for you.

Categories
Beginners Forex Education Forex Market

The Legality of Online Forex Trading in South Africa

If you were to go through any of the major social media platforms and look for things related to Forex, you will most likely find quite a large community of people that are from South Africa. Forex and trading have started to become quite a popular pastime and business opportunity for those living in South Africa, and this is on the rise due to the increase in the accessibility of trading with the entry requirements being as low as having an internet connection, phone and just $1 to trade with.

There is however quite a bit of confusion in regards to whether or not forex trading is actually legal in South Africa. On one side of the discussion is the minister of finance in South Africa, Tito Mboweni, stating that forex trading is illegal in South Africa and that residents are not allowed to speculate against the South African currency, the rand. On the other side is the Financial Sector Conduct Authority (FSCA) has stated that it is legal for South Africans to trade in forex, including the rand as long as they are trading derivatives from a fully licensed broker. To add to the confusion more, the minister of finance has also stated that regulated brokers can allow people to trade derivatives, which was contradictory to his previous comments. This has made trading quite a grey area, yet it doesn’t seem to stop people from getting involved in the industry.

One thing that has been made clear from both Tito Mboweni and the regulatory body FSCA is that it is illegal for people in South Africa to purchase forex or to use forex based services from firms or people that do not have the proper authorisation to sell and offer those services, it has also been made clear that it is actually illegal to speculate against the rand. The problem is that there is a lot of confusion being created from the fact that not everyone actually understands what forex actually is.

Forex trading is a form of contract for difference (CFD) trading, these are financial instruments that get their value from the underlying assets, this includes things like the exchange rate of a currency pair or the price of a metal or equity. Due to the CFDs getting their price from an asset, they are classed as a derivative, when you make a trade in forex, neither the trader nor the provider of the trade is taking ownership of that asset.

Due to forex trading being classed as derivative trading, this word means that trading would be legal in South Africa as both the minister and the FSCA have confirmed that it is ok for South Africans to trade these derivatives. The FSCA still states that any South Africa based firms must be authorised and regulated to offer these services, but there is no law in South Africa that prevents its people from trading with a broker that is based outside of South Africa, or even with brokers that are not regulated by the FSCA, they are strictly there to monitor the providers rather than the trader.

The rise of online brokers who are offering CFDs to trade has made it far easier for South Africans to trade, in fact, it would be quite difficult to find a broker that would be classified as illegal in South Africa. This is simply due to the fact that for it to be classed as illegal, you would need to be making a purchase directly with real currency, which would cost a fortune, millions of dollars in order to make any trades of value. All online trading in South Africa Derivative trading does not however mean that it is without its issues or grey area. Brokers such as JP MArkets which was one of the biggest South African brokers have just gone into liquidation and showed us that there were a lot of issues within the South African trading scene, but it would appear that illegal trading would not be one of those issues.

The regulation within South Africa is regularly changing, the recent collapse of JP Markets was based around a change in the regulation from the FSCA, where they introduced a new licence for brokers within South Africa which was called the ODP licence. When the FSCA investigated JP Markets, they did not hold this new license and so they were then able to quickly shut the operation down

The thing to take away from this is the fact that as a trader in South Africa, there are no legal issues or reasons as to why you should not be trading with an online broker. As long as it is CFD trading to which 99.9% of online brokers are, then you are fully within your rights and the law to trade, even from brokers that are not stationed within South Africa. If you are going for a South African broker, then ensure that they are regulated by the FCA and that they have all the required licenses, this way you will be sure that you are trading with a legal firm and that you are at least partly protected from any wrongdoing.

So to answer the question as to whether or not reading and forex is legal in South Africa, it is a yes, as long as it is CFD/derivative trading.

Categories
Forex Fundamental Analysis Forex Market

ICO´s Are Indeed Risky, But Here’s Why You Shouldn’t Ignore Them…

What will the future of ICOs look like internationally? Without a doubt, ICOs are generating great expectations and I think there is probably an excess of them. Often these are planned too quickly or with a very unclear after business idea. But it is also true that very powerful and interesting projects are coming to light and that they are also generating a lot of benefit to many investors and also in the short term.

The regulations established and the time will make the situation normal, but we must also bear in mind which is very laborious to analyse the real potential that some blockchain companies can have in the long term. Probably, some of the ICOs that have already come out is laying the groundwork for how technology works in the near future.

What is the operation, essentially, of an ICO, why is this system born and what differentiates it from the rest?

An ICO is a new financing (and therefore investment) model for technology companies in the Blockchain sector, although they are also starting to be used in other sectors. ICO stands for Initial Coin Offering and there are certain similarities between an ICO and an OPV. In early 2012, J. R. Willett published a draft of the project he wanted to create: Mastercoin. The summer of 2013 opened a time period where users could buy Mastercoins, the future tokens that the protocol would use to perform transactions.

The idea was that with all the money raised the Mastercoin protocol could be developed, so the appraisal of the tokens would be increased and the initial investors could sell their Mastercoins more expensive than when they bought them. This way both sides would win.

Funding a project through an ICO allows you to get financing through a path that did not exist until recently and with several advantages. Many could be listed, but I will only highlight a few. For example, you can present your idea to thousands of people and not just a dozen investors, so you increase the chances of finding more people willing to invest in your proposal.

Another positive point is not having to negotiate different agreements or contracts for months with different investors. In addition, at no time do you relinquish control over decisions that are made in exchange for investment.

Also, if you look from the investor’s point of view, the ICOs are very interesting because you have a chance to get very good returns in a relatively short time and also has a great range to choose from, although we do not fool ourselves, choosing a very profitable project is not so easy. And finally, note that VCs are increasingly interested in this new figure for the liquidity that allows them and that they in their model can not have.

How to differentiate a cryptocurrency from a “Token”? On many occasions, we confuse them…

We call a cryptocurrency a currency (virtual and digital), which is encrypted using cryptography. By the latter, I mean that encryption techniques are used to secure and verify the performance of transactions.

We could then categorize cryptocurrencies in two ways: altcoins (“alternative cryptocurrency coins”) and tokens.

Altcoins could be said to be alternative currencies to Bitcoin. Some altcoins are a variant of Bitcoin, that is, they have been created using the protocol itself but changing parts of the code leading to a new currency with different features. Some examples of this type of altcoins could be Litecoin. But in addition, there are other altcoins that have not been created from the Bitcoin protocol. This means that they have been created with their own Blockchain and protocol that supports their currency. A very clear example is Ethereum. In short, it could be said that altcoins have their own independent Blockchain, where transactions relating to their native currency occur.

Tokens are the representation of a certain value or functionality and are normally located above another blockchain. For the latter reason, creating tokens is a much more “easy” process as you don’t have to modify the code of a particular protocol or create a blockchain from scratch. All you have to do is follow the requirements of a certain blockchain such as Ethereum or Waves, which allows you to create your own tokens.

In short, one of the main differences between altcoins and tokens lies in their structure. altcoins use their own blockchain, while tokens operate on a blockchain It could also be explained or differentiated in another way. Altcoins can be used as money, and tokens “only” can be used on the platform that created them. Although this does not mean that a token can also be sold or purchased at a certain price.

What is the procedure to launch an ICO? And to go to an ICO?

There are really different ways to launch an ICO but I could summarize some common points that you have to have the knowledge very clear when launching. The first, and one of the most important, is to know if the token of the ICO has a sense, a real utility, in the future project. Otherwise, it doesn’t make much sense to throw an Initial Coin Offering. Linked to the token, it is also highly recommended to correctly set the type of token sales model (reverse Dutch auctions, hybrid capped, etc.) because it is another of the many elements that can influence whether or not to collect the required amount.

Another point to bear in mind is to have the right legal and tax advice. First, because being such a recent sector it is difficult to find real professionals. And second, because if you don’t have the legal and fiscal conditions well defined, the ICO could be blocked at some point.

With regard to security, it could be said that a smart contract should be developed to raise funds and issue tokens that have passed different security audits. You have to be prepared to receive “attacks” to the web and be very attentive to the different forms of phishing that are given, either from your own web as in social networks and forums.

To achieve the highest visibility of the project, and therefore, a large number of investors is vital to proper marketing planning where I can tell you that the costs of campaigns are very high given that there are more and more ICOs that need to stand out from the rest. And more briefly, it is necessary to write a detailed Whitepaper, get agreements with the most important exchanges, have an investment committee, and that the customer service before, during, and after the ICO is excellent.

Regarding the steps to go to an ICO. To tell you that it is complex because you must have a wallet compatible with ERC-20 tokens, find a solid ICO, and with revaluation possibilities. Once you get to that point you should wait for the day of the launch of the ICO, be quick not to stay out, and also buy your tokens correctly. Well, it is usually difficult not to arrive on time because it usually takes several weeks before all the tokens have been purchased, unless it is a very important ICO since there have been cases that in a matter of hours all the tokens have been sold.

Are ICOs safe? Of course, there have been cases of failure and success.

Let’s not kid ourselves, investing in an ICO is a high-risk operation but it is proportional to the great returns you can get. However, if you take different measures you can partially minimize that risk. For example, you must read the Whitepaper several times to be well informed about the project and from there you can look for additional information: know the state of the sector where it will operate, know in more detail the equipment behind, request information in case of doubt, analyse whether the distribution and destination of the money to be collected are correct, etc.

A story, in this case, of success, because it has achieved high profitability, which I always like to name is that of the Stratis project. The price of the token during the ICO cost $0.007 and a few weeks ago I got to see it at $4.9 which is an x700. But I have also seen for example the token of Virtual Accelerator that was worth $0.04 in its beginnings and that its price has been at some point at $0.002.

And we ask ourselves the next question, what is the most important thing we need to know before we enter the world of cryptocurrencies? The most important issue we need to take into account with respect to the two big cryptocurrencies of the moment, Bitcoin and Ethereum, is that if you plan to invest in them you must do it with long-term thought and not sell even when there are moments of heavy falls. However, it is only a point of view and in the end, everyone decides their strategy and what to do with their money.

Categories
Forex Market

Dirty Little Secrets About the Forex Industry

We just adore revealing things that are not talked about in the mainstream media. In our articles series, a trader could notice most of our trading methods are not ordinary. There is a reason for all that. Some could say it is a conspiracy but consider crisp and public proofs on the internet, reporting, news, forums, and other sources, some of which we present here. Dirty little secrets about forex are everywhere, in many forms, from fundamental manipulation to technical trading quirks that turn out to be manipulations too. Here is what we want to tell you.

Forex Gods

We will start from the forex rulers, the world’s largest banks are moving the currencies, not you or me, however big your pocket is. Never try this, and never get vengeful at them, forex has specifics because of the big bank interventions otherwise forex would look like the stock market as some professionals would say. Their dirty little secret is of course manipulating the forex market and the hunt for cluster groups of traders’ positions. It is not just about the Stop Loss positions or any pending orders, but about orders already triggered. Just a hint for those thinking about using a script to hide pending orders away from broker servers. As one familiar pro trader explained, the banks notice where orders are triggered, then they let a small movement that favors the traders, however, what follows is a sharp correction that cuts through most of the traders. Professionals that follow the big banks’ psychology call this accumulation (of traders) and manipulation phase, it looks like this:

Notice the far left side of the picture where the downtrend is reversing. This is the area where traders start open buying positions. The banks like these clusters and leave some movement up to keep them building on. What follows is a sharp move to the downside below the initial reversal level (middle of the picture). This is done to eliminate buyers’ Stop Loss. Only then the real trend starts which is much larger (right side of the picture) than the initial fake one. 

Now, another easier way to see this is by looking at the traders’ sentiment indicator. As mentioned in our previous articles, the IG group has a Client Sentiment Report daily on most forex pairs and other assets. Notice that the most liquid pars, also the most popular ones, are not moving according to the supply and demand logic. It is almost perfectly reversed. When buyers come in, the price falls, and vice versa. 

Hey, this does not happen on crypto! If you wonder why, cryptocurrencies’ core idea is Defi, decentralization, or no bank involvement. Even precious metals are not that manipulated despite the recent fine:

Credit: Reuters

Commodities have real supply and demand, not much room to manipulate there, however, money or currencies can be printed whenever. Printing can be digital with a press of a button too. Here is some more news about this recurring event (CBNC):

Ok, we have some raising eyebrows now, this dirty secret is repeating however there is not much “ordinary” people can do. Interestingly, according to pros, this behavior is what gives forex movements and sets it apart from the stock market, for example. Indexes by the way, also have sentiment anomalies, but be aware there is a very strong link between equities and the forex gods. 

The Brokers

Ok, these guys are not really forex gods but they still play a role to retail traders and they too, of course, have dirty little secrets. They are one part of the forex industry and are playing a similar game, even though forex unethical games come in many flavors, this one is the most popular. It is the Stop Loss hunting

Now, this is done on a smaller scale, it is not in plain sight and justice is rarely served. If you wonder why it is because they are the same team. Transparency is always the issue, you do not know what is done and if there is a conflict of interest caused by the well-known fact some brokers earn money from their clients’ losses. Stop-Loss hunting is hard to prove and the excuse is always the same, brokers are connected to different liquidity pools or banks so not every broker has the same price action. This explanation is overused. If we look up at the clients’ opinions, some brokers are labeled as stop hunters while some are not even though they are companies of the same size. Transparency is not strong with brokers so the only truth meters are the forums that reflect customer satisfaction. 

Review Misleads

Portals that reportedly host broker reviews is another dirty little secret that is present in the forex industry, however not uncommon in many other businesses. Just typing some broker name with the word “review” will overwhelm you with results. There are a few obvious ads first but then what looks like a sound review website. Sometimes the review has a great, 5-star rating, while the same broker is criticized on other portals. This is one easy clue that somebody paid for good reviews. More often than not, the same portals are owned by companies that hold broker brands, making you think they are separate entities. Of course, their brands are top-rated while the competitors are destroyed. There are also affiliate websites that just put a good word for anyone that wants it (pays), provided the affiliate website has a good number of visitors. 

We have put a lot of work writing independent broker reviews, however, if you are looking for client opinions forget about the first search results pages. Real, unbiased opinions come after, where the money noise is dimmed down. Only here there is no special interest by the brokers to mess with the truth. Alternatively to forex-academy.com, the Forex Peace Army portal is a very good source for reviews and client opinion, but there are more out there under the served plate. 

Reading fake reviews does not end with brokers, you will also find reviews for Expert Advisors for MetaTrader platform or automated trading solutions companies. The same marketing scheme is applied, yet the source might be a company that developed the script, not only a broker. It is often mixed since you need a broker and probably a VPN service too. 

Marketing

Similar to other industries, marketing borders with the ethics on one side and the law on the other. Brokerage is a heavily regulated industry yet it still has enough freedom to legally scam beginners. Even though certain regulatory measures are now more restrictive, such as leverage limit, amateurs looking for gamble trade are easy pickings for brokers. If you heard about the high percentage of losing trades in the forex industry then you get the picture of why. Of course, education is also tainted by this scheme so it is not easy to blame the client. Even those who do not want to gamble do not easily have access to good resources and learn to trade. Similar to the review search, good educational websites are rare and show only after all the junk in the first pages. 

Forex is a Scam?

Foul play is present in forex and people do not believe in the trader dream, the dream is vividly presented in marketing to lure uneducated clients. This is easy money for brokers and banks only. As it was not already plagued by the industry, forex is also a good playground for outright scammers. It is especially present today with untraceable cryptocurrencies. Scams are just another reason and alarm for beginners to dig deep when it comes to forex trading that, interestingly, elevates their research skills essential for successful forex trading. Forex has many ways to scam you, however, meticulous, patient, and curious will find their way to the trader’s dream eventually, just keep up the work. 

Categories
Forex Market

What’s Holding Back the Forex Industry?

The short answer is well known but the rabbit hole goes deep. It is the same reason we have global economic downturns, each special in its way but with a common enemy. The behavior of all actors linked to the forex industry is guided by many interests. Interests that do not align with individual forex trading. Let’s try to understand the gist since the short answer just turns people away from trading even though forex trading is one of the best ways to attain financial freedom, despite its quirks. 

Forex Views

We could bring the scam debate that plagues individual trading almost since it became available to regular folk. But we could not just stop there and tell it is the only thing on the way of what is really great about forex trading. Interestingly, the first thing that comes to mind to people about forex (also binary options) is betting, scammers in suits, and very unethical ties in the backstage of brokers. 

Some parts of the globe are educated and know a thing or two about the markets, be it equities, crypto, forex, or something else. Others do not, and unfortunately, these people are good targets for scammers. It is enough to be a victim and then the word of mouth forms groupthink. It is really hard to get out of the common conception that not all forex brokers are bad and not all traders are losers. Simply, once you get burned it is likely you will get burned again, which makes it even sadder knowing in most cases it is because these people are truthful or in desperate need of income. 

Forex Broker Agents

In so many cases broker agents are just employees with good on-phone selling skills. Sometimes not even that. Outsourcing the workforce benefits the broker industry but not the actual client. People with just a bit of common sense know if somebody is looking to save by putting a non-native speaker to speak about sensitive, demanding topics of forex trading does not care about the client or their money. Then the client or the forex trader, beginner or not, is perceived as part of the money harvest. 

We can go even deeper to understand the whole picture. These employees are also just a part of the broker scheme to make a high turnover of small deposits from small investors who are oblivious about what is about to happen, let alone about forex trading. The pressure is on sales, so much it borders with manipulation using half-truths, sometimes complete lies. If the sales team does not deliver the “investing now” hype to the client, they will get replaced eventually. All this creates a profoundly exploding “Wall Street” atmosphere seen in the movies. The reality, of course, is not easily discovered. Can you blame the business model? Some would say it is just how business is done, which gets us to the next point.

Broker Business Model

Spend some time reading about the broker model and you will notice a lot of discussions. Interestingly, some topics are not discussed much within the industry. How come there are brokers who can act as market makers with their pool of positioning against a trader that is not in conflict of interest? This conflict of interest is now covered with different technology, connectivity, liquidity providers, all of which actually belong to a bigger motion of deals between banks and brokers. Even the biggest brokers in the forex industry, like the IC Markets, openly state brokers are not following the interest of traders. Apart from a few exceptions, most make money when their clients lose. Do not get lost reading about the ECN, STP, B-book, A-book brokers, it doesn’t matter really. 

At the end of the day, it falls to the traders’ community. In these places, they can share their experience based on which a new trader can decide if some broker is good or not. But what about all the people who do not always find these sources? These portals are not what first comes out of the search or the broker’s websites. Whatsmore, the marketing is carefully designed to bring out all of the good feelings about trading even though it is superficial. Their targets are not the people who dig deep to find the right portals and information, but those that are impulsive and unaware. Since the majority of traders lose in the industry, a lucrative business will continue. 

The Big Banks Game

Forex has never been designed to bring fortunes to traders, on the contrary. A direct proof of that is the sentiment index available at one of the biggest forex houses, IG group. But this forex game has been present from the beginning, it is not the reason that is arguably holding back the industry. It is the fact major players have the final saying, even if it is against the law. Experienced traders have witnessed so many fines paid by funds and banks measured in billions yet no one questions if the same game will continue. It will, it seems, be how forex works and how it is connected with other industries. Major players turn so much volume fines are just one drop in the bucket. Like the concept of fines are made just to appease the law is present and functioning. Now, the big banks control the forex, governments can also generate money out of thin air, and the world elite has their wealth secured and multiplying, but this does not stop forex still being one of the best tools of your personal finance management.

Regulators

Everyone remembers how most governments of the world were somewhat clumsy reacting to the COVID-19. Similar is with regulating the brokerage. As some broker CEOs agree, not much has been done to cope with problems related to the inappropriate approach to forex trading, more specifically risk management. Reducing leverage has not solved the problem, the leverage is still optional to a significant degree and it will still eat up reckless trading. It is not even a compromise solution between clients on the one side and brokers and regulators on the other. Clients still lose despite the reduced leverage for regulated brokers. To make you think, observe how much is invested in marketing and how much into education and responsible trading. Just to make things clear, forex is primarily a money network for the big players, regulators are under pressure but not by the traders. Invent something like bitcoin where the focus is on the network user alone and you have governments, companies, and the big banks looking to seize the control.

Media and Marketing

The media has its own place in the industry, as with many other “markets” not clearly defined on the economy table. What is presented to you on TV, in newspapers, and most of the other popular information sources are sometimes even made up reasons for crashes that unexpectedly happened. Smart presenters tell you a correlated chain of events that lead to a flash crash, for example, but they always seem to be late tellers. This does not help anyone except to keep you calm and quiet. Eat up your loss because it was an “accident” no one is responsible for. Experienced traders know what happened, and most of these events are driven by the major forex players on purpose. Pegged Swissy is a perfect example. 

Another interesting phenomenon is market presenters always sound very smart, but they are not good traders. If it is cool and easy to understand, that is what the masses want, not what traders can benefit from. 

Real Forex Trading Benefit

The real trading education starts far away from the marketing and the media for the masses. It is not always what you want to hear, but forex trading actually can be one of the best “jobs” you can get. However, to get to the top and be in the minority of winners is hard work, at least in the beginning and it is for the persistent researchers. All the unforeseen barriers to entry deny many who try. Those that remain enjoy forex knowledge which translates to many other investing areas and real life.

Categories
Forex Market

Forex Trading By the Numbers (This Information May Shock You)

For most current traders Forex markets are the privilege they were born into. As the majority of them are below forty–five years of age, they are too young to remember the Bretton Woods Agreement that was set to rebuild the post-World War II economy. This agreement established a system that ensured that each country adopted a monetary policy pegging their currency to the US dollar which was in turn tied to the price of gold. That became known as the Gold Standard.

Due to insufficient gold supply to cover for dollars in circulation during Nixon’s administration, the dollar has depreciated. The two currencies parted ways leading to the collapse of the said system in 1971. Finding a new model took a while and in 1973. countries were permitted to adopt any suitable exchange arrangement for their currency or let it float freely. Market forces began determining the value of one currency relative to other country’s currencies, thus giving birth to modern forex trading.

Initially, it was exclusively a playground for major players. The only ones who had access to forex trading were leading banks, financial institutions, and governments. The required minimum sum at the time was 40-60 million dollars. It was not until the nineties that a single person such as yourself could cross the threshold of trading with the first deposit not larger than $1,000.  Admittedly, even in 2020 market share of retail forex trading is only 5.5% while multinational corporations and hedge funds have the rest. Still, there seems to be enough for everyone. 

Technological progress played an important role in letting individual traders get into the game. The emergence of the Internet and the spurt of communication accelerated the information exchange. The appearance of forex trading platforms in 1996. facilitated trading currencies in real-time through the Internet and forex brokers. Software development gave us Meta Trader 4 (or MT4) in 2005 and MT5 in 2010 which are still used by 54% of the retail brokers a decade later in spite of numerous other software with user-friendly interfaces. Mobile phones play a big part in today’s trading. 35% of traders search for brokers via smartphones.

A Word or Two about the Market

The Forex market is the only financial market that works round the clock. Major world markets either overlap or as one closes in one part of the world the other one opens across the globe which makes it available 24 hours a day. 

There are four accepted time zones or sessions named after the cities where most forex trading takes place. Those are London, New York, Sydney, and Tokyo. The overlap of London and New York sessions marks the busiest part of the day. During those four hours, the bulk of the average daily $6.6 trillion of trade transpires. In comparison to the New York Stock Exchange, the daily trade volume is 53 times greater. This number is significantly higher than in 2016 when the previous market analysis was carried out by The Bank for International Settlements (BIS). 

The triennial period marks yet another growth of nearly 25%. The entire global forex market was valued at $1.934 quadrillion dollars in 2016. In case you were wondering, the figure is now $2.409 quadrillion. It is twelvefold the futures market and 27 times greater than the equities market.

Currencies and Currency Pairs

There are 170 currencies traded on the global forex market. In terms of how frequently they are exchanged, they could be either exotic or major.  The former is not in the top seven, but may still be noteworthy. Exotic currencies of emerging market economies (India, Mexico, Russia, Pakistan, Saudi Arabia, China, and Brazil) contribute to 24.5% of all market transactions.  

The latter ones are exchanged most frequently. They include the US dollar, the Euro, the Japanese Yen, the British Pound, Australian Dollar, the Canadian Dollar, and the Swiss Franc. In ascending order the last two account for the 5% of forex trading each, AUD for 6.8%, GBP for 12.8%, and JPY holds third place with 16.8%. The Euro is our silver medalist with 32.3% of all daily trades. Finally, lonely at the top is the USD. It is the only currency on either the base side of the quote side of major currency pairs involved in as much as 88.3% of forex deals as stated in the BIS survey of 2019.

According to the currencies involved in trading, there are three types of currency pairs. Majors are dollar-based transactions of major currencies and they make up 67.4% of the Forex market’s daily trade. Minors consist of two of the major currencies, the USD excluded (for instance GBP/EUR and AUD/JPY). Exotic pairs consist of one major currency and one exotic currency (e.g. a currency of a developing economy such as China or Brazil).

The Magnificent Seven

Major currency pairs are the 7 most prominent: EUR/USD, USD/JPY,  GBP/USD, AUD/USD, USD/CAD, USD/CNY, and USD/CHF. In everyday speech, they are often referred to by their nicknames.

The EUR/USD pair or popularly – Fiber, accounted for 24% of trades in 2019. which makes it the No. 1 traded pair on the foreign exchange.

The USD/JPY currency pair or Ninja holds second place despite the decrease from 17.8% of forex trades in 2016 to 13.2% in 2019. 

The firm third place is reserved for the GBP/USD pair nicknamed Cable, which has been stable for three years accounting for 9.6% of 2019 transactions. 

The fourth is the Aussie or the AUD/USD pair, which has been almost fixed since 2016 represented 5.4% of all transactions.

The USD/CAD, also known as the Loonie, is the fifth pair and it made up 4.4% of trades in 2019. 

The relation between the American Dollar and the Chinese Renminbi is the penultimate of the seven majors. This USD/CNY pair rose by 0.3% in three years’ time and it represented 4.1% of 2019 forex transactions

The USD/CHF pair nicknamed Swissy comes in last with its 3.6% of forex transactions of 2019 daily trades. 

Demographics

Most forex traders are men in their thirties and forties. Although the numbers fluctuate, divided into age groups – 43.5% of traders are aged 25-34, 41.5% stretches over another decade (35-44 years of age) and 15% are older than 45. Such a large percentage of young people involved in trading forex can be explained by being born as digital natives. They were surrounded by computers, the Internet, tablets, and smartphones from childhood and they are up-close and personal with innovative technology. 

Genderwise, women make a tenth of all traders (or 10.9 % to be exact). Still, they outperform men by 1.8% as they are not prone to risky behaviour, but rather long-term strategies. Speaking of performance, only 15% of all traders make a profit, so 80% quit in just a year or two. Only 1% of traders are able to generate income for more than four consecutive quarters.

A mere 7% have been trading for over a decade and 23% for 4-9 years. That makes new traders a sizable group. 31% are in their first year of trading and another 39% have traded for 1-3 years.  On a day-to-day basis 45% of traders spend up to 2 hours a day dealing with forex, 41% invest 2-6 hours of their time, and 14% devote more than 6 hours to trading. Monthly, 35% of traders make 4-8 trades. 41% of traders make 9-20 trades, an average of 16 trades per month for a profitable trader. Finally, 14% make over 30 trades each month.

As they are driven by their will to succeed over 50% have acquired books, purchased courses, and strategy testers. Their online time is also focused on education and self-betterment and it is split between reading materials and watching trading-related content on one hand and finding advice on social media and forums on the other.

Categories
Forex Market

Investing in China: Opportunity Or the Next Crisis?

In the S. XV, at the time when the so-called Silk Road had its decline, a network of trade routes that from the 1st century B.C. crossed all of Asia to trade goods through territories such as present-day China, Mongolia, Turkey, even Europe, and Africa. At the end of the intermediate period, destination prices were much more inflated than at the beginning, so cheaper maritime alternatives began to emerge. This weekend gave me a chance to reflect a little more on this great country, which also has a great cultural interest.

Is it a good decision for us to invest in China?

We continually hear that China is a superpower and that its growth rates are incredible so that it can overcome the global hegemony that hosts America today. It also has a barbaric population, of which historically the majority has belonged to the lower class but there are more and more middle class with greater capacity for consumption. All this is true but… Is all that shines gold?

Understanding the Chinese Economy: Shadow Banking

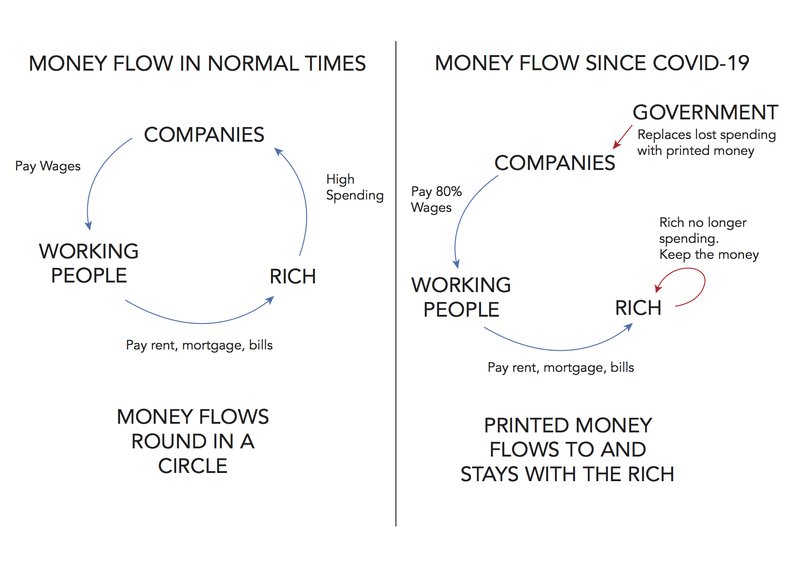
We know that in the Republic of China the Communist Party rules and the Communist Party controls the big banks of the country. These big banks do what the party dictates, so in the end, they are obliged to offer loans to companies and sectors that the party wants to benefit from, and the same but on the contrary, they are forbidden to finance other companies or sectors.

In this context, there are companies that need financing and cannot resort to traditional Chinese banking, so their alternative is to resort to so-called “shadow banking”. Shadow banking (which we will refer to as non-banks) are banks that do not comply with banking regulations. In other words, the requirements are lower than the traditional banking system.

Differences between Shadow banking vs traditional banking

In general, non-banks lack access to central bank funds and other features such as deposit insurance and debt guarantees. These non-banks have fewer leverage constraints so in times of bonanza like these last few years they make more money but are more fragile when problems such as defaults appear.

The current situation in China

China has aggressively stimulated its economy in 2019 Q1 and Q3. Again, it is something that has been repeated in the Q1 of 2020 as a result of the Coronavirus (injecting money and lowering interest rates). They indicate that there is a debt saturation that is close to not being assimilated and that while the debt continues to grow, growth has stagnated.

In 2018, the hole in the Chinese deficit stands at 5%, but considering shadow banking it would rise to 11%. In 2014 it was 1% and 5% respectively. In addition, there is most likely a huge amount of loans that are not being repaid, and that will be a problem on the balance sheet of Chinese banks.

China’s GDP (GDP) is growing less.

China’s GDP is growing less and less, and now along with the impact of the Coronavirus the growth forecasts for 2020, which are forecast to be around 5-6%, are still shrinking further, in any case below the 6.1% that there was in 2019.

The debt of China

Since 2008, China’s GDP debt has doubled, surpassing 300% of GDP in 2019. This trend is not exclusive in China, since high indebtedness is something global, and here in Spain, we are not to shoot rockets either. In addition to this high level of indebtedness and the fact that the granting of financing is not based on criteria of the probability of being able to repay the money but on the interest of the scheme, We still have to add to the equation the probability of distorting the data that comes to us as there is a great deal of mistrust within Chinese audit firms.

All this helps illustrate why there is greater concern about China’s banking system. While it is difficult to have a solid view of China’s true economic strength, there are strong reasons to believe that the country is facing a complicated situation with a highly leveraged banking system full of questionable quality loans and growing defaults. While the media prefer to focus on the figures of Trump and trade, the biggest threat to the Chinese economy may be a massive financial bubble from within.

What if it’s not a big deal and we’re looking at a great investment opportunity?

The truth is that leaving aside Chinese macroeconomic issues, today there are renowned investors who tell us that there are many investment opportunities in Chinese companies and other data that can make us believe that it can be a good investment. For example, last week Charlie Munger commented in his “2020 Daily Journal Annual Meeting” that ” the most reliable and strong companies in the world are based in China and not in America”.

On the other hand, if we look above two large ETFs representing the USA and Chinese market:

And if we make the comparison we see that the average PER of the USA market is at 23.87 and that the average PER of the Chinese market is at 13.14. It is clear that the PER has many limitations and we should not rely too much on this ratio when investing, but it can serve as a little guide to compare markets. Leaving aside all its limitations, this photo comparison of these two ETFs seems to tell us that there is a big valuation difference between China and the USA. Is it possible that the USA is expensive? Or maybe China is cheap?

On the other hand, there are giants like Tencent or Alibaba that seem unstoppable to this day. We will have to continue investigating…

Categories
Forex Market

The Functions of the Financial Market

The role of the financial market in a modern civilized society is enormous. Its aim is to mobilize capital, distribute it among industries, control and maintain the reproduction process and improve the efficiency of the overall economic system.

The main functions of the financial market, performed by its participants, are as follows:

  • Facilitate efficient relationships between all market participants, from individuals and individual investors to large institutional investors.
  • To supervise and regulate the processes carried out in the financial system: regulation of the money supply, control of compliance with the rules established by market participants, licensing, development of legal provisions.
  • Mobilize and allocate capital to be used more efficiently and generate added value.
  • Minimise risks, including fraud prevention (combating money laundering). Ensure transparent prices and avoid price manipulation.
  • Provide liquidity to the market.
  • Guarantee the privacy and transparency of transactions made.
  • Provide necessary information.

Financial market activities are based on the liabilities of national banks to control exchange rates and to set interest rates. Foreign exchange markets and stocks, as well as commercial banks, are directly related to the development of the financial asset market. The stock market is the most interesting segment of the financial market in terms of return on investment.

Financial Market Participants

Each investor is a participant in the financial market in some way. Each of us works somewhere, making our own contribution to the GDP rate, buying something, which indirectly affects inflation and the level of consumer prices. Someone becomes an investor, buys a foreign currency or collectible currencies, or invests in bank deposits, investment companies, using loans.

But still, economic science classifies financial market participants according to their segment. This means that the financial market, simplifying a lot, is a relationship between two categories of participants: buyers and sellers The third category includes intermediaries who are directly involved in transactions, providing assistance, facilitation, and guarantees. The same financial market actor can act simultaneously as the seller, the buyer, and the intermediary.

Foreign Exchange Market

Sellers – The main sellers are the state and the banks. The country that sells a currency does so through authorized agencies and then performs a regulatory function. Sellers may also be companies engaged in foreign economic activity (sale of profits in foreign currency) and individuals.

Buyers – All agents, even sellers, can interact as buyers.

Intermediaries – This category may include commercial banks, bureaux de change, etc.

The Credit Market

Borrowers – They work internationally, borrowers are States, and the ratio of GDP to external debt is considered one of the best statistical indicators of the state of a country’s economy. At the national level, borrowers are businesses and individuals, local governments, etc. A clear example of a multilevel credit market structure is the US mortgage system, where banks issued mortgage securities to accumulate new capital for later loans.

Lenders – These market participants have reserve capital and want to increase it: individuals, investing their funds in deposits that will then be used for loans, buyers of debt securities (insurance, pensions, investment funds). Certainly, any investor can be called a lender, since it gives extra money with the aim of obtaining a percentage that is destined for development. The state can also be called a lender, which creates liquidity and distributes the money to borrowers through the central bank.

Middlemen – They are all involved in the organization of the distribution of money: banks, brokers, concessionaires, investment management companies. Insurance and pension funds can also be attributed to intermediaries, accumulating and distributing capital.

The credit market is closely related to stock and investment markets. For example, corporate bonds are a tool to raise money and security at the same time. Government bonds are one of the favorite investment options with the lowest risk for investment funds.

The Insurance Market

Insurers – These are companies, duly authorized to provide insurance services. There are open-ended insurance companies (they provide services to all market participants), captive insurers (they are owned and controlled by their policyholders), and risk reinsurance companies.

Insured – Individuals, companies, institutions, who purchase insurance services to minimize risks.

Intermediaries – There are no intermediaries, the transactions are made directly between the insurer and the insured.

All markets are closely intertwined. As mentioned above, insurance companies also participate in the investment market. It also includes insurance instruments (for example, several swaps) used by securities market agents.

Investment Market

Every person who invests his capital in a particular asset is an investor. Intermediaries can be banks, stock exchanges, different types of funds, etc.

The Securities Market

Emitters – These include organizations and companies that issue certain securities: shares, bonds, etc. When issuing, issuers agree that they must comply with all specified (agreed) requirements at the time of issuance.

Investors – They are all those who buy securities to generate income. There are strategies (buying a majority stake) and minority (making up a portfolio, buying securities in order to generate revenue only).

Middlemen – Stock exchanges, banks, insurers, rating agencies, auditors, and other participants involved in the organisation of the issue and placement of securities.

The classification described above can be grouped as follows:

The state and central banks (regulatory and supervisory organisations). Managing the largest amount of capital, these agents mainly perform the supervisory and regulatory function.

Regulators (regulatory and supervisory institutions). Establishments that do not participate directly in transactions (that is why they cannot be referred to intermediaries), but perform a control function. The oversight function is also carried out by the central bank and the state government, but it can also be a separate institution, such as a self-regulatory organization (SRO).

Financial services companies (organisations providing services to the financial market and financial intermediaries). We are talking about institutions that are often involved in organisational work: currency exchanges, stocks and raw materials, brokers, insurers, auditors, depositors, registrars, compensation companies, and consulting.

Banks (financial intermediaries). They are intermediaries involved in the distribution of capital, market regulation, and supervision of compliance with established rules.

Legal entities (lenders, investors, borrowers). The largest group of participants: companies dedicated to the placement of clients’ pension savings, investment, insurance, hedge funds, trust management companies, brokers, concessionaires, individual loan organizations, companies involved in any type of financial activity, participating in the return of money.

Natural persons (lenders, borrowers, investors): traders, speculators, individual asset managers, long-term investors, and ordinary persons, as mentioned at the beginning.

Important Financial Market Indicators

As a general rule, experienced traders actively use the economic calendar, which is provided free of charge by the broker. I recommend making this a habit if you haven’t already. Here is a short summary of some of the most important indicators in the economic calendar and tips on how to analyze them:

Interest rate – One of the main economic tools that allow managing the volume of money supply, thus also adjusting inflation. The interest rate grants loans to commercial banks. A higher interest rate increases interest rates on loans and deposits and therefore encourages consumers to invest. This, in turn, reduces the inflation rate. Influence, when the interest rate is raised, is exclusively dependent on the economy of a given country. For developed countries (e.g., the US), a higher interest rate increases the exchange rate of the national currency. In the least developed countries, raising the interest rate can be seen as an attempt to curb stagnation and thus increase investor interest.

Non-agricultural payroll (Non-Farm Payrolls) – Report on changes in the number of jobs in the US non-agricultural sector. It is considered one of the most important reports, but its impact on the dollar price lasts a relatively short time (few hours). Goes public on the first Friday of every month at 12.30 (13.30) GMT. The statistics are based on data from more than 400 households and are published by the US Department of Labor. In theory, the factor that influences the rate of the US dollar will be the deviation of the fact of the forecast by more than 40 thousand. In practice, much depends on accompanying statistics and investor sentiment.

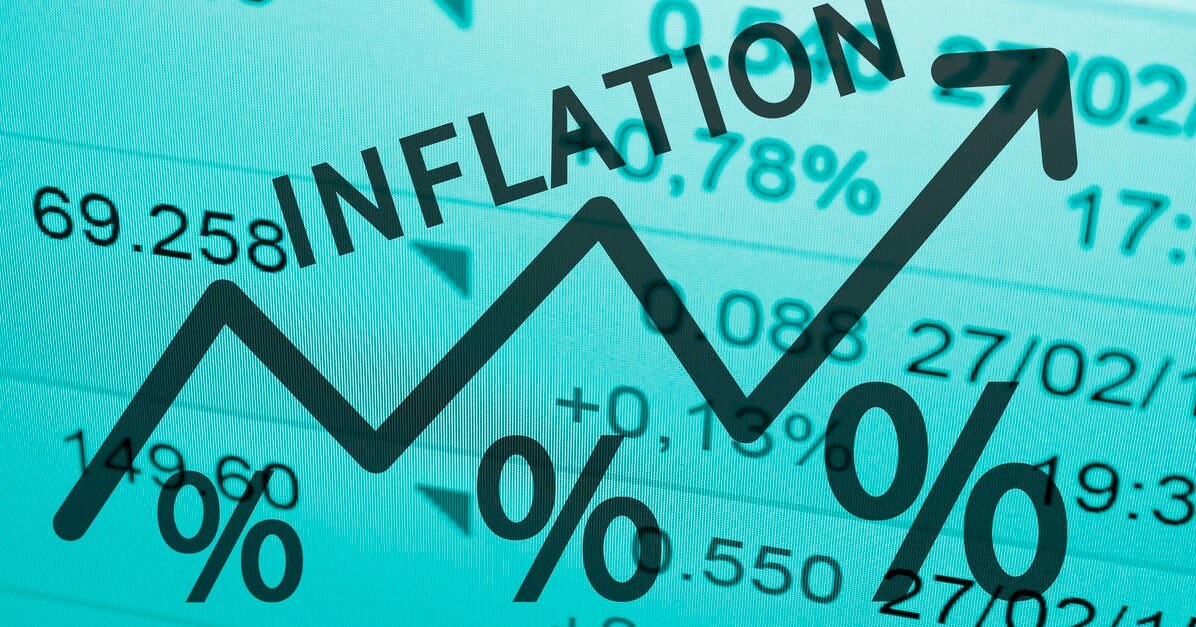
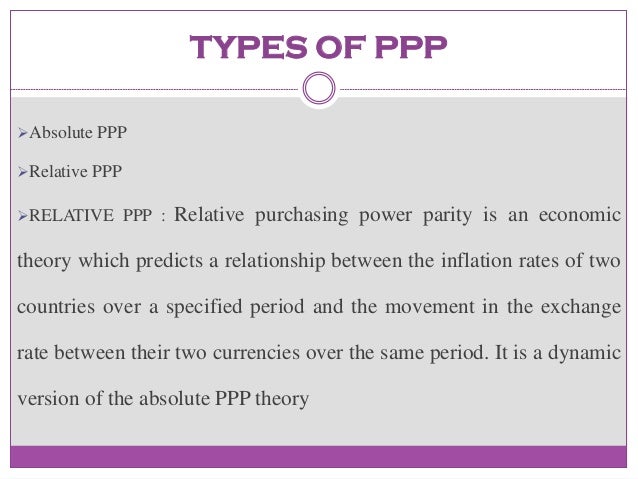
Consumer price index – It is calculated for a specific group of goods and services that are part of the consumption basket of the average resident of the country. The index analysis for the current year is carried out in comparison with the base (baseline). The IMF, EBRD, and the United Nations recommend the statistical basis for the calculation, but there is no single approach, each country has its own calculation peculiarities. The calculation methodology can be based on the price indices of Lowe, Paasche, and Laspeyres. If the index decreases, it means that consumer purchasing power (real demand) also decreases and may partially suggest a higher rate of inflation growth.

With regard to indicators such as GDP, inflation rate, unemployment, I think everything is clear: the better the indicator, the more positive is the feeling of investors in the currency and stock markets.

Important point: the economic calendar is only a complementary information tool and in no way can it serve as the main tool to base trading strategies. At the time of news release, the market is especially volatile, therefore, the calendar is often used upside down to exit trading.

If you are still willing to try to negotiate with the economic calendar, here are some tips:

Compare the actual value with the forecast. If, for example, GDP growth was 2%, given a forecast of 2.5%, it will have a negative influence on the market. Please note that the data can be reviewed.

Evaluate the chances of an event and the expectations of investors. Let’s take an example, if what is anticipated is that the Federal Reserve increase the rate of federal funding at the next meeting, investors will consider it beforehand and will not undergo major changes at the time of the news release.

Compare the importance of news with other factors. For example, if in times of silence, the publication of statistics on US oil reserves has a significant impact on quotes, then during the peak of the US-China trade war, these data were hardly noticed.

Categories
Forex Market

The Impact of Supply and Demand In the Forex Market

To become an expert in the field, any tennis player will have to learn how to yield the racket, move across the court, apply different strategies, and prepare mentally for both wins and losses. They will also need to distinguish between different surfaces and how these affect the style of the game, which is all true for forex traders as well.

The spot forex essentially revolves around currencies, so to answer the question in the title, we first need to acknowledge that it is money that moves this market primarily. Then, after coming up with the definition and its span, we can see the connection between the money we know today and the concept of supply and demand.

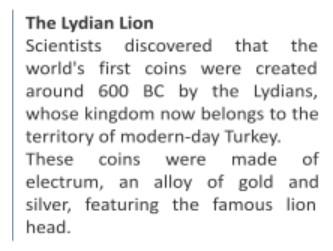
The story of trade started many years before we even had the currencies of today. People would exchange goods for other things they needed. So, they would weigh whether the value of their eggs and flour would equal the materials they needed to sew their clothes for example. The currency of the time was anything people made or obtained from nature.

While the barter system persisted, especially in times of war and crisis, people turned to using commodity money or the money made of copper and silver. When money came into existence, it was still used as a proxy, mimicking this correlation in value between different products and commodities. The laws of monetary exchange date back to the era before Christ, but the early connection between money and hard assets still reverberates to this day.

In the 1800s, countries across the globe adopted the gold standard which meant that every country would have the money in equal proportion to the quantities of hard assets. For example, before the new dollar emerged, the US government used to print gold, silver, and bronze dollars. 

Depending on the power of individual economies, countries had more or fewer commodity reserves and thus money too. However, as most countries left the gold standard in the 20th century, their official currencies were no longer backed by equal amounts of gold and so they lost their intrinsic value. As a result of these changes, the terms supply and demand hold little relevance to the concept of forex trading. Even though we can easily speak of supply and demand in terms of finance and economics, we cannot attach the same meaning to the currency trading market.

We usually describe supply as an available amount of a commodity, product, or service, while demand is defined as the consumers’ desire and readiness to purchase a certain product or service at a particular price. 

In the world of currency trading, whenever a currency pair reaches a certain peak, sellers often find that selling at higher prices could bring more opportunities. Likewise, buyers typically favor purchasing at a lower price each time a given currency pair drops to a lower level. These zones where the prices reach their extreme levels bear a great number of unfilled orders and are, therefore, considered the most fruitful to trade. 

While individuals cannot generate such friction in the market, big companies and institutions have that kind of buying power to create an imbalance between buying and selling orders. Since this affects the entire market, individual traders can witness quick changes in prices, which leave behind many unfilled orders on the supply or the demand level. At this point, the major players normally wait for their orders to get filled after the price returns to the zone.

Nowadays, there is much room for governments and banks to manipulate the circulation of currencies, increasing the overall money supply. Therefore, to trade in this market and have any hope of being successful, we need to invest in financial literacy. As forex traders, we need to know what we are dealing with.

With an increase in money in an economy, consumers demand more goods and this often results in higher prices. However, any changes in sales and prices also affect the forex market. For example, in 2019, the stock market enjoyed a long period of prosperity and unprecedented growth levels which triggered historic lows in the spot forex. These fluctuations of money between the two markets influence the volume in the currency market as well.

In the forex market, we can also trade crosses that involve different commodities such as silver. However, much of the silver that undergoes production is entirely used up afterward. This limited quantity directly affects supply and demand, like in the stock market. 

Even though the price of currencies does not revolve around traders’ willingness to purchase something at a specific price nor its quantity, silver or gold are inherently different from currencies. That is why trading such crosses requires different strategies from what we would normally use in trading currencies.

As supply and demand are not the best terms we could use to define the spot forex market, we can discuss other topics that are more relevant for currencies, such as reserve currencies, general interest in trading specific currency pairs, and the concentration of the majority of traders in one part of the chart at a specific point in time.

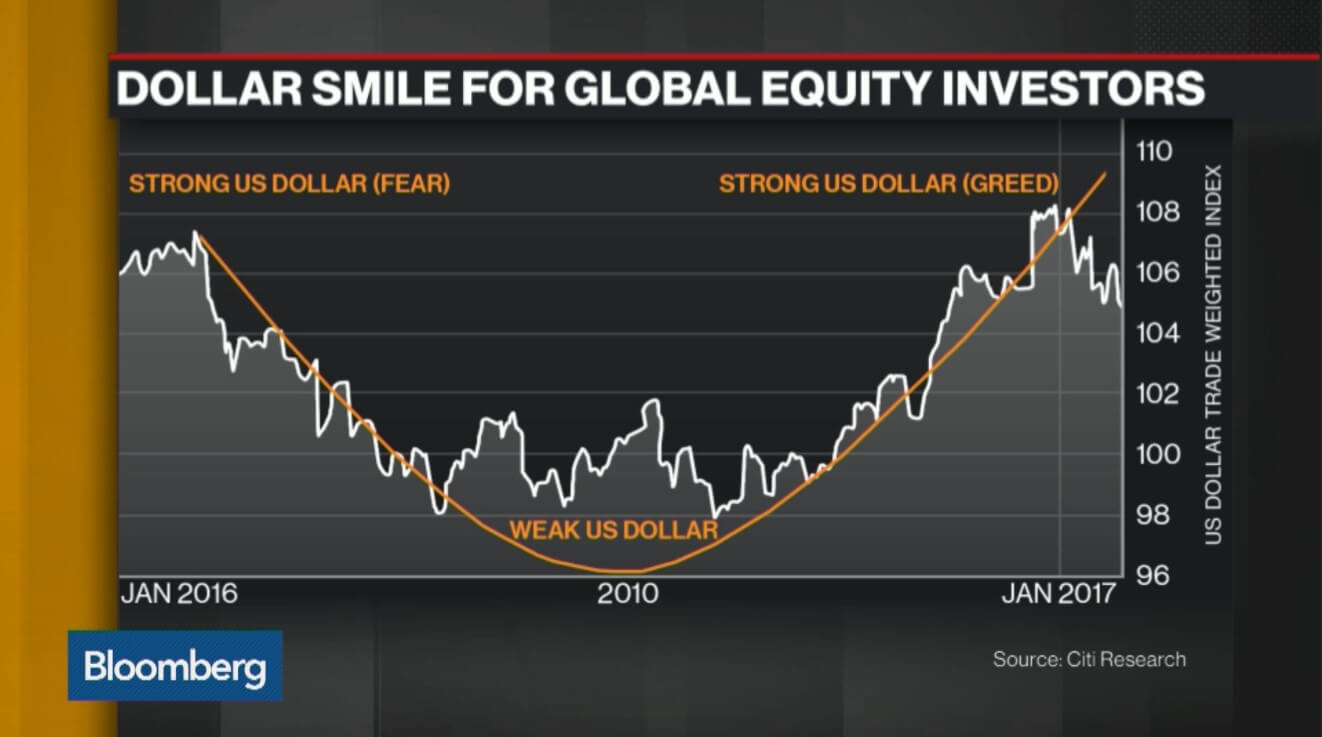
Historically, there have been a few currencies that are considered to be a safe haven. In periods of crisis, governments consider currencies such as the CHF to be the safest options to hold due to the stability of their countries’ central banks and governments. 

Also, the USD is typically one of the most traded currencies in the world, which is why it often attracts the attention of big banks that see the potential from controlling the market with so many participants. 

As we can see, many different factors can influence the forex market, but these do not involve individuals’ demand for specific currencies or the money supply in some markets per se. Rather, it is big banking institutions that cause the prices to fluctuate, along with news events or other geopolitical facts.

As currency traders, we all need to develop systems that allow trading to function regardless of what is happening in the world or the market. Forex is recession-proof, which means that your trading strategies and algorithms extract profits from both, bull and bear markets.

To ensure security against the involvement of big banking institutions, traders should apply money management and risk management skills and avoid currencies more susceptible to outside interferences.

Elections, wars, and economic reports, among others, are certainly good reasons to avoid specific currencies where the market is increasingly prone to “trick” you. We should not aim to beat these influences but rather learn how to avoid them, it is not something we can control. Supply and demand levels in forex are not bound to limits or logic.

Categories
Forex Market

EFTA and Its Relationship to Forex Trading

Did you know that all four EFTA member states enjoy some of the highest price levels of all European countries, supported by high productivity of the workforce, corresponding high salaries, exchange rates, and inflation? In fact, the overall price level in Iceland was 72% higher than the EU 2017 average, while the equivalent figures for Switzerland and Norway were 66 and 52% respectively.

It is an important body that is comprised of highly developed countries with impressive trade figures that operate closely with the European Union, the European Commission, and the European Economic Community. EFTA is the ninth largest merchandise trader and the fifth in services trading in the world. In addition, EFTA is also the third most important trading partner in goods for the EU and the second most important when it comes to services.

What is EFTA?

The European Free Trade Association (EFTA) is an intergovernmental organization of Iceland, Liechtenstein, Norway, and Switzerland that acts as a free trading bloc. As of its establishment in 1960, EFTA’s task has been to promote free trade and economic integration between its member states, within Europe, and globally.

EFTA’s Organizational Structure

EFTA is governed by the EFTA Secretariat, which has offices in Geneva (Switzerland) and Brussels (Belgium). The Secretariat is led by the Secretary-General and three Deputy Secretaries-General, who are appointed by the EFTA Council and shared between the organization’s member states.

The Secretariat is organized in a way that matches EFTA’s activities. The organization’s headquarters in Geneva deals with the management and negotiation of free trade agreements (FTAs) with non-EU countries as well as provides support to the EFTA Council.

In Brussels, the Secretariat provides support for the management of the EEA Agreement and assists the member states in the preparation of new legislation for the integration into the EEA Agreement. The Secretariat also assists the Member States in the elaboration of input to EU decision making.

These two stations work closely together to implement the EFTA Convention’s stipulations on the intra-EFTA Free Trade Area. EFTA’s activities are regulated by the ETFA Surveillance Authority (equivalent to the EU Commission) and the EFTA Court (equivalent to the European Court of Justice). The EFTA States have developed one of the largest networks of FTAs, which today spans over 60 countries and territories, including the EU. 

As of December 2017, the EFTA states have signed 27 FTAs with 38 partners from Eastern and South-Eastern Europe, the Middle East, North and Southern Africa, Asia, and the Americas. These agreements grant preferential access to markets of around 870 million consumers outside the EU.

EEA & EFTA

The European Economic Area (EEA) is an international trading and economic organization that, like EFTA, works closely with the EU. The EEA binds three of the EFTA nations (Norway, Lichtenstein, and Iceland) and the EU member states in a single market. Both EFTA and the EEA allow free trade and cooperation between member states, unencumbered by most of the political obligations and financial implications of EU membership.

Member States

Switzerland is nowadays a world leader in pharmaceuticals, biotechnology, machinery, banking, and insurance. Founded in 1291, Switzerland is located in Western Europe but is still separate from the EU. The country is known for its economic independence and neutrality during wartime. It is a large exporter whose 2019 GDP amounted to approximately 703.08 billion USD. Interestingly enough, the country’s GDB was barely affected by the 2008 global economic crisis. The Swiss franc (CHF), the official currency in Switzerland (and Liechtenstein), ranks fifth among all major currencies, which is directly proportionate to the quantity of money flowing into the country. The CHF is currently believed to be the most tightly linked to the price of gold among all other currencies. Unlike other central banks in the world, the Swiss National Bank (SNB) is a public limited company and a for-profit type of institution like JP Morgan. It appears that overall economic numbers do not impact the CHF substantially unlike some other currencies, as it barely ever reacts to the news. Some of the most liquid pairs are the USD/CHF and EUR/CHF.

Liechtenstein is a German-speaking principality between Austria and Switzerland founded in 1719. Like Switzerland, the country is a highly industrialized and specialized free-enterprise economy with a vital financial services sector and one of the highest per capita income levels in the world, despite its small size and lack of natural resources. The country participates in a customs union with Switzerland and uses the CHF as its national currency. Interestingly enough, Liechtenstein imports more than 90% of its energy requirements. Liechtenstein has been a member of the EEA since May 1995. With a strong manufacturing sector, the country’s industry accounts for 46.6% of its GDP.

Iceland, a Nordic island nation, was founded in 1944. The country benefits from renewable natural resources (fishing primarily) but also enjoys the diversification into other industries and services. Iceland’s economy is highly export-driven and most of its exports go into the EFTA and EU member states. The country’s relatively liberal trading policy has been strengthened by its 1993 accession to the EEA. Still, its economy entirely collapsed after the 2008 economic crisis. The exchange rate of the Icelandic krona (ISK) is determined in the foreign exchange market. After a pause of 10 years, the European Central Bank (ECB) again enlisted the ISK among the currencies on which it provides a daily quote. Swings in global commodity prices – fish, aluminum, iron – can easily drive the value of the ISK up or down. This “free-floating” currency is traded without restrictions on global foreign exchange markets but is still perceived as one of the more volatile currencies. Its small central bank with limited foreign exchange reserves struggles to control the value of its official currency in the face of trends on forex markets that are driven by much bigger financial players.

Norway, one of the wealthiest countries in the world established in 1814, is highly abundant in natural resources, which also significantly contribute to its economic strength. Oil and gas exploration and production, fisheries, and important service sectors (e.g. maritime transport and energy-related services) also greatly support the country’s economy, which is why it has such a high GDP (403.34 billion USD in 2019). The Norwegian krone (NOK) is believed to be an alternative to other safe-haven currencies (e.g. the CHF) and is traded frequently against the USD. Still, it can be quite a risky choice owing to the strong correlation with shifts in oil prices.

EFTA & Forex

Although expanding internationally can be an exciting opportunity for growth, an international business raises a unique set of challenges. Political and regulatory uncertainty, severe competition, and currency volatility are just some of the risks.

Trading agreements are among the most powerful tools to stimulate commerce. Smaller nations, in particular, look forward to joining trade agreements as a means to access larger markets, which is made possible through the elimination of tariffs, quotas, and other restrictions.

Governments can allow foreign firms to sell their products more competitively, ultimately driving costs down for consumers, by eliminating the special taxes applied to imported goods. Businesses also utilize currency transfer services to mitigate foreign exchange risk.

Owing to specific incentives provided by trade agreements, trade volume increases, flooding the economy with more money. Moreover, with an increase in money in an economy, consumers demand more goods and this often results in higher prices.

However, any changes in sales and prices also affect the forex market. For example, in 2019, the stock market enjoyed a long period of prosperity and unprecedented growth levels which triggered historic lows in the spot forex. These fluctuations of money between different markets influence the volume in the currency market as well, which is why the EFTA is also important for forex traders.

Categories
Forex Market

Will Forex Trading Ever Be Shut Down Completely?

Given some of the changes in recent years over Forex trading laws, it is understandable to understand why traders may be concerned. Many countries have imposed very harsh restrictions on the industry and, of course, some are concerned that this may mark a possible end to Forex. The currency market can be huge, but many industries have become obsolete and extinct as well. For a Forex trader who lives professionally in this industry or wants to have a future trading currency, it is worth considering all these changes and how they may affect you.

Of all the financial markets, the Forex market is the largest in terms of liquidity.

According to the Bank for International Settlements -BIS, forex achieved an average daily turnover of $5.1 trillion in 2016.

Remember that this was the moment when several foreign exchange brokers went bankrupt following the decision of the Swiss National Bank’s (SNB) to remove the Swiss franc from the euro. The impact of this momentous decision was catastrophic and immediate. Within minutes, the franc rose by 30% against the euro and other major currencies, causing huge losses to anyone occupying short positions in the franc. Even brokers with excellent opinions declared bankruptcy.

The consequences of the decision were felt throughout the rest of 2015, reducing daily turnover in the market. Most likely, this drop in trading volume until 2015 contributed to the decrease in the average daily trading volume in the Forex market from the previous record of US$5.5 trillion in 2013. Since then, the Forex industry has continued to suffer and therefore hope of a resurgence is diminishing. After the events of 2015, the Forex market recovered somewhat until ESMA announced its plan to change its regulations in 2016.

MiFID-regulated Forex brokers began to feel the pressure even before the MiFID II regulations came into force in January 2018. As early as 2017, UK and EU brokers were already seeing a decline in revenue. Meanwhile, brokers elsewhere, such as Australia, have reported an increase in European customers throughout 2018. This shows that many customers left Europe-regulated brokers to obtain better conditions elsewhere. As a result, these brokers began to enjoy better profit margins and customer bases compared to their European counterparts.

Today, many currency brokers are losing money after European regulators began to impose stricter laws on the industry. The story is the same with all European brokers, who have been forced to reevaluate their business models or face their demise.

In addition to changes in regulation, volatility has also been very low in foreign exchange markets. The BIS reported that the volume of retail trade in 2018 was US$1.104 trillion, while that of 2017 was US$1.672 trillion, a drop of 34%. Thus, there was much less trade in the Forex market in 2018.

Volatility in 2018 was lower as the ECB announced that it would not raise interest rates throughout the year, which would reduce the volatility of the euro. The ECB has been forced to keep its interest rates low after the IMF lowered its economic growth forecast. Add to this the talks about Brexit, trade wars and elections in different European countries, which probably means this won’t change soon.

Those traders who know these facts are very concerned that the foreign exchange market is in a difficult situation. It is quite likely that the main cause of the problem was the changes in regulation. Volatility is known to diminish, but laws are very difficult to reverse once they are active. For this reason, we must debate these laws in depth that have had a disastrous effect and why the authorities came to think they were such a good idea.

Changes in Forex trading laws

The real wake-up call came in 2008 because of the financial crisis, when regulators knew they could no longer rely on the financial companies’ own mechanisms. Japan was the first country to put limits on leverage. As of August 2010, leverage was limited to 50:1 and then reduced to 25:1 as of August 2011. The US of America followed similarly by reducing leverage to a maximum of 50:1 and 20:1 for major and minor/exotic pairs respectively. In both countries, the foreign exchange market declined significantly due to leverage caps and large capital requirements that were set as necessary for retail traders to participate. Japan is also considering another reduction in leverage to just 10:1, but this law has not yet passed.

The European authorities also knew that they could not allow financial institutions to express themselves either, but their response was slower and more measured, but just as devastating. The new Forex regulations were first proposed in 2014 and came into force in 2018 encapsulated under the MiFID II name. After US regulatory changes, the EU had become the next best option for brokers and traders alike, but no longer. ESMA set a leverage limit of 30:1 for major currency pairs, as the GBP/USD live charts and 20:1 for non-main pairs. That was even less than leverage in the United States…

How the new regulations have affected the industry?

As expected, restrictive regulations have slowed down the industry’s performance and revenue. ESMA hopes that by making the laws tough, new traders will refrain from trading and thus will not lose their capital. However, these traders mostly made the decision to trade with CFD brokers in other foreign countries abroad that had and offered better trading conditions. These brokers are often less secure to deal with as regulation in offshore countries is not as strict as that in Europe. To avoid the loss of customers, it has also been noted that European brokers ask their customers to register with their non-EU entities if they want better conditions.

Does this indicate the end of an era?

If history repeats (as it usually does), current levels of low volatility can be a sign that something dramatic is about to happen. This means that of course Forex is not about to end, but is at the dawn of a new era. In fact, this should be the time when traders take advantage of markets to make huge record-breaking gains.

In addition, there may be other causes that contribute to the low levels of volatility we are seeing at the moment, apart from changes in regulation. The growing tension between the US and China may be aggravating the problems existing in the market, as traders and investors in general are waiting to check what you finally happens. Whatever way the two superpowers decide to go, it will have a huge impact on markets and present wonderful business opportunities. In general, no one likes to risk capital when markets are volatile and unpredictable, which is our current situation. Once things fall, markets are likely to resume their previous volatility levels.

What will be the near future of the Forex market?

At some level, it seems all this even an attack on the industry and regulators want to set limits on markets, as many as possible to retail traders, but this is not the case.

The Forex market will definitely be very different in a few years. It may be almost impossible to create a centralized market for Forex operations, but there may be a dynamic for brokers to report all their transactions on time in the future. MiFID II has already proposed several ways to do this, and it is not unlikely to do so.

In fact, the Forex market today looks a bit like the old stock market, where the market was threatened by “bucket shops”. At the time, stock trading was very risky because there was no simple way to convey orders to the stock exchange, but this problem was solved by technological advances. Therefore, it is not so difficult to imagine a newer technology that unifies the Forex market and makes it centralized.

Categories
Forex Market

Where Forex is Headed Over the Next 5 Years?

This is one of the most common questions people are asking the experts. Luckily no one knows for sure, otherwise, forex would not be very interesting. Predictions are not a good trade, people get it wrong most of the time. Still, if we collect some facts about the market now, one might get it right. You have to ask yourself though, would you make a decision based on a prediction that is more likely to fail? 

Forex Traders’ Way

If you ask a forex trader what will happen in 5 years, get ready for a disappointing answer. They do not know, and they do not care really. Traders know better. They have their strategies and systems that say some asset is probably going this way. but not for the next 5 years. Traders do their thing intraday, daily, and on a weekly timeframe at most. There are simply too many events that could interfere with some asset. At the end of the day, it does not matter what will happen in 5 years as long as they play the long game and play your strategy to the letter. It is how they have their share of profits.

Prediction Problems

The further we go into the future, the less predictable the outcomes are. To cover for this uncertainty, predictions get more broad or vague. If we say the bitcoin price at the end of 2025 is going to be $142500, would you bet on it? A mathematical model might give you this precise result but we all know it is a 99.99 (and then more nines)% miss. So we blend and say it is going to be higher than today. All this is based on some fundamentals, the rising crypto market, people-orientation to savings, pandemic, and so on. But no one knows if governments are going to ban crypto as the market gets bigger, we all know they do not like it.

On the other side, who knows it is the bitcoin that will perform the best out of all other, more advanced cryptocurrency concepts? Predictions are fun to listen to, but common sense says let’s spend our time finding or creating information that we can use today. 

Foretellers Way

There is a way you can use such predictions and make money, a lot of it. It is nothing new, get ready… TV. How many times have you watched smart people on popular TV news channels predicting and reasoning? Listening to them will probably set you on the losers’ side. These people have skills in analysis and presentation, but they are not good when it is trading time. To quote Ray Dalio from his “Principles” masterpiece “Truth be known, forecasts aren’t worth very much, and most people who make them don’t make money on the markets.” They make money by producing fun predictions people like to listen to, not to mention the media. 

Investors’ Way

Now let’s get to the fun part, how investors think and adjust to the fundamentals. Fundamentals play a key role obviously in how they make predictions. They do not go too far into the future, up to a year at most. We are not talking about the buy and hold forever saving strategies here of course, but analyze the state we are now at the end of 2020. Forex is interconnected with other markets, major players are the banks, governments, companies, and sometimes viruses. It is said COVID-19 just deepened the problems already present in the global economy. 

Present Time Directions

Here is a snapshot of how the currencies performed during this year:

US dollar became a questionable safe-haven for many reasons, the major one is the FED decisions and printing. The stimulus is evergrowing, however, little budge is seen in the economy fundamental measurements. 

If we speak about safe heavens, precious metals are not really in the focus. According to research, gold is about to boom in 2021, and likely to continue in the next years as the economy gets back on its feet. Aside from the supply and demand stats all pointing to a long-term bullish sentiment that stretches beyond 5-year prediction, gold is not on the big scene yet. Consequently, the US dollar is not the currency to hold in 2021 and probably not in 2022. Japanese Yen or even Euro is a safer asset at the moment, likely to strengthen their value in the coming years. 

Now, the pumping is not stopping. Today we have a record high equities level, despite the bad fundamental results with employment, spending, and general activity indicators. Something is definitely wrong with this chart:

The massive printing and stimulus policies are producing a scary storm below this peak, and as the forex market is a part of the global capital flows, equity correlated AUD and NZD might follow the ride down in 2021. Despite all this turbulence, forex hasn’t shown the turbulence a trend trader would like to see. Looking at the Euro VIX ($EVZ), the 2019 and partly 2020 are still calm for forex:

The reason behind this is the overall drop in economic activity, there is no spending or rushing to safe heavens, even though the bullish pressure is rising on the elemental values as stated above. 

We have another market to consider too, the crypto market that is taking its share of the money flow. Even though this is below a $trillion market, small compared to the enormous precious metals or forex, it is increasingly attractive to young, open-minded investors. It is regarded as a safe haven area since the DeFi concept sets crypto out of the crisis danger zone. 

They Know and Decide When

So, you have very good prediction info, and guess what, majors players know them too, and some more. Everything says there is something fundamentally wrong with the charts, they are not following the real world. Well, it is not because the big banks, governments, and other big figures decide when it is time to let go. The moment they are ready to let the storm out, they would try their best to knock (stop loss) every forex or equities trader out of their positions. A common chart pattern is an unusually large price move before it starts to strongly reverse. This move happened with the gold right before the pandemic unleashed and the bull trend base in March 2020.

Forex and other markets are not free out of control and there is no way around it. It is regarded cryptocurrency market is not in the same boat but rest assured governments have control over how this market will develop. Interestingly, more and more major companies will compete to set the ladder with their dominant currency. Facebook is one example of the Libra. Investors and companies increasingly consider crypto assets as the offset instead of the USD or other major. 

Investors’ Patience

The average guy listening to this is not really going to understand, but he might like the „conspiracy“ side of it. Investors know how the FED and the big banks think, the play hasn’t changed yet. History is repeating and so-called smart money stands by. Reversal positioning is not their play. Investors wait out for the sudden shakeout and wait for the market to settle in direction. The pause could be a week or two before they move in. They did not long the EUR/USD before 2020 US elections results, only after the USD started to weaken after the charts show it is time and the fundamentals are still in line with the prediction. 

Traders all deal with the prediction, with technicals and fundamental analysis. They protect their wealth with risk and money management. Prediction is actually what we do, but all professionals have a sound and consistent way of doing it. The title question is out of their scope as the answer will not be of any use to them. 

Categories
Forex Market

Is Volume Enough to Beat the Big Banks?

Traders hoping to become successful at forex constantly strive to improve their trading skills and, even more so, the variety of indicators that they use in trading. While the list of indicators is difficult to number precisely, forex enthusiasts often look for indicators in the hope of acquiring specific information. Volume, one of such important aspects of the forex trading experience, does not only pose as a relevant but also necessary item of information that gives traders a green light to enter a trade. Although volume indicators are many and are generally assumed to be a crucial part of each trader’s algorithm, this variety leaves much room for equally varying degrees of success. Naturally, in connection with this topic, the question of whether we can use indicators such as the Depth of Market or the DOM indicator to obtain more information about the overall market activity and be ahead of the big banks comes along.

DOM Indicator

DOM is popularly described as a very potent indicator that has been promised to provide traders with the potential to stay on top of the competition, which explains the high search frequency for this topic on Google. While still part of the MT4, this tool is located outside the common list of indicators and can be accessed by pressing ALT+B or clicking right and scrolling down. With regard to its performance, simply put, this indicator gives traders insight into the price levels with the heaviest volume. All the information DOM presents traders with stems from the brokers’ data that understand exactly where the clients’ orders are at any given moment. However, while sharing this information with others, the question of whether this allows us to trade like the big banks, or in other words have equal power, still remains unanswered.

Any trader interested in accessing the information discussed above can easily discover a price level with an abnormal amount of volume with the help of DOM, which can indeed seem quite appealing to anyone aspiring to become a successful and affluent trader in the forex market. Nonetheless, issues arise once we become aware of the fact that any dealing desk broker’s information is limited to levels and does not stand for the overall volume. Therefore, if a trader is interested in gaining an understanding of the volume and how the market is going to respond to any strange concentration at any point in time, this indicator already seems to be falling behind its promised ability.

Whereas many traders use DOM to enter trades, as a simplified version of such tools, this indicator also fails to do everything else a trader should expect from a fully functioning indicator. If we take into consideration the facts that traders need indicators for three purposes – to tell them whether they should go long or short, to help them with money management, and to assess if there is sufficient volume, to begin with, it becomes apparent that DOM is far behind satisfying all criteria that any trader should hold on to while using indicators. What this further entails is that not only the indicator in question cannot perform well but that volume alone makes only one of many relevant data that makes us feel assured that we can proceed with the trade. 

Trade Volume

When one is looking into the volume at any point in time, he/she should also be aware of the fact that seeing the list of the prices is not indicative of the overall volume. For example, a dealing desk broker such as Oanda will even fail to do as much because the only item of knowledge one actually acquires, in this case, is the numbers, which are highly unreliable and insufficient for determining the direction of a price. Even if traders choose to use other indicators to access volume-related information, they in fact still never acquire the data on the long-term volume, which directly questions the sustainability of any given currency pair one may be interested in. Therefore, the only tool that can grant this type of information that goes beyond current values is an actual volume/ volatility indicator as DOM simply is not of much use in this respect.

In order to understand any given information concerning volume, traders need to learn how to read the numbers they are presented with. For example, should a trader see that the DOM indicator reveals a price that is several pips higher, he/she still cannot fully trust the indicator or what numbers it is giving. Such feeling originates from the fact that some of the crucial questions are still looking for an answer, as we do not truly know anything about the type of orders that comprise this volume, whether they are limit or stop orders, or if the majority is entering long or short trades at the time. The missing information is much required as qualitative support owing to the fact that numbers alone have no meaning unless we are able to interpret them meaningfully.

Long and Short Trades

Traders should also be invested in discovering the predominant percentage of long and short trades because it will help them determine the correlation between volume and the types of trades forex traders are typically entering at the time. In addition, only once they get hold of such information will they be able to tell if the big banks will react at all because the main requirement for their involvement is precisely the impact volume has on the above-mentioned percentage. Unfortunately, the DOM indicator is unable to provide the data required and traders will never be able to tell the quantity of long and short trades or the price level above or below either, which makes the use of this indicator increasingly futile. 

Aside from understanding volume, its relevance in trading and the type of information traders need to possess so as to expect any success in forex, trading should generally not be intended to beat the traders’ greatest competition – the big banks. The reason for this remark lies in the understanding that the majority of traders attempt to do exactly what the big banks are doing and such an approach is exactly what makes so many traders lose most trades and accounts. The role of the big banks has always been clear and attempting to outsmart the one entity with more information than anyone else in the forex market possesses at any given time is a sure way to experience great losses. Hence, in order to beat the competition, you should learn how to use and interpret the information you come by rather than strive to be in the midst of the greatest concentration of activity in the chart.

Understanding Market Activity

The focus on the numbers has, as we explained above, never been the best of allies simply because we do not really understand the activity even when we can see that the concentration is extremely high. There is a number of indicators that can provide the same types of information, yet they lack the key ingredient to really be of any use. Interestingly enough, much of such data actually reflects past activity, which can only confuse you and blur your vision with regard to future activity. Therefore, the ability to see heavy trading does not reflect true volume nor does it indicate any future development. The sole reliance on indicators in the hope of them fulfilling all our intentions, goals, and needs is not going to lead to sustainable success and the same can be said about the reliance on volume alone.

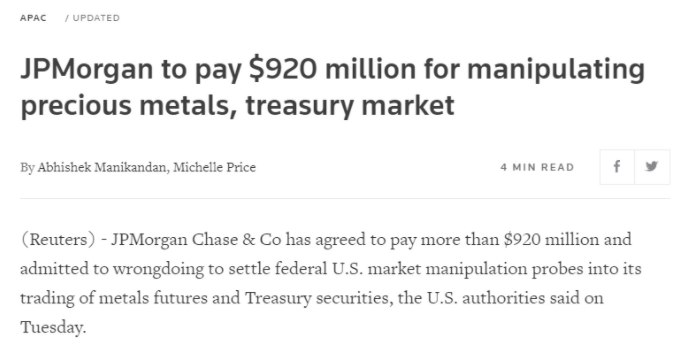
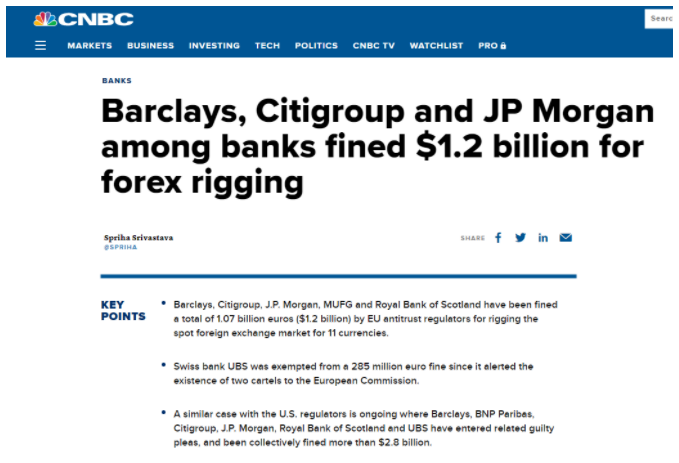
Many traders are passionate about beating the competition when, in fact, their greatest opponent is their own lack of knowledge or understanding. In the forex market, we can say that everyone is fighting their own battle, so we cannot really discuss competition as we can do in the world of sports. Fighting against the big banks in the literal sense has been proven to be in vain, but understanding how to rise above their radar and focus of attention is most likely to bring you to where you want to go.

In order to achieve the expertise of not falling in the majority group, both in terms of the concentration in the chart and the number of people losing, traders must learn to take the road less traveled and attempt to take a different approach. As the use of one indicator alone, focus on one aspect such as volume, reliance on numbers alone, and hope to outsmart the big banks all seem to be inadequate, traders can turn to some other highly effective activities that have a much greater chance of helping them succeed long-term. The intention to grow and ensure sustainable development by far outperforms any quick fixes the majority of traders are interested in, which is why indicators such as DOM are so often used and why so many traders keep making the same mistakes.

Instead of putting all of your eggs in one basket, strive to dive deep into the psychology of trading, understanding why you keep experiencing losses and invest in money management so that you are a stable and balanced trader first and foremost, and the success will follow. Traders commonly assume that their careers should reach a peak the moment they come up with an algorithm, but the reason they still fail lies in the lack of understanding that some criteria are far more important than using the right tools.

Challenging Traditional Beliefs

Another important piece of information regarding the volume is that traders always believe that the higher the volume, the greater the success. Nonetheless, low volume, which is a usual part of the natural oscillations in the forex market, can allow traders to learn about the nature of the market and invest in testing their systems. Human beings can get extremely greedy, but forex requires a different perspective from its participants who are intent on reaching the expert level. In that respect, the greatest goal is not only to gain wins but also to mitigate losses and the same broad perspective can allow traders to see outside the narrow world of perfect tools and quick solutions.

And, finally, to return to the title of this article Is Volume Enough to beat the Big Banks?, traders should by now see through this the ideology and beliefs forming the basis of this question. Neither volume nor a volume indicator can be said to be the sole savior in the battle, especially when the battle is similar to that of Don Quixote. What you as an aspiring forex trader can do is learn to interpret the numbers you obtain and work on yourself as an individual, and any desired success will surely stem from these fruitful and sustainable decisions. 

Categories
Forex Market

Are the Markets Ever Actually Wrong? (Hint, It’s Possible)

Price is everything. By observing the pound rally in October, you involuntarily begin to believe in the principles of technical analysis. You’d have to be a medium to understand what Boris Johnson was talking about during his visits to Brussels and Dublin. The talks were not in vain. Referred to as, “tunnel negotiations” they took place behind closed doors and there was hardly any hope of being able to observe the light at the end of the tunnel. However, even extrasensory powers do not guarantee that you become a rich man. Mediums could be the most honest people: the reason is that they never use their powers to win the lottery or win money on Forex.

If he stays too long by the river, sooner or later he’ll be fired. After a series of painful defeats and accusations of having exceeded their authorities, people generally fall into a stupor. But not the current head of Britain’s Cabinet. The idea of becoming the shortest prime minister in the entire history of the United Kingdom was not very seductive. Johnson knew: either you control the situation or the situation will end up controlling you. Critics, especially the most spiteful,  will always get the same answer from him:

– Boris, I think you’re wrong…

– Count again!

Led to a corner, the prime minister found a legal vacuum and common ground with Brussels. True, the game is not won right now, but your position is much better now. Johnson will find it difficult to get a majority in Parliament, as DUP is against the deal as it stands and Labour thinks it is even worse than the Theresa May deal. However, nothing seems impossible for the current prime minister. If he manages to get Britain out of the EU, he will take his place in history:

– Boris, will you accept apologies?

– No, just cash.

Looking at the pound chart, you don’t need to read the news. Its recovery was a clear sign of progress in the Brexit talks and its setback showed that investors were upset about something. They have been discussing the extension of the transitional period and the second referendum where the text of the current agreement with the EU can be presented. The British already tried to divorce the EU in 2016, why shouldn’t they bring the question to a successful end? It’s like in the river in winter. The thinner the ice, the more people want to make sure it’s strong enough.

Donald Trump is also confident that the markets know more than anyone else. The President of the United States knows with certainty that it is a small world. All because of the Chinese! He is talking about progress in US-China relations and is always full of optimism not to accidentally launch the S&P 500 correction. Trump believes the White House needs a strong economy and a strong stock market, while setbacks could make your risk of losing the elections held this 2020 more likely.

So does price really take everything into account? Shouldn’t we read the news and dwell on the peculiarities of fundamental analysis? Should we just look at the graph? If everything were that easy, mediums would make a lot of money on Forex. Certainly, history knows too many examples of the times when markets were wrong. For example, they predicted a recession in the US economy in 10 cases out of 5. Trading is not easy, but it is a very interesting activity!

Categories
Forex Market

Five Ways to Survive and Thrive in Extreme Volatility

Market volatility can be both a blessing and a curse, Many traders out there trade only in the most volatile of conditions, while others get hit pretty hard when it takes them by surprise. The volatility of the markets at what give us our profits as well as our losses, so it is important that we have an understanding of how to control our trading during times of volatility and also how to potentially predict it to help us get through it with as little damage as possible. Volatility has caused a lot of accounts to blow in the past and it will cause a lot more to in the future to, so that is why we are going to look at different ways that you can help prevent it from happening to you.

Limiting Trade Sizes

The first thing that you can do to help protect yourself and your account during these volatile times is to limit your trade sizes. The larger your trades are the more danger you will be putting yourself in. During extreme volatility, the markets can jump up and down in pretty large chunks. This is something that can be pretty deadly when it comes to an account that is using larger trade sizes. So in order to combat this, we need to ensure that we are either using the appropriate trade sizes for our account or if we often use larger ones, to try and reduce them during these times. This will then prevent any larger losses should the markets jump in the opposite direction. It will, of course, reduce any profits should go the right way, but during these extreme times, it is important that you protect your account above all else.

Sit Back and Watch

Sometimes you just need to step back and watch. The markets can be a dangerous place to trade, and knowing when things might be a little too much can be a great trait to have as a trader. Not every situation will merit a trade. In fact, when times are really extreme, it can often be better to simply not trade at all. Why risk what you currently have in order to make a bit more when the conditions are so volatile? Protect what you currently have and sit out the markets this time. You will have plenty of time to make some more profits once things have settled down again. You also need to consider that your trading plan probably didn’t take these extreme conditions into consideration, so you will be kind of trading blind, which is an increased risk in and of itself.

Always Use Stop Losses

When it comes to managing risks, ensuring that you have stop losses in place is vital. You should be using stop losses anyway, as this is an integral part of trading. If you aren’t using them, then you are trading wrong and are putting your account at risk with every single trade. This risk is multiplied tenfold when it comes to volatile conditions. If you are going to be trading during these conditions then you have to have them in place and you have to have them with every single trade that you place. I know we are repeating things, but you should not be placing any trades without a stop loss being in place. Protect your account before you think about making any additional profits.

Monitor the News

Monitor the news. Often, during times of extreme volatility, there is a real-world event that is causing it. This could be something like an economic news release, or it could be a disaster such as an earthquake somewhere in the world. Whatever it is, there will be news about it, and being on top of this and understanding what is going on can give you a big advantage. Normally when there is a lot of volatility, people are jumping in trying to make a quick profit, not really knowing or understanding why the markets are behaving the way that they are. This can be used to your advantage. By understanding what is happening, you are also able to gauge when the sentiment may change, allowing you to trade in that direction and profiting from people trading the current movement. Of course, this comes with risks and you may be potentially trading against the trend. The markets do not always react the way that you would expect, but it can be an advantage to understand what is happening with the news nonetheless.

Diversify Your Portfolio

Something that you probably would have been told at some point is to diversify your portfolio. When it comes to trading forex, this would simply mean that you are trading more than one currency pair. This is a way of helping to protect your account as you are not putting all of your money on a single trade or currency pair. Volatility can of course affect all markets, but it can also be concentrated on certain currencies, meaning that while one pair may be going a little crazy, some of the others may be more stable. This could then mean that you are unable to trade the less volatile pairs while the volatile ones are doing their thing, or it could mean that you can counter some of the risks of the volatile pairs with trades on the more stable ones. Either way, it is good practice to ensure that you are diversifying your portfolio and expanding into more than just the single currency pair.

So those are five of the things that you can do to help you survive the markets when they are going a little crazy with volatility. There are other things that you can do, and your own style of trading will help you to get through it and to better understand what it is that you need to do in order to prevent the risks, but the five things we have mentioned are a good start and are generally relatable for everyone. We wish you the best of luck once the markets start picking up their volatility levels!

Categories
Forex Market

What Is the 70/20 Rule in Forex?

Experts believe that 70 percent of market movements occur only during 20 percent of all time. What does the trader need to know about this to maximize the performance of their trades? Have you ever noticed that sometimes when you open a position and enter the market, it seems to freeze? Or, for example, do you sometimes open your trading platform and note with frustration that the price does not move in the next few hours?

How Do I Catch the Big Market Moves? 

To answer this question, you must first know why these moves even happen. If you have ever asked this question the answer is found in the simple 70/20 Rule. According to experts, almost 70 percent of market movements are manifested in only 20 percent of the time. In other words, large movements do not occur all the time, only at very specific times. Therefore, the trader is not required to sit all day watching the market to take advantage of them. This principle has a very significant implication in Forex trading. Therefore, it is important for currency traders to be aware of how they can apply the 70/20 rule.

Observe the Market at a Specific Time

Take a little time and think about it. If 70 percent of the market movements in the FX occur only 20 percent of the time, then you don’t need to look at the graphs all day. This implies the following: in case a trader wants to capture the widest range of movements of a currency pair, he only needs to concentrate on the market for a specific period of time. That said, you will need to see the main sessions of the Forex market in case you want to do day trading. In fact, some of the sessions bring much more volatility. In addition, they are more likely to generate large market movements.

Price trends may change in different time frames. The first implication of Rule 70/20 is related to day trading operators. However, there is something about this rule that should be known to swing traders. By analyzing a price chart with a high time frame, swing traders can often spot a clear trend. However, a particular time frame trend does not imply that the price will continue to move in the same direction in lower time frames.

Only large movements take place 20 percent of the time in one direction. Because of that, the trader must make sure to enter the market at the right time. To do this in a proper way, you may want to use multiple time frame analysis. This can help you understand where the market is most likely to increase movements. In addition, it can help you capture those changes in the overall market outlook.

Entering the Market At the Right Time

However, the key here is to enter the market in the right place. For example, if we enter one of the limits of a price range, we may suffer an unpleasant surprise and get stuck on the wrong side of the start of a new trend. This is because instead of bouncing in the upper or lower limit of the range, the price can break that range in the opposite direction to our operation and initiate a trend movement. Although many times the breakdowns of ranks are false and the price ends up being returned, this is not always the case, hence one must be careful.

The 70/20 rule should decrease the pressure felt by many traders who believe they should be in front of a screen throughout the day. Well applied, it captures most of the market movements in a small period of time.

An important point is that the trader should make sure not to open a trade in a shorter time frame solely based on a trend in a longer time frame. The location of your entrance matters more than you think.

Categories
Forex Market

The Inflation That Will Never Really Come

The sole objective of the entire Keynesian economy is to generate inflation. That is what the Keynesian shamans call economic growth, inflation. People often don’t understand what inflation means or why it exists and that makes them fall for the generally false belief that inflation makes debts evaporate.

This is a crucial point where your incorrect analysis leads to a completely erroneous vision and predictions. I will try to clarify this fundamental error because although it is a rather abstruse and technical matter, it is essential to understand it because on this depends everything that is happening and everything that is going to happen.

The fundamental error comes from blind faith in the power of shamans: the shaman, in the fanciful world of Keynesians, can cause rain whenever he wishes and, therefore, whether it is raining or not, or whether it will rain tomorrow depends only on a certain correlation of political forces between a certain group of pro-rain shamans and another group of anti-rain shamans. If it doesn’t rain, it is because for now, the anti-rain shamans are resisting the pressures they are subjected to by those who want it to rain.

The fact that the yen’s monetary economy has been crushed for 20 years by powerful deflationary forces, incapable of generating any inflation, should, according to the Keynesians, in the face of the group of pro-inflationary shamans, supporters of pressing the red button labeled “INFLATION” There would be certain very powerful groups that have been opposing the push of that button. The problem with this explanation between mythology and gibberish is that these “powerful groups opposed to an inflationary monetary policy in Japan” do not exist.

The explanation is another: if there is no inflation it is because the laws of the economy do not allow it to exist. This button, which allows the Central Bank to trigger inflation “when it is convenient” (when it is convenient for the State), works until it ceases to function and it is precisely this “which stops the inflation button” that marks, as a symptom, the death of a Keynesian economy.

The Keynesian growth model that we have experienced for the past 40 years is an economic farce that simulates creating wealth when what it actually does is consuming (destroying) capital (“capital” in the economic sense). This suicidal escape, analogous to the scene of “more wood, that is war,” in which Marx scrapped the train to feed its wood to the boiler of the locomotive, ends when there is no longer capital that can be consumed. This is what you have to understand, to understand what is happening.

The fact that consumers, businesses, and states appear severely over-indebted is not important, it is only a symptom. The fact that nominal interest rates are capped at their decline with the “zero limits” preventing the big clown from generating negative real rates, is not important, it is just a symptom. The fact that the financial system is deliriously leveraged and severely broken is also only a symptom. The fact that rich countries roll out insane trade deficits with poor countries and rich economies depend on loans from poor countries, that national pension systems are bankrupt and unable to pay pensions, are also symptoms.

All these are just symptoms that the capital that had been progressively consumed has already disappeared. It must be understood that the golden age of wine and roses was not a time of genuine economic prosperity, based on the ability of society to create economic wealth, but was a mirage in which we seemed to be rich because, in an insane orgy of consumption, We were destroying the capital that previous generations took 200 years to accumulate.

It must be understood that large monetary bubbles do not appear by chance, as an accident, or as a social pathology consisting of an epidemic of speculative greed. Monetary bubbles are just an exaggerated version of what a Keynesian economy always does, and in the midst of panic, is to consume capital while generating inflation, money, and unpayable debt. A process based on consuming capital is inherently unsustainable and the more advanced the Keynesian pathology, the less real capital remains in the world and the more gigantic the states have become and their appetite to consume capital (The sole purpose of the Keynesian toy is to satisfy the insatiable appetite of the State and to guarantee its unlimited growth). 

The succession of large-scale monetary bubbles, which condemn large sections of the population to be crushed by debt, always marks the agonizing end of the Keynesian experiments. They are a last flight forward and are characterized by the glamour and splendor of consumer orgies in which the last real savings available are destroyed. (See the “Happy 20s” that preceded the Great Depression)

Bubbles, and in a particular house or land bubbles, are just a terminal episode of a much broader disease called Keynesianism. When, for example, the leverage of Japanese banks soared, it was perfectly foreseeable that they would suffer a housing bubble and when the housing bubble materialized, it was perfectly foreseeable that their economy would collapse amid desperate and futile attempts to “beat the deflation.” The cliché “inflation ends up wiping out debts” is only true in the early stages of Keynesian disease, when “inflation” can take the form of a “wage-price spiral.”

Debtors, whether States, consumers or corporations, have a fixed-rate debt, which means that both the value of that debt and the value of the debt service are fixed in nominal terms. Also, the savings of savers is fixed nominally. A price-wage spiral is a change in the scale of the nominal value of the currency. As the value of the currency shrinks, debts and savings shrink to the same extent. Debtors see their debts evaporate because savers see their savings evaporate. It is a transfer of income from savers to debtors and is part of the general scheme of making the economy present some joy by consuming existing capital. (The real savings are transferred by the State to the debtors who consume it. Then the debts are erased and a new lot of savings can be transferred for consumption)

In the current situation, where wages are falling, and variable mortgage rates and prices are rising, it is obvious that “inflation” will not evaporate any debt. The one who made 1,000, paid a mortgage of 600 and bought a shopping basket for 400. If the mortgage rises to 700, the shopping basket to 450, and the salary is lowered to 900, this wage earner will not have the slightest feeling that “inflation” is helping him pay off his debts.

That these debtors have loans at variable and not fixed rates, that the installments of these mortgages are 60% of wages even when the rates are at 1.25% and that these loans have been granted by banks with leverage of x60, that they obtain a gross margin of 0.4% of those loans that they finance with the saving of some investors in fixed income willing to lend their saving for the 1.25% minus a differential of 0.35%, is not a set of misfortunes that have coincided accidentally. They are all features of the same phenomenon and express the terminal phase of a Keynesian economy based on capital consumption. The various “Band-Aids” that try to alleviate some of these superficial symptoms will not cure the disease because the cause is deeper: it is an explosive growing state that literally devours its subjects.


Categories
Forex Market

Purchasing Power Parity Theory

Traders, who operate in the foreign exchange market, read such news every day as: “the consolidation of the dollar led to the fall in the price of gold” or “the price of the euro backed the price of oil”. Although this news is usually published after an event, the relationship between the goods market and the foreign exchange market is felt independently whether we trade in the foreign exchange market or have nothing to do with it.

Theoretically, inflation serves as a correlation between the value of money and the prices of goods, and in this case, the currency does not matter (whether dollars, euros, rubles, British pounds, or Indian rupees). If a week ago the price of gasoline cost 40 rubles per liter and now it is 50 rubles, this means that the ruble in a week was lowered by 25% and the gasoline, on the contrary, increased in price. If gold cost $ 30 per gram in June 2009 and in June 2019 was $ 43, this shows that in 10 years the value of gold in US dollars increased 43% and the dollar, the other way around, fell in price.

Correlation between the goods market and the foreign exchange market. How does it work? They are simple and easy to understand (and also applicable to trading) examples of how money and goods are related and why the correlation between the goods market and the foreign exchange market is a fundamental rule that determines the price of a currency. Let’s try to decipher this theory.

Purchasing Power Parity Theory

Purchasing power parity theory states that the cost of goods in one country should not exceed the cost of goods in another country more than the price of the transport of goods between the two countries. The price of transportation also includes the profit margin of the trader and the change of the standards of one country by the standards of the other. It is also theoretically assumed that there are no artificial trade barriers.

When most of Europe and Asia, back in 1944, were in ruins, a conference was held at the Bretton Woods spa where, for the next twenty-five years, the fate of all the world’s currencies was determined, among which the United States was chosen as the international reference currency. The currencies of other countries were beginning to be traded in dollars, the same dollar was convertible into gold and the troy ounce was worth $ 35. That agreement at that time seemed fair, as the US had 70% of all world reserves and, thanks to the Second World War, it had an international advantage.

The Bretton Woods monetary system existed until 1971 when United States President Richard Nixon unilaterally terminated the agreement, and on 16 March 1973, the treaty is known as the “Jamaica agreement” was signed, which formed the Forex currency market. According to the “Jamaica agreement”, exchange rates would be set in the market on the basis of supply and demand. Since then and to this day the dollar is the main reserve currency, occupies a leading position in the calculation of energy, goods, and gold, and is the main currency used in many financial instruments.

At present, the US dollar position is well described with the word “petrodollar”, and the main volumes of trade in goods, including oil and gold, take place on US exchanges such as NYMEX, COMEX, CME, and ICE. The United States leads in the trade of oil, gold, grains, and many other goods, and the quotations of productive resources are valued in US dollars: gold/dollar (GOLD/$), oil/dollar (WTI/$), corn/dollar (Corn/$), wheat/dollar (Wheat/$), coffee/dollar (Coffee/$), etc.

For the determination of the value of the market of goods or a group of goods there are different indices of raw materials. The best known among them are: Thomson Reuters/CoreCommodity CRB Index (CRY) and Deutsche Bank Commodity Index, which are calculated based on parameters of futures traded on the exchanges indicated above. The exception is for aluminum and nickel prices, which are based on quotations from the London Metal Exchange, calculated in US dollars. Gold prices are also valued in US dollars.

The quotations of foreign currencies are also translated through the value of the dollar: pound/dollar (GBP/USD), euro/dollar (EUR/USD), dollar/ruble (USD/RUB), dollar/franc (USD/CHF), dollar/yen (USD/JPY), etc.

The best known of these is the US dollar index (USDX) measured in relation to the value of a basket of six currencies: the euro (57.6%), the Japanese yen (13.6%), the pound sterling (11.9%), the Canadian dollar (9.1%), the Swiss franc (3.6%) and the Swedish krona (4.2%). The index began in 1971 with a base of 100, and values since then are relative to this base. Therefore, the current rate of index 97 indicates that the exchange rate of the US dollar, relative to the basket of previous currencies, represents 97% of the level of 1971. ¡ A completely insignificant change in 48 years!. But the reality is that it hasn’t always been like this, and in recent years the index has changed considerably from the level of 70 percent in 2009 to the level of 128 percent in 1985.

Do we say “oil,” but do we really mean “dollar”?

As we have already mentioned, the US dollar is used in goods and currencies; the exception is inverse currency pairs, but it is only a mathematical casuistry for the ease of quotation of these currencies. It is very logical to think that at the moment when the dollar rises, the exchange rate of goods decreases, and vice versa, the depreciation of the dollar leads to the rise of currencies and goods markets.

Between July 2014 and July 2017, oil and the dollar correlated with each other with a coefficient of -0.75, that is, they were inversely correlated. Thus, at that time the linear correlation between EUR/USD pair and Brent-type oil in certain periods of time can reach the coefficient of 0.9, that is, it can be very high.

In the preceding paragraph, I purposely emphasized the phrase “in certain periods of time”. The ability to detect periods, in which one or the other factor impacts on quotes, depends on the competition between traders and the level of his training. In this case, there are no clear examples and schemes, everyone has to take this path on their own. But what we do have to warn about is the effects of oil prices on foreign exchange rates increases over time, when the difference in interest rates is small, as in the years 2014-2017, and decreases, when interest rate potential increases, as in the years 2018-2019.

Analysing the correlation between the prices of goods, oil, and the foreign exchange market, it should be noted that the study of the correlation between these assets has a low efficiency. It is better that traders, who ultimately decide to study the issue on their own, focus on monitoring quotes by oscillators, for example, the stochastic indicator or RSI that allows absolute values to be left by the percentage change of some assets compared to others.

We live in the era of hydrocarbons, and oil and its derivatives are the main product whose price affects all other sectors of the economy, which is reflected in the indices. Energy carriers account for 33% of the composition of the Thomson Reuters/CoreCommodity CRB index, regardless of natural gas. As a major part of the Deutsche Bank’s commodity index, petroleum products, and oil amount to 50 percent.

In this way, the change in the price of oil leads to changes in the entire market of goods, from which some dependencies can be deduced: the decline of the dollar leads to the growth of the price of oil and foreign currencies; and vice versa, the rise of the US Dollar contributes to the depreciation of the price of oil and foreign currencies.

It is impossible to predict the beginning and the end of this correlation. For example, the price of the euro may fall, causing the rise of the US dollar, which in turn will contribute to the fall in the price of oil; or if the price of oil begins to rise, the price of the dollar begins to fall, which in turn causes the growth of the euro.

Purchasing Power Parity Assumptions

Purchasing power parity theory takes into account a world in which there is no single reserve currency, assuming many world trade points, which is not in keeping with the current situation. However, the crisis of the world’s dollar-based currency and the trade wars that have been unleashed as a result of Donald Trump’s presidency have forced the governments of major emerging power centers to try to find a gradual replacement of the US dollar as a universal equivalent value.

Thus, for example, in the calculations of Asian goods, the Chinese yuan has already left the Japanese yen behind and is gradually displacing the US dollar from trade. At the St Petersburg Economic Forum in early June, China and Russia agreed to eliminate the US dollar from reciprocal payments and arrangements; Iran and Turkey take the same path.

The tendency to renounce the dollar is barely growing, but it already seems impossible to stop it. The more trade tariffs the US applies, the more the dollar will shift in financial calculations and the faster the US currency will lose its position as the dominant global currency. Trade wars will inevitably lead to the fragmentation of the world economy in several monetary and customs zones, where the theory of purchasing power parity will be in force in a forceful manner, avoiding the intermediate link that is the US dollar. Of course, there is no one who knows for sure when it will happen, but there is no doubt that one day it will happen.

Purchasing power parity theory, like interest rate parity theory, is the fundamental basis of the currency market. In turn, the study of the relationship between the goods market and the foreign exchange market is an important element in the “authentic” fundamental analysis, unlike the studies of different “relevant” economic indicators or informative, which are very often difficult for private traders to analyse due to a lack of their knowledge and resources. However, knowing how it works and thinking nimbly, we will always find a way to apply the basic rules of the currency market to make a profit, even in complicated situations. He who seeks finds!

Categories
Forex Market

WARNING: The Economy Has Become a Zombie!

A year after the repo explosion, Cantillon Effect, Minsky Moment, the economy has become a zombie.

A year ago there was one of the greatest events of liquidity scarcity in history, for a moment the world economy was on the verge of collapsing fatally, forcing the Central Banks, especially the FED to print money in an accelerated manner, since the Eurodollar or reserve currency system, the dollar, had dried up and there was a demand for dollars above normal, everything was triggered by a shortage of liquidity, by excessive leverage of companies and Banks. 

This shortfall in liquidity caused enormous volatility in the US Treasury bond market, which acts as a basis and liquidity for the other markets, leading to real phases of extreme volatility in the equity markets. With extreme volatility and falling rates, all brought about by the Fed’s decision to reverse QE and the printing of currency the market was collapsing like a house of cards, this shows a fragility never before seen. This could prove that we are dealing with a zombie economy.

This was just the symptom that the economy is not going well and in fact still not going well, the virus is still the perfect excuse to lead the economy and societies to a new feudal system, where a transfer of wealth from the less affluent classes to an elite that uses the virus for social engineering experiments occurs, plus the greatest monetary experiment in history with record prints of paper money or credit money as I call fiat money, to impose a series of reforms leading to a less free and more docile society, in a new regime of semi-slavery.

And as we see to build a new world order you have to do a hard reset or a great reset, you can only get it by destroying the old system and that is why the Fed has kicked ahead and prints as if there was no tomorrow. And before the minimal reduction of its balance sheet the markets are staggering and staggering because we are; we were a year ago in Minsky with an economy in a Ponzi debtor state, which defines Minsky.

The Ponzi debtor, that before any fall will not be able to pay even the interest and this is the consequence that it is based almost mainly on the increase of the prices of the assets to continue refinancing the debt.

We have zombie companies that only survive if the stock price keeps going up, as they are still without liquidity. The Fed has to print so that the Ponzi scheme in which the world economy has become collapsed, thanks to the MMT and its idea that you can have deficits unlimited and that you can print without consequences when it is false. This is when we come across the Cantillion effect and how the economy is directed towards a feudal system.

It is precisely what describes the monetary speed, which is neither more nor less the times when money changes hands, and which has a very strong influence on the real economy, say when there is a collapse of the times when money changes hands, It is telling us directly that the real economy is freezing, and therefore inflation in the real economy is cooling, that is, apparent deflation. But when you print so much money, you get a drop in purchasing power, so you don’t directly have inflation from price hikes, you have inflation from currency devaluation, even if prices fall and technically there’s deflation, the reality that the value of credit currency falls faster than prices fall and we actually have an inflation rate for loss of purchasing value. This is what is known as the Cantillon effect.

As defined by Economipedia: The Cantillon effect explains the uneven effect that monetary policies can have on the economy. For example, if a central bank injects money into the economy, the resulting inflation (the price increase)  is not reflected uniformly. Richard Cantillon (1680-1734) became the first economist to assert that any change in the money supply distorts the structure of an economy.

This is because newly created money is not distributed simultaneously or uniformly throughout the population. The process of monetary expansion therefore involves a transfer of wealth. This basically means that those closest to the central banks take advantage of this new money and buy consumer goods or capital at a better price, that is, elites and governments. While the rest of us mortals are at a disadvantage because with less purchasing power and without access to that new credit we cannot acquire assets and when we can the asset prices have already skyrocketed, showing that the money supply is not neutral, is harmful, and produces a transfer of purchasing power from the less affluent to the wealthier classes, a reverse Robin Hood. A neo-feudal system or as they call it a new world order.

A new world order where puppet elites and governments do not allow the less affluent classes to enter the markets as they cause hyperinflation of shares, and a fall in the purchasing power of the less affluent classes, that the elites compensate by having before anyone access to the newly created credit currency. This means that the chances of the poorest people escaping are diminishing, we are facing a slave system. And it is not because of the (non-existent) free market, but because of ideas closer to the Marxism of the MMT.

And this is how the economy and the free market dies, it becomes a great Ponzi scheme, where a privileged few turn into a casino the world economy, full of zombie companies living on the cost of issuing new debt and stealing purchasing power from citizens. The Cantillon effect is the weapon that these elites use to maintain the status quo and that the great reset is the new neo-feudal system that they have prepared for us.

Categories
Forex Market

What Can FX Traders Learn From Alexander Kearns’ Death

Many of you may have heard of Alexander Kearns, but for those that have not, it is a sad situation where a young man, just 20-years old took his own life due to an error in a trading system which showed him in approximated $730,000 debt with a broker.

When the Covid-19 pandemic hit, Alexander Kearns decided to take up trading. He took advantage of the fact that many brokers are offering their clients leverage, which is basically the act of lending you money in order to make larger trades than your account would otherwise be able to make. It was due to this leverage on offer that this mistake took place. His account showed a negative balance of $730,000, something that he believed he would have had to pay back in one way or another. Due to the immense stress of the situation, Alexander sadly took his own life. Of course, this was totally avoidable. Even worse, the balance was a mistake by the app, and the account wasn’t actually in the negative.

For those active in the trading community, they know that this sort of tragedy could have been easily avoided. Alexander came into trading with very little knowledge of how certain areas work, which is why it was so avoidable. Had he known that accumulating this sort of debt so quickly would be extremely hard to do, even for the worst traders out there, it would have helped him to understand the fact that many brokers now offer negative balance protection, preventing you from owning anything should you lose your account.

It is important that we learn from this tragedy in order to help ensure that nothing similar happens again in the future. In order to do this there are a few things that we can take away from this which could help prevent any further tragedies, so let’s take a look at some of the things we have learned.

Understand Leverage

Leverage is a wonderful thing, as it can give you the opportunity to make a lot of extra money. It basically increases the trading power of your account, but it also has its downside. While it increases profits, it can also increase potential losses. Remember you are now trading with larger trade sizes, so if things go the wrong way, you will ultimately lose more. You need to have an understanding of how this works before you begin to trade. Learn the ups and downs and ensure that you are not trading with leverage that is simply too high. Some brokers offer 2000:1 leverage, this is simply too high and very dangerous for a new trader.

Negative Balance Protection

One of the most important things for a new trader is negative balance protection. This is simply where a broker does not allow you to go into a negative balance. Instead, as things go the wrong way and your account equity lowers, the broker will automatically close all trades that you have open in order to prevent you from going into a negative balance. Of course, those trades will be closed at a loss and you will have lost the majority of money in your account, but at least you do not owe anything extra on top of that. The majority of brokers now offer this service, so be sure that when signing up for a broker you make sure that this is on offer. While we hope you will never have to use it, if you do, it could save you a lot of money and also help to avoid any situations similar to Alexander Kearns.

Understand the Risks

It is not only about understanding what the risks are, but also how you can manage them and potentially reduce them. There are a lot of different risks involved when it comes to trading, things like leverage, the markets going the wrong way, different risk to reward ratio, no stop losses or taking profits, and more. What we need to do is to get a good understanding of how to reduce them. Stop losses are a great way to prevent risk, so is using the appropriate lot size and trade size. When you create your strategy you also need to create a set of rules for entering trades as well as exiting them, you also need to decide on the trade size and anything else like this. Having all of this predetermined is a great way of ensuring that you stick to them.

Use Stop Losses

Stop losses are there to protect you and to prevent you from losing too much. Without them, a single trade could potentially make you lose your entire account. Instead, having a stop loss in place will mean that your loss for each trade will be fixed, this will help you to prevent huge losses with each trade and ultimately save your account. Ensure that with every single trade, you have a stop loss in place to help protect you, you should never be trading without one, under any circumstance.

Only Trade What You Can Afford

This is one of the big ones. You have probably seen this warning out there as you look through forex and trading related sites. You should only trade what you can afford to lose. If you think about the money that you are putting in, if you were to lose that money, would it hurt you? Would it prevent you from paying rent or anything like that? If the answer is yes to any sort of question like that then you should not be trading with it. You need to only trade with your expendable income and not any funds that you need.

Avoid Volatility

Volatility can be a trader’s best friend, but as a newer trader, you should try and avoid it. When there are big news events coming out or the markets are simply jumping up and down, you should try and avoid trading in this situation. Yes, it can increase your profit potential, but it can also increase your loss potential, which as a new trader, is far more likely to get you at one point or another. It is far better to simply avoid these situations rather than to risk trading.

Choose The Right Instrument

As a new trader, you need to be careful which assets you decide to trade. Some of them are far more volatile than some of the others. In fact, some should be avoided at all costs. As a new trader, you should probably try trading the major currency pairs rather than anything else, at least until you are used to trading and how it all works. Going for something different will simply mean that you are trading higher volatility which can be more dangerous.

So those are some of the things that we have learned from the tragedy of Alexander Kearns. It is important that we do what we can to try and avoid anything similar happening again in the future. Using what we have learned can make it safer for us to trade. As a new trader, learn from what we have written above and understand the risks before you put any money into your trading account.

Categories
Forex Market

The Economic Calendar and Why It’s So Darn Interesting

Today we’ll go with an entry about a tool that interests a lot of you, the economic calendar, and its impact on Forex trading. It is constantly updated so that you have access depending on the day you are looking at it. To get started, let’s see what this tool is and why I tell you that it is a tool that should interest you a lot if you trade in currencies (or any other type of asset).

Index

  • What is the economic calendar?
  • Is a Forex calendar important?
  • When should I look at the economic agenda?
  • What is important in a macroeconomic calendar?
  • Trading based on macroeconomic data.
  • Technical analysis, fundamental analysis, and the economic agenda.
  • Where to look for Forex news data
  • Publication of macroeconomic data
  • Global indices and commodities
  • How do I use the economic calendar?
  1. What is the economic calendar?

An economic calendar, as its very name indicates, reflects when and what economic issues will be published globally. It can be the decision of interest rates on the part of a country, indices production prices, balance of trade, economic events. In short, it shows you any event that could affect the economy and the financial markets.

  1. Is a Forex calendar important?

As you know, in the Forex market (as in all) price movements are impacted by the news, macroeconomic data, government decisions, and more. Therefore to follow an economic agenda allows us to know when the greatest movements in the market will take place. We can even use this to not do trading or even as some traders do, do news trading.

  1. When should I look at the economic agenda?

Depending on the frequency of your trading, if you do swing trading (trades that last several days) it may have little relevance in your trade and just look at it once or twice a week. If on the contrary, your operation is more aggressive, reviewing the economic calendar each day can give you an optimal point of view of the market. You know, more day trading, more focus, which is something that doesn’t sell much but that’s there.

  1. What is important in a macroeconomic calendar?

If you take a look at the agenda above you will see that many days have published enough data and many of them are not very important. This you can set to stay only with those that are really important. Even sometimes, those that are a priori important generate little movement in the market. Still, don’t trust yourself.

  1. Trading based on macroeconomic data.

It is very popular to read or listen to some traders say they trade forex with news. What they look for with it when there is high volatility is to gain a lot in a very short time. Careful, the message sounds very nice but the reality is not so much. High risk is also something to calibrate well, in addition, to stop loss sweeps, landslides when entering the market. You must keep these issues in mind.

  1. Technical analysis, fundamental analysis, and the economic agenda.

Whether you do technical analysis or fundamental analysis, the economic agenda really matters. You might think that since you do technical analysis, you don’t care about this whole macroeconomic news thing. You can really do that in part, but to follow the market keep them present or you can get some upset. If you’re in a pretty big position within the pound and there’s news about the UK Brexit referendum, this may annoy you, to put it mildly.

If you focus or are focused on fundamental analysis to make buying and selling decisions you will know the importance of following the macro calendar and will work with economic data as a source to make your decisions. 

  1. Where to look for Forex news data

On this very page, up. In addition, there are other well-known ones such as Investing, FXstreet, and different portals where you can see these types of calendars, each with a different style. In the end, it’s a matter of taste, choose the one you like the most and where you feel comfortable. The source of the data is usually the same.

  1. Publication of macroeconomic data

Some people are obsessed with when this data is published to buy or sell based on how good or bad this data has been. Error. Two points:

In free portals the publication of the data is done with some delay and to avoid this we should hire platforms like Bloomberg (it is a paste to keep them for the independent investor and do not make much sense). But even so, today the execution of orders mostly goes by algorithms. In the time it takes to observe the data, you open the broker and place an order, the algorithm may even have already closed the position. Focus your goal on other more profitable patterns.

Another thing, do you think that just because a piece of data is better than expected, it’s gonna benefit an asset that goes up or vice versa? The answer is no. Sometimes this is discounted on the price already or the data is good but worse than expected. If you are a retail trader, I recommend that you do not enter this war unless you are very clear about it.

  1. Global indices and commodities

You may wonder if this agenda is only for the Forex market or has any use in the case of trading in indices or commodities. Macro data from China without going any further are moving most of the world indices. Events in the United States cause major markets, including European indices, to be affected both positively and negatively.

Another example is oil, which in turn has a direct relationship in some currency pairs due to the countries where it is traded and where there are large reserves. The publication of oil inventories is very important data that is taken into account by investors and traders. In the end, they affect the asset or country in question, either directly or indirectly, and it is important to have control of its publication so that you do not get caught out of play.

  1. How do I use the economic calendar?

I’ll tell you how I use the economic calendar and how you can use it yourself. If you do algorithmic trading as is my case, that is, you have automated in and out of market operations, you can carry out different actions:

-Create strategies that avoid operating at times where high-impact news is published for markets (for example, on Fridays at midday).

-Adjust systems to market volatility. We can calibrate the amount and distance to stop loss based on price variability. If it is high, it is advisable to leave more distant stops so that you do not jump at the first change with strong movements. Indicators like the ATR (Average True Range) for example can help you in this.

-Disconnect systems when there are Brexit events or important government decisions at any given time.

Beyond that you can design them yourself according to your preferences, here are some ideas. In a habitual way, apart from this type of facts, I use the economic agenda like this: the weekend where I usually look at what publications there will be in the next days and every morning when I wake up where I review only the data and the next hours (of that day).

Don’t worry if you can’t stay on the screen because you work or are busy. In addition to the Internet browser you normally use, there are mobile apps that allow you to view them. In fact, you can already do it from your smartwatch. It’s not that you’re obsessed with constantly refreshing the page or app to see what’s going on, just remember that it’s all about having control.

Categories
Forex Market

Is Market Analysis a Must for Trading?

Imagine that you are a doctor and a patient visits you. Instead of conducting a full check-up, you just put the person on the table and start operating. This doesn’t sound good, does it?

      …well, neither does trading without any analysis.

The thing is…we may choose between thousands of different ways to start trading, but there are always a few crucial points to consider. We have all heard stories about people who approach trading as if it were gambling. They rely on emotions, luck, and intuition to determine the future of their finances. However, although this method is wrong and dangerous, what do you believe is the missing component?

If you just took a coin and chose the head as a sign to go long and the tail to go short, you would have a 50-50% chance of succeeding, right? Well, it depends. With knowledge of the market and indicators, a developed toolbox, and proper analysis, this ratio would immediately change.

We need to have a clear idea of where we are going to set our take profit and stop loss and what our risk-to-reward ratio is going to be. These points cannot be determined randomly. We need money management to know how to manage any trade, from entry to exit. 

Many professional traders will condemn any vague, unclear approach because, as traders, we can have a much greater chance of winning with the precision and clarity that come with knowledge, analysis, and money management. 

No matter which strategy you apply in trading, money management should come first. Calculate your risk properly and do not let the trade run loose.

Traders may prefer lower or higher time frames, trying to make the most out of the chart analysis. Technical traders are going to rely on different tools to gather information about the market. However, to know whether you should enter a trade or not, you can do the naked chart reading as well and still know exactly what you should do to succeed.

Naked chart traders do not use algorithms but focus on what candlesticks are telling them about current market activity. Although these traders do not use any indicators in this case, they still need a developed skill set to generate wins and limit losses. 

As naked-chart strategy requires traders to interpret price action signals, they need to determine the overall market direction and read various patterns. Indicators may not be relevant in this trading approach, but managing one’s emotions and attitude is as important as in any other trading style.

Some aspects of trading are universal. Whether you are a technical trader or a naked-chart one, you will need to learn to analyze the market and yourself.

We know how the trading world offers abundant possibilities. Needless to say, trading comes with its own set of risks. That is why some affluent people are keen on seeking advice from experienced traders to ensure a good return. Nowadays, we are also seeing a rise in automated trading (i.e. expert advisors or trading robots) that aims to alleviate the entire trading conundrum and achieve profit without breaking a sweat.

With this approach, traders are free of having to manage each step of the trade themselves. They, however, need to invest in this ready-made system and, preferably, consult with a trading manager as well. 

Now, regardless of any easing that comes with purchasing EAs, people still need to understand the strategy that their robot is using. These traders may not be complete or independent, but they must analyze how the EA they chose works.

You may not care about who is running the state or which report is coming out next, but you still have the task of realizing how you are going to manage a new trade. How do you know that something is a signal or not? How are you going to tell if you are in an uptrend or downtrend? Which strategy brings you the best results? The questions may go on and on, and you are the only one who can answer them.

Based on everything we said above, there is no trading without some form of analysis.

To earn a profit, you need to know the key points in your trading, including your maximum risk and potential reward. What is more, earning a sustainable income should also push you towards understanding what triggers you to behave irrationally. For example, your leverage may be too high or too low, but without assessing the whys, you cannot progress any further. Any algorithm you develop can also help your trades run smoothly and prevent future losses.

Some professional technical traders will say how trading is based on three key concepts – money management, trading psychology, and technical analysis.

Now, even if you are not a really big fan of indicators or prefer a different approach, you need to build experience, as it will help you eliminate future mistakes and manage your emotions better. Yet, to get to the point of having a comprehensive perspective of your personality and the market, you still have to carry out thorough testing. 

You need to see in advance if your chosen strategy is going to yield results. And, even if it does, you might react differently once you start investing real money. Try to obtain a 360 vision of everything – the market, your involvement, and any tools you may be using.

This is why, whichever time frame or strategy you are using, you need to backtest, forward test, and real-life test your system. 

Imagine a situation where you finally started making money, but you suddenly, out the blue, take a few really bad losses with the price hitting your stop loss. 

What do you do? 

You must assess what went wrong – was it emotions, technical analysis, or something else. How can you improve your trading without recording what you were doing? The only thing that matters at the end of the day is the bottom line. Compare your total wins and losses and see if there are any loose ends. 

Trading is more about protecting your account from losses than about sole winning.

You can always use a demo account to see how your approach is working out for you. Any trader with experience will advise you to take notes on every trade you take, including all entry and exit points, indicator settings, and other key information concerning the trade.

Personality tests are also an invaluable tool for traders to get the gist of some negative beliefs that are deeply rooted in your subconscious. You do want to know if there is a part of you that is blocking your prosperity and growth. Finally, understand that whichever approach you take, trading is all about analysis, of yourself and what you do.

You are free to make your own selection of your trading style or even entrust a trading robot with your finances, but do not for one second believe in easy money with no involvement on your side.

Your trading is like a flower bud – you need to devote time, effort, and energy to see it grow, and bloom. Sometimes, you will use less water and more fertilizer to accommodate the changing seasons, but you will always be present, monitoring the development from the seed to the full-blossom stage. If you wanted to take yourself to the next level, you might consider attending a florist competition. That is when you would further build your skills and might even learn how to cut and decorate flowers. 

Still, the one thing that connects all the different stages of this process is analysis. Some people are blessed with a green thumb, so they know intuitively what to do to help the flower grow. However, to be an expert, everyone needs to include a detailed assessment of factors affecting their success in their chosen field.

Categories
Forex Market

Fixed Forex Spreads vs Floating Spreads: Which is Should I Choose?

When you’re searching for a broker, you’ll find many different account types and options when it comes to fees, available assets, funding methods, and so on. One of the major things that traders look at are the spreads offered by various brokers, as the differences in these fees can be large and will make a big impact on the amount of profits that you actually bring home. Brokers generally profit through two different fees – commissions and spreads. The spread is the difference between the bid and ask price on an instrument. For example, on the pair EURUSD, an average spread is around 1.5 pips. 

However, some brokers widen the spread to 2 pips or even higher, which puts clients at a disadvantage. Much like comparing car insurance, traders need to be able to compare the spreads offered on different account types and through different brokers to find the best deal possible. Otherwise, they will lose a great deal of profits to inflated fees when they could have chosen a broker that offered more competitive pricing.

As mentioned above, you want to look for spreads of around 1.5 pips on the pair EURUSD. Don’t expect to see this on every available instrument, as spreads on exotics and some minor currency pairs can climb much higher. If you see a good spread offer, you still aren’t done, as you’ll need to know whether the spread is floating or fixed. 

Floating spreads are more common in the forex market and this means that the difference between the bid and ask price is constantly changing. If a broker advertises floating spreads from 1 pip on a currency pair, you still might see a spread of 1-2 pips or higher for that same pair. Brokers are also likely to charge commission fees if they offer a floating spread. You’ll want to check to see if the broker lists each instrument they offer and the starting spreads for each pair on their website so that you can see the different starting spreads. If a broker advertises starting spreads from 1 pip but doesn’t go into more detail, you should expect to see this on some major currency pairs with higher spreads on other instruments.  

Unlike floating spreads, which constantly change, fixed spreads are set at their exact value and give traders a more solid foundation of knowing exactly what they will pay. The downside with this type of spread is that it is usually higher than the lowest point with a floating spread. For example, if the broker offers floating spreads from 1 pip on EURUSD, you might see a fixed spread of 2 pips or higher for the same pair. Low fixed spreads are advantageous, while higher fixed spreads mean you will wind up paying more money to trade. 

When it comes to deciding which type of spread is better, you’ll have to take a look at each broker’s specific offer. You also might have to look around if you prefer a certain type of spread, as many brokers only offer one type or the other, while some offer different account types with different kinds of spreads. In our opinion, the best kind of spread is fixed, but it must be narrow. If the spread is fixed at a high value, it is usually better to go with a floating spread.

Categories
Forex Market

When Can I Trade? Let’s Review Forex Market Trading Sessions & Hours

The Forex Market is open for trading 24 hours a day, five days a week. The market is divided into 4 different sessions depending on the time of day. The daily trading session begins with the Pacific session, before moving on to the Asian, European, and American sessions. Things wrap up on Friday as many large financial institutions, banks, and other large investors are out for the weekend. Below, you can view the opening and closing times for each session along with the characteristics that make each session unique. 

Pacific Trading Session

Working hours for forex trading begin once the Pacific sessions open on Monday. The Pacific trading session is based in Sydney and operates from 0:00 to 9:00. This session is known for being the least volatile time to trade and is generally the most peaceful. 

Asian Trading Session

The Asian trading session is based in Tokyo and opens from 2:00 – 3:00 with a closing time between 11:00 and 12:00. Major currency pairs USD, EUR, JPY, and AUD are actively traded during this session.

European Trading Session

Based out of London, the European session opens at 10:00 and closes at 19:00. This session becomes more active after trading begins in London and experiences more of a lull in activity around lunch, before gaining more momentum in the evening. During this time, the market might experience stronger volatility because of the large money turnover. 

American Trading Session

The last trading session of the day is the American session, which opens between 15:00 and 16:00 based in New York. The session wraps up between 0:00 and 1:00. The American session is the most active of the four trading sessions. Important news is released at the beginning of this session and trading becomes more aggressive towards the end of the day, especially on Fridays before the market closes for the weekend. 

* All timeframes are based on Eastern European Time (GMT+2 in winter, GMT+3 in summer)

Categories
Forex Market

Guidance for Trading Forex During Times of Crisis

People generally go about their daily routine without fail, but things change during times of crisis. For example, if the weatherman predicts tornados or even snow in some states, people suddenly go into panic mode and rush out to buy milk, bread, and toilet paper until grocery store shelves are empty. Whenever someone perceives a potential crisis on the horizon, their everyday thought process changes and they begin to go into survival mode.

In some cases, this is for the better, although people often overreact when it comes to small-scale events. Fortunately, we don’t have to deal with crisis mode too often and many of us forget about the frustrations of the last crisis shortly after it’s over. 

In the past, humans went into crisis mode a lot more often and for different reasons, like predators, hunting dangerous wild animals, or because of an incoming attack from a rival tribe. In today’s modern world, most of what we would consider a crisis revolves around the weather, economic, political, and health-related issues. A great example would be the Coronavirus Pandemic, which has inspired a lot of fear, along with hoarding, distrust of the government and in a vaccine, lockdowns, quarantine, and other problems. It would have been nearly impossible to predict what was to come just a few months before the virus began to spread. 

It could be argued that things could have been done to slow down the coronavirus pandemic and to stop it from reaching other countries. Many people believe that the government did not take the virus seriously enough in the beginning, which caused slower and less abrasive actions than what was necessary to stop it. This isn’t that surprising, considering that the modern world has not dealt with such a large pandemic in quite some time. Some scientists and institutions did promote research that suggested this type of thing was possible, but many of us simply weren’t prepared to deal with this crisis. 

Crisis and the Financial Markets

We mentioned how humans operate in two modes: regular everyday life, and crisis mode. It works the same way with the financial markets, as people tend to panic and act differently whenever they perceive a crisis. Since buyers and sellers drive the market, this can cause a lot of issues within the market itself. 

One of the most important things you can do as a trader is to learn to identify whether a potential “crisis” will be small-scale or if it is a world crisis. For example, traders all over the world obviously aren’t going to be worried about a tornado warning in your home state, while a world war would affect things on a global scale. The Cuban Missile Crisis of 1962 and the recent Coronavirus Pandemic are two more examples of world crises that had a large-scale effect on the market. Once you’ve identified which category a crisis falls into, you will need to apply different trading rules depending on what you expect to see with the market.

There are two rules that can be used to help you accurately identify whether a crisis should be considered normal or a world crisis:

  1. Consistent movement in the markets with unnaturally high volatility; declining stock markets; and ranges lasting for some time over their long-term averages are signs of a real-world crisis 
  2. Emotional reactions from traders that result in crashing stock markets are a sign of a real-world crisis that shouldn’t be taken likely

In order to check for the first rule, you can apply the average true range indicator over the long term in order to compare the results to recent daily ranges for the forex, stock, and commodity markets. 

The Bottom Line

Although we don’t have to worry about large-scale crisis too often in the modern world, things can happen quickly and catch us off guard, sending us into full-scale panic mode. As a trader, it’s important to be able to identify just how big of a deal any new crisis might be and whether it is a normal crisis or something that will affect the entire world. This can change the way the market behaves and you’ll need to be prepared and on top of your game to keep up. Remember, even if you believe that a crisis will be widespread, it’s important not to panic and to continue trading with a level head. Always stay up to date on the news and pay attention to what other savvy traders are saying to get a sense of what your peers expect.

Categories
Forex Market

Why We Don’t Have Reliable Volume Data in the Forex Market?

Professionals who see volume as a prerequisite of success view any lack of volume as an important factor. Traders need volume to know if the trade they are interested in is worth taking. They explain how volume directly affects the chart because it is what moves the market. As volume is changeable – both in the sense of the entire forex market and particular currency pairs – we wonder where this volume inconsistency stems from. 


Having left the gold standard in the 1960s, most currencies across the globe are no longer backed up by equivalent amounts of hard assets. This left much room for the governments and banks to manipulate the circulation of currencies, increasing the overall money supply. As more money is printed, consumers demand more goods, which results in increased prices. The overall volume of money in the market does not only refer to the cash that circulates in the economy, but the digital money as well (bank accounts), and any changes will have an impact on both. Forceful printing can have terrible consequences like what happened to Zimbabwe, which kept printing more money to the point of its official currency becoming entirely worthless. As money moves, so does the volume we see in the market. For example, in 2019, many noticed how the stock market experienced a long period of prosperity, supported by unprecedented growth levels. As all money flooded into stocks, the market’s expansion triggered historic lows in the spot forex. Such dynamics between the two markets depend on the concentration of money that fluctuates alternately. Volume is affected by other factors as well, such as market condition and geopolitical status, and news.


Market volume always changes and, sometimes, the volume can be really low for a longer period of time. When this happens there are a few important rules to remember:

  • Dead markets are normal and happen regardless of your skills and knowledge.
  • Do not push yourself to enter any trades if you are not getting any signals.
  • If you are testing your system now, you may not get much yield because of the state of the market.
  • If you are getting signals to trade, steer clear of the USD (especially if you are a beginner). When the market is sluggish or dead, the big banks will thrive off the USD where most traders are.
  • Take the entire trade-off at your first take profit.
  • Because the volume will return at one point, your volume indicator may not be quick enough to notice the change, so you may miss the first big move.
  • Trade smaller time frames to get quicker results in this period.
  • Prepare yourself for fluctuation volume now and do not expect tailwinds all the time.


Volume indicators are believed to be one of the most important constituents of professional traders’ algorithms. Not only do they increase the chance of winning in each trade but they also serve to prevent losses, which is a prerequisite for sustainable success. However, it is important to distinguish between volume and volatility. While we do need volume in the market, we should look for the most volatile or liquid pairs. Indicators such as the ATR are excellent tools for measuring volatility in the market and calculating the risk. The Cboe EuroCurrency Volatility Index also tracks the short-term projected volatility of the EUR/USD exchange rate. While any volatility information can prevent the trader from making the wrong choices, volatility indicators should be used together with a volume indicator to achieve the best results.  


The DOM indicator is one of the popular volume indicators in the forex community with an impressive Google search frequency. Based on the brokers’ data, this indicator offers an insight into the price levels with the heaviest volume. Traders often seem impressed with the DOM’s performance, but fail to understand that any dealing desk broker’s information is limited to levels and does not stand for the overall volume. Therefore, this indicator simply cannot help us understand volume or how the market is going to respond. What it can do, however, is hinder our development because everyone can access this information easily. The DOM is easily available on the most popular trading platforms and, due to its popularity, most traders like to use it. Yet the DOM lacks information that we could use for trading consistently. The order concentration levels it represents are not going to be the guiding light for your forex trading. Other assets like crypto have more reliable data from the exchanges about these levels, BTC is a good example with so many positions stacked around the $20k price level. 


Volume indicators are key money management and risk management tools, but many of them offer similar information. Therefore, to understand any given data concerning volume, traders need to learn how to read the numbers which they are presented with. So, if any indicator reveals a price that is several pips higher, traders need to be cautious because the information they see is incomplete. We still do not know anything about the type of orders that comprise this volume, whether they are limit or stop orders, or if the majority is entering long or short trades at the time. Traders should also be invested in discovering the predominant percentage of long and short trades because it will help them determine the correlation between volume and the types of trades forex traders are typically entering at the time. The missing information is crucial for understanding volume in the forex market, as numbers alone have no meaning. We still lack the qualitative analysis of the market to understand what is happening.


Volume will always oscillate and there is not much we can do to change that. What we can do, however, is approach it in a smart way. Your approach to trading is vital for your overall success, so if you are not prepared mentally or emotionally, your account will suffer no matter the conditions. Traders often think that the higher the volume, the better, but dead markets can also be an excellent opportunity for growth. If we succumb to the challenges and fail to apply money management skills now, we won’t be able to reap the fruits later. What you can always do to improve yourself is to focus your attention on your trading skills and system. Is there anything you can change? How can you improve your algorithm to function even better? Remember to stay on the course and power through by doing what you can and what is best for your trading account. When there are no opportunities for making money, there is abundant room for backtesting and forward testing your algorithm. If you have a strong vision, use the times with no volume to reflect on the lessons and the choices you made in the past. Even if you had big plans to quit your job in a year and devote yourself exclusively to trading currencies, now is not the time to make such changes. Keep your other sources of income and use the time you have wisely, perfecting your system for future success.


We may be looking for different tools and methods to obtain volume data, but the focal point of this article is that our attention should be elsewhere. We cannot predict the future and we certainly cannot find one indicator that will do all the work on our behalf. Rather, we should become skillful in combining different indicators to eliminate bad trades, reduce losses, and earn smart money. And, finally, we must bear in mind that times of no volume and no income are also fruitful periods for any individual to become a better and more prosperous trader. 


Categories
Forex Market

If You Read Nothing Else Today, Read This Report on the Tobin Tax

The economic crises that have shaken the world economy in recent years have had their origin in the explosion of the famous financial bubbles. The consequences of these economic crises have had a negative impact on the lives of millions of people. This negative impact has served as an argument for advocates of regulation and interventionism to promote policies or regulations that regulate financial markets.

That’s why in recent years, you’ve probably heard about the Tobin Tax, but maybe you’re not entirely clear: what is the Tobin Tax? How does it affect? What consequences can it have on my trading? And on my investment? In this article, I will explain what this is all about.

First of all, let’s start with the name, why is it called the Tobin tax? The Tobin tax owes its name to James Tobin, an American Keynesian economist who believed in government intervention in the economy to achieve its stability. He became known, in the early 1970s, for suggesting taxing capital flows. And this proposal is what we now know as the Tobin Tax. End. No, there is more, we continue.

What is the Tobin Tax?

As I was saying, the Tobin tax proposed by James Tobin was to establish a tax rate (tax or collection) of 0.5% on foreign exchange buying and selling operations and thus try to curb speculation after the break-up of the Bretton Woods agreements and the subsequent completion of the Gold Standard.

The original idea of this tax was to raise money at the expense of speculators, pretending to give a social approach to its acceptance. Although in reality, it already sought to curb fluctuations or volatility in the foreign exchange market during the crisis of the 1970s, after abandoning the gold standard during the government of Richard Nixon.

The proposal also envisaged taxing the purchase or sale of shares at a rate of 0,1 % and derivative transactions at a rate of 0,01 %.

Historical Background on the Tobin Tax

The direct and immediate consequence of the application of the Tobin tax in the different countries where it has been implemented has been a drastic decrease in trading volumes and the migration of investors to other markets. Little joke.

With the implementation of the Tobin rate in countries like Sweden, there was a downward movement in the volume of trading of around 50%, in London an 85% drop in the bond market and 98% in the futures market.

In the case of France, investors chose to avoid investing in the shares of the French giants or, failing that, invested in derivative products that replicate the real price, but without being subject to the imposition of the Tobin tax. The volume of the bag rushed quickly and the revenue did not even reach half of what was expected.

The Evolution of the Tobin Tax

During the crisis of the 1990s, anti-globalization movements took up the idea of applying the Tobin tax to increase their social acceptance, renaming it the Robin Hood Tax, making it one of its main demands by using it as a means of earning income for the fight against poverty worldwide.

These mobilizations led to the creation of the Association for the Valuation of Transactions and for Assistance to Citizens (ATTAC) at the end of the 1990s, in order to establish the Tobin tax as a global transaction tax.

The financial crisis, which occurred a decade later, once again targeted the application of a tax that would impact on financial institutions the costs of the crisis, because many of them were rescued with public money.

As a result, the International Monetary Fund (IMF) produced a report in which it renames the Tobin tax as the Financial Transactions Tax (FTT) and extends its scope to the purchase and sale of shares and other financial instruments. However, the conclusion of this report was that the application of this tax was not desirable, for two main reasons:

  1. Institutions could pass on the cost to consumers or final customers.
  2. It had to be applied in a comprehensive manner or else mechanisms could be created to try to evade payment of the tax.

In 2011 the European Commission proposed to the member countries the implementation of an FTT, but it was rejected. Years later, a new Tobin tax was proposed, consisting of a rate between 0.1 % and 0.25 % for the purchase and sale of shares and derivatives of companies with a capitalisation of more than EUR 1 billion, in only 10 countries: Germany, France, Spain, Portugal, Italy, Greece, Belgium, Austria, Slovenia, and Slovakia. But the only ones that applied it unilaterally were: Belgium, Ireland, United Kingdom, France, Greece, and Italy

Tobin Tax in Spain

In the Spanish case, the coalition government of Spain recently approved the implementation of a Tobin rate of 0.2% to the purchase of Spanish shares with a market capitalization of more than one billion euros, that is, all the companies of the Ibex 35 and another important group of companies of the continuous market, among them: Repsol, Santander, Telefónica, CaixaBank, Bankia, Endesa, Enagas, Aperam, Almirall, Corporación Financiera Alba, BME, Ebro Foods, Fluidra, Faes Farma, Catalana Occidente, Gestamp, Logista, NH Hotels, Prosegur Cash, Prosegur, Rovi, Dia, Sacyr, Unicaja.

Each year the Spanish Executive, through the Ministry of Finance, will publish the list of companies that must pay this tax. The publication of this list gives investors the possibility to know in advance which transactions will be affected by this rate and which will not.

Although the regulations state that the tax must be paid or paid by the broker or financial intermediary, as you may be imagining, it is very likely that these will have an impact on the cost of the final customer. These rules exclude from tax capital increases, stock market outflows, derivatives, and debt issues, both public and private.

Due to the difficulty of monitoring all transactions held throughout a session, the application of this levy for intraday was ruled out. However, the levy is maintained for portfolio changes at the close of each session. This is because the calculation of positions at the end of each session is easier, as well as identifying the holders of each type of asset.

The main objective of applying this tax is that the financial institutions that received millions of dollars from the government during the banking crisis, return the favor to society. The Spanish Government’s goal is to raise €850 million annually. We all know it will be lower.

Criticism of the Tobin Tax

One of the main criticisms of the imposition of the Tobin tax is the difficulty of differentiating between speculative and non-speculative capital movements. Many call this tax a mistake that has nothing to do with the original idea proposed by James Tobin and others go further by calling it a populist measure.

Of course, the introduction of the Tobin tax is not to the liking of the financial institutions concerned, such as Bolsa y Mercados Españoles (BME). Those most affected by the measure, fear that again the volume of negotiations that have already shown signs of a continuous fall, I accentuated its decline.

The main players in the Spanish financial market question the effectiveness of the tax to achieve the annual collection target of 850 million euros.

Another criticism is based on the fact that for effective implementation of the Tobin tax, it should be applied in all countries globally, but it is very unlikely that the most important markets will agree with its implementation. This is because in an interconnected and global market, we can easily operate from a country where transactions are not subject to this tax.

How the Tobin Tax Impacts Investors

Although this tax has been sold as a tax on large investors, in practice this tax on financial transactions will mainly be levied on small investors. Normally, the tax criterion used is the location of the broker, that is, the tax would only affect the trader that operated a broker that was in Spain. This criterion has now changed and the financial intermediary will be responsible for settling the tax regardless of the residence of the person or entities involved in the transaction, that is, it does not matter the place of residence of the person who buys the shares or the place where they are traded.

If you’re a long-term investor with few trades, you may not even notice the impact. If you’re a more active investor and you rotate your portfolio on a weekly or monthly basis, you’ll notice it in your annual results.

Investors are likely to start looking at other foreign exchanges and stocks that are exempt from this tax. Although in reality, the great attention of the investor is usually in the U.S. and not in the IBEX 35. However, the application of this tax will make Spanish actions even less attractive if it is not applied in a consensual manner in the rest of the European Union. And yet as I tell you, there’s America.

With the application of the Tobin tax and adding the existing fees, if you invest 1000 euros in the exchange we must add to the current fees 2 euros corresponding to 0.2% of the 1000 euros invested, for a total in fees of 5, EUR 95 representing a 50 % increase in commissions.

According to figures and calculations by Inverco, the application of this tax to equity investment funds will reduce the profitability of these funds by around 7.4% in the next 25 years. In the case of pension plans, it is estimated that the yield will be reduced by 5.6% in 25 years.

In short, the four main consequences that we will probably see will be a drop in the volume of trade, an outflow of capital abroad, a reduction in total tax revenue, and an increase in the interest rate as a solution to make up the profitability of financial institutions.

Again, history will tell us how the Spanish economy will be affected by the application of this tax and who will pay for it in practice.

Alternatives to the Tobin Tax

If as a small investor you want to legally avoid paying the Tobin tax, here are two options:

Invest directly in shares with a capitalization of less than one billion euros. Most companies with a market capitalization of less than one billion euros are listed in the IBEX Small Cap, but you should keep in mind that due to the high volatility of these companies you must have good risk management. You can invest in derivative products exempt from this tax, such as Futures, Options, Warrants, CFDs.

Tobin Rate for Forex and Cryptocurrencies

If you are reading this very possibly because you are a trader, so if you are trading in currencies (Forex) or cryptocurrencies you should not worry. This measure will not affect you. Nor if you trade or invest as we have said in the American market, either through shares, indices, or other instruments outside Spain. Nor if you scalping or intraday operation. Remember that derivatives are not affected by this measure. With all this information we can say that if you are a trader surely this measure will not affect you. Nor if you are an investor who does not invest in IBEX.

Categories
Forex Market

Insane Volatility: Tips for Trading Forex In a Hyper-Active Market

Sometimes currency markets can become extraordinarily volatile. In fact, any market can, depending on what’s been going on. You can be on a good bullish trend, just so a headliner crosses the wires that turn things upside down, causing massive losses. In this article, I will look at the special challenges when it comes to trading in a volatile market.

First Things First: Managing Your Risk

The first thing you need to do is to pay attention to your risk. In that case, it should be the first thing to pay attention to in any business environment. Ultimately, if you do not manage your risk, you will come out of commercial bankruptcy and lose all your capital trading. That’s always gonna be the first thing that comes to mind when you put money into an investment.

If situations continue to become very volatile, then you are considering a situation where protecting your risk becomes even more important, and then you should consider the size of your trade. For me, one of the most effective ways I’ve found to protect capital trading in a volatile situation is to reduce position. In other words, if you normally trade with 0.5 lots, then you may want to trade with 0.25 lots because of the inherent risk in a market that can move very quickly.

Understand that risk managers will also force professional traders to reduce their position. In this sense, professional traders tend to trade with much less leverage than retail traders. It is not uncommon for a professional trader to use leverage 1:6 instead of the 1:200 that many retail traders will use. Part of this is because the trader who trades professionally has an account with a lot of balance, which sometimes has millions of dollars depending on the situation and/or the bank they are working for. When you earn 5%, it means much more in that account than in a 2000 USD trading account in a volatile market.

The Trend Becomes Even More Important

When trading in a volatile market, the general trend becomes much more important. While volatile markets usually indicate some change in trend, the reality is that the long-term trend tends to be what the market is generally set. With this situation, if you are trading in a volatile market, you can want to trade only in the direction of the longer-term trend, which means you should sit on your hands from time to time. I think at this point, it’s probably best to wait for the bigger money to come in and push in the right direction, in addition to keeping your trading position smaller, because of the potential for losses.

Usually, a lot of volatility comes into the hands of fear and possible occasional traders, but when you look at a Forex card, the vast majority of the time the trend is for years. There are times when things come and go drastically, but overall, I think most of these movements end up being value propositions for those who are willing to jump into the fire. That does not mean that it should do so vigorously, it only means that the long-term trend remains largely valid. However, it must have a “line in the sand” when it comes to the longer-term trend and recognizes that a breakdown below or above that line represents a change.

Once the long-term trend changes, the overall strategy changes when it comes to transactions, but this as a rule should be something based on monthly graphs. Knowing that this could cause a lot of short-term pain, the truth is that over time the long-term trend is reaffirmed most of the time.

Sometimes It’s Best to Stay Out of It

Unless there is some kind of important geopolitical or global event, the reality is that you can almost always find a pair for trading that is much less volatile. Ultimately, many traders marry a particular pair of currencies, without understanding that they all operate the same. In other words, if you are normally a trader of the EUR/USD pair, then perhaps you should look in another market if you have become too volatile. Exactly what prevents you from changing the pair and starting to use the EUR/CHF pair? Just stay away from the too volatile currency pair, because it’s not worth it. At the end of the day, he’s simply trying to make a profit, not become a genius in a particular currency.

Higher Frames of Time

Another thing you can do when things get a little volatile is simply going to higher time frames, which will naturally make you reduce the size of your position. For example, you can usually change the graph per hour and risk something like an average of 50 pips. However, if you are forced to exchange the daily graph, you probably have to risk 100 pips on average. Despite everything, you still want to risk the same amount of money for each trade, so it is advisable to start with a smaller position for the market to work its magic over time. This will force you to focus on a more general overview and pay attention to the overall market attitude rather than the everyday noise.

Turn Off the News

You should be careful when paying too much attention to headlines, as they don’t matter. What matters is where prices go, not what a politician says in Brussels, says Donald Trump, or no one else. The markets are true, and the truth can be found in the prices. Beyond that, when things become too volatile, the analysis is much more likely to be deficient, as even the best analysis of the world can be of very little use after a few hours. You should look at the big picture in these situations and just relax.

Categories
Forex Market

Trading, HFT and Big Data – Exposing Fake News!

Just as the white SUVs are flooding our streets, “Big Data” seems to be the hot topic. While at first, it doesn’t seem hard to understand, in this article I will try to analyze the meaning of Big Data for a Trader.

Generally, “Big Data” is defined as the process of capturing, storing, processing, and transforming data into information or decisions, when they meet one of the three “V”; they cover large volumes, require Speed, and involve a variety of types and/or sources.

I prefer to define Big Data as the generalization of the use of a very powerful set of statistical and computational tools that gives us independence in analysis. In addition to the knowledge in my area of action, which allows me to construct hypotheses that I want to try, with “Big Data” I also have the tools to not get stuck with ideas in my head.

According to the Deutsche Börse Group:

“Technological innovations have contributed significantly to greater efficiency in the derivatives market. Through innovations in trade technology, negotiations in the German Eurex are now running much faster than a decade ago and knowing the sharp increase in the volume of operations and the number of quotes. These major improvements have only been possible due to continued investments in IT by derivatives markets and clearinghouses.”

The acceleration of the trading process has also reached the side of Traders. Michael Lewis, author of the book “Moneyball” (which has become known for the movie of the same name starring Brad Pitt) has written a non-fiction book, “Flash Boys”, where he describes the story of how “kids” begin to be able to trade at the fastest possible speed, not to mention near the speed of light. These guys, investing little money and using technology and big data concepts, go to war with the High-Frequency Trading (HFT) companies and the big American banks. I’m looking forward to the movie!

A major HFT-related event took place on May 6, 2010, at the Nasdaq Stock Exchange in New York, in what would become known as the 2010 Flash Crash. At 14:32, New York time, there was an extraordinary drop and rebound in the S&P 500 index. Algorithmic trading programs were chained, first in sales orders by their criteria of stop losses and then they were chained back in purchase orders – something never seen in history – it is estimated that the price variation between minimum and maximum for as little as 36 minutes was a historical record of trillions of American dollars.

I’ve heard all about Big Data, some accurate statements, and some wrong ones. But many have ceased to be true with the evolution of technologies and the very concept of Big Data. The main known barriers to the implementation of Big Data have always been the existing infrastructures in the company, the costs, the time of implementation, and the need for knowledge. With the exception of the first, the other barriers are falling with the new technologies of Big Data.

Big Data is very expensive – False – generated by the large supply of tools and by the adoption of free open source technologies, prices, previously in the sky, have dropped to levels very accessible to all sizes of companies.

It’s a computer thing – False – there has been a major transformation in the programming environments and in the Big Data and Analytics tools, making them more accessible to non-technical people interested in using them in their area of expertise.

Takes a long time to implement – False – new techniques of agile project management and job reuse lead to tempting times of implementation.

The piece that really was missing in this puzzle was training, but since already a couple of years ago, there is a relevant offer of Big Data online courses and masters on the subject.

They always ask me for examples of companies using Big Data. Creating a list of companies always scares me, because the world of Big Data gains followers daily – if I wrote a list, it’s very likely that it was obsolete by the time you’re reading it. In the trading world, there are many banks like Bank of America and JP Morgan involved in HFT. As for Spanish banks, there is very little public information on the use of HFT, however, with all the technology currently available. One would be naive if one thought that these have not raised the use of HFT in the currency arbitration and futures market for some commodities, where they have hedging positions.

In addition to HFT, some funds state that they use alternative information for their purchase and sale decisions. This information may vary but many say they use comments and sentiment analysis in online newspapers, in public CSS and RSS, in blogs, and on Twitter and other social networks. It is unclear exactly what they do, but AQR Capital Management and Two Sigma Investments claim to use Big Data in their investment decisions.

What one has to be clear about is that whatever your strategy, we are competing today with these specialized algorithms AT ALL TIMES.

In practice, in the world of trading, Big Data is providing:

Volume: Big Data shows us the way clearly to expand our strategy. Either to include more companies or portfolios to the existing strategy or to allow the creation of many strategies competing in parallel.

Variety: Big Data is allowed through algorithms to mix price history from Private API (Bloomberg or your broker) and Public API (yahoo finance, google finance) with alternative information such as CSS and RSS readers, Web scrapers, Twitter, and other social networks.

Speed: The combined use of various computing paradigms is making it possible for independent traders or small investment firms to compete for the first time in the HFT war with large banks, as described in the book Flash Boys. An example is the use of data banks in memory, in vector format, and with parallel calculations or distributed in several computers.

And that translates into:

Within a large bank, when you follow the full development flow of a strategy until its implementation, many tasks are done before and after the Trader’s intervention. The Technology Area needs to capture, collect and store the data, the methodology department usually does fundamental analysis or simulations with this data and finally, the data comes to the Trader for the creation of their strategies. When the strategy has already been designed, it is up to the Technology to prepare a prototype for the backtesting of the strategy and finally, the strategy is implemented as an automatic algorithm in production.

Using a multi-use programming language (multi-purpose programming language), for example, Python, a trader can now gradually acquire knowledge and do the work of others.

To give an example of what we are talking about from a practical point of view, within Python the problem of collecting historical price data is transformed into a simple call to the yahoo or google API or other provider using a data read command like DataReader.

The training offered at Big Data is on the rise. The war between paid and free tools has forced traditional companies like SAS and SPSS to liberalize free versions of their software or free courses of their analytics tool.

To conclude, on the one hand, Big Data tools are increasingly accessible and integrated, in the future, you can make use of the most appropriate database for the problem, whether it is structured, unstructured, on disk, in memory or distributed, almost without realizing it. Python is a new player where this homogenization is happening very quickly and it is possible to access, within the same language, several big data tools. My prediction is that languages that do not homogenize run the risk of extinction.

On the other hand, everyone is looking at the world of Analytics. Giants in the software industry are buying Analytics companies as “churros”. That is clear evidence that statistical knowledge will gain more and more relevance and in combination with data tools will be an indispensable weapon in the future, This prediction is also confirmed by all the master’s degrees in Big Data and Analytics that have already been established and are emerging every year.

But the big change is that all of the above can only mean one thing. Big data, currently, is made for the business expert and in our case, for the trader. Big Data was born with computer scientists and has attracted many statisticians. But, the clear thing for me, is that you get much better results if the business expert knows how to drive and fix the car, than the other way around.

Categories
Forex Market

What is the Best Trading Position? Part II – Trade Protection

Last time we started talking about risk management, giving you the exact number of what your risk in trading should be. In case you are eager to learn how to secure the best trading position, go back and read the first article of this series and do the test at the end. If you have already done that, prepare your pen and paper once again because we are covering key concepts that you will need to get the best possible results trading in the forex market.

Why is Stop Loss Important?

Owing to the stop loss, i.e. a specified number of pips away from the point of entry, you will always know that your trades are protected. If there is an unfavorable move and you are not there to oversee your trades or if you are simply tired of being on the watch all the time, stop loss is surely your best friend. Your stop loss will also help you determine the value of each pip and control your risk. Therefore, make sure to set up your stop loss before you enter any new trade because it is one of the most important tools you will learn to use in trading.

How Can I Set up My Stop Loss?

Here is one way to do it. In order to make proper use of stop losses, you will need to meet two conditions: use the ATR (Average True Range) indicator and use the daily chart. Pull up the indicator in the chart for the pair you wish to trade and do not change the default value (14). You will find the ATR on the left side of the indicator window under the white line in the middle. If you see a value of 0.0071, you will know that the ATR for that specific currency pair equals 71 pips. To set up your stop loss, you need to multiply this number by 1.5. Just make sure you remember that any other time frame will not give you correct numbers, so this form of protection would not work in that case.

How do I Calculate My Pip Value?

Use this simple equation to calculate the value of a pip: RISK ÷ STOP LOSS = Pip Value. Now is the time to remember the previous lesson and calculate your risk for a 50,000 USD account and a value of 0.0071 on the left side of your chart. In case you forgot, we will do it together now:

RISK = TOTAL ACCOUNT x 2% = 50,000 USD x 2% (0,02) = 1,000

ATR = 71

STOP LOSS = ATR x 1.5 = 71 x 1.5 = 106.5 ≈ 106

PIP VALUE = RISK ÷ STOP LOSS = 9.43

This is how you determine your risk, set up your stop losses, and protect your trades. Whatever you do, make sure not to deviate from this plan, especially if you are a beginner trader. While this may seem like a lot of trouble to go through, understand that you will know that you have succeeded the moment you see your losses no longer affect your account. Try to use the ATR and set up stop losses for each trade in your demo account for at least six months before you decide to start trading real money.

Part 2 Task

As always, we will give you a task to do on your own and provide you with the results in the next article of this series:

Calculate the pip value for your 50,263 USD account based on the information you can find in the chart for the EUR/USD currency pair.

The correct answers for the last task are provided below. Please, besides the answer key, read the explanations under each answer as well.

  • a, b & c

All three answers are correct because we need risk management regardless of our individual stage of development as traders. 

  • a & c

Do not get misled by a few wins here and there because successful professional trading entails consecutive and sustainable winning.

  • a & b

The first task and primary responsibility of every trader is to learn why a certain trade did not go as planned. The worst mistake one can do is just to keep trading regardless of poor results. This is the approach that leads to losses and blown accounts.

  • a, b & c

All of the options are correct since forex trading is not only about securing wins but making sure that losses are controlled. We can do that after learning what went wrong in the past and how we can fix those issues.

  • b & c

Risk is never about one number alone. Risk entails a series of tasks and strategies that we are still learning about in these articles. Securing the best position will mainly depend on how you manage your risk too, so stay tuned until next time when we will be sharing another set of invaluable tips and tools.

Watch for Part III to be posted tomorrow!

Categories
Forex Market

What is the Best Trading Position? Part I – Risk

Let’s say you are interested in starting to trade for the first time but you are not sure what exactly you need to do so as not to mess up all your entire investment; or, alternatively, you could have already tried trading, but all your results are far from satisfying. In any scenario you might be living at the moment, you need those key tips to make a real difference in your life. You feel tired of vague ideas, failed attempts, and hours spent on futile research. If you are that practical type of person who wants to grow his/her experience, we are offering you a never-seen-before series of educational texts that will provide you with constructive and applicable advice you can immediately start applying as you read. Whether you are an absolute beginner, a demo trader, or a professional one, you will finally know what position to take in trading currencies to see actual benefits from investing your time and money. 

Why should I care about risk management?

Risk management is a topic that we use for so many different areas of life and work, but you may be wondering why and how you should use it in trading. First of all, you must know that it’s the one thing where you must start – it’s your foundation and the basis of any success you may have in the future. The way you manage your risk is equivalent to how likely you are to succeed in forex. Without proper risk management, you are setting yourself up for a big failure, and while there may be thousands of articles that may scare you to death with their lists of dos and don’ts, we actually really want you to get it right from the very beginning. That is why your number one lesson is to start with risk management and slowly build your position along with learning how to protect your assets.

Where do I stand with my risk management skills?

Let’s say that you have 50,000 USD in your (demo or real) trading account. You start trading with whatever skills and knowledge you have obtained so far but, unfortunately, take a loss. Your account suffers tremendously, and it is only expected that this one loss should turn into a series of misfortunes. Now, individual storylines may differ quite a bit, but we know that forex is primarily about preventing losses, even more so than winning. Whether you experienced one severe loss or taken several ones in a row, you are now in a desperate situation, as you are left with 40,000 USD in your account. You are now impatient to fix the mistake you made, so you start behaving recklessly and invest even more, hoping that you will somehow make up for the previously lost 20% of your account. This way, unfortunately, you are only pushing yourself further down in that hole, still hoping for an extraordinary return that will miraculously get you out of that rut.

As a result of your lack of education on risk management, your account decreased to 25,000 USD, and you are officially missing 50% just to get back to where you started. However, this would require skills that not even the most successful forex traders have, and even if you did somehow master forex trading skills all of a sudden, you would still need years to make up for the loss you took before. If your stream of thoughts resembles what we wrote here, you should truly use this opportunity to the best of your abilities to learn everything you can about forex risk management.

What should I do if I take a major loss?

Well, since we have already established what impact one bad decision can have on your account, what do you believe the best strategy here is – a) invest more immediately, b) wait for a lucrative opportunity and then enter a new trade, or c) stop and learn how to trade? If you chose the last option, you guessed it right. Your money is much better off stashed somewhere safe until you learn what we are going to share in this article. Whether you are demo trading or trading real money, you absolutely must understand where the glitch occurred and why you lost a portion of your account like that before you proceed with another trade.

If you, however, find this approach to be silly or cannot see its purpose, please read the previous paragraph again. Although many successful forex traders admit to having lost everything they had before finally learning how to trade safely, there is no need for you to go all the way down to zero. All wealthy people first think about minimizing their risk regardless of their market of choice, so why should anyone else with an average income even consider rushing in before securing their position? Now is the time to take a pen and paper, and start taking notes.

What is my risk? 

It is now a well-known fact that 90% of traders lose their accounts within the first several months of trading, and the only way for you to avoid that fate is (prepare your pen) to write down this number – 2%. This number translates as the entire percentage of your account that you can let yourself lose at any moment. Therefore, with a 50,000 USD account, your 2% risk amounts to 1000 USD. Next time when you wonder what your risk is, just do the math and calculate what 2% means in relation to the amount of money you have in your account at that particular moment. 

Luckily, if everything else is done correctly, your losses should rarely come close to the 2% risk anyway. Still, we would like to make sure that you understood the importance of learning about risk, so we invite you to complete the following exercise.

Well done! Your first lesson is over! Know you know where to start, but be mindful of the fact that this is only the beginning. The best position you can take in trading currencies is a complex topic but, at the same time, it is not something that you will not be able to manage. Stay tuned because next time we will be explaining how you can secure your position following other important tips and figures that must always be incorporated in your trading to see the best results. 

P.S. You can check your answers in the next article about the best trading position. Watch for part two to be posted tomorrow! 

Categories
Forex Market

COVID Crisis: USA Vs. Europen Market Recovery Battle

COVID-19 has without a doubt taken a toll on markets around the world. The United States and Europe, in particular, are battling to be among the first to recover some sense of normality. Which will prevail? Here’s what we have to say on the matter.

The US market is recovering faster than the European market. In particular, if we compare with the absolute high of mid-February, we see that the US market, measured through the SP500 index, is -16.79% below that high. On the other hand, the European market, measured through the DAX30 and Euro STOXX 50 indices, to take two examples, remains -22.02% and -24.24% below the maximum, respectively.

This divergence in the response of the US index to European indices is, in principle, unexpected. Without entering into data that the reader should already know in detail, it is known that in the European countries most affected by COVID-19, including Italy, Spain, Germany, and France, the curves of cases and deaths per day have already shown, at the time of writing this article, a clear setback.

The response of the US index to European indices is, in principle, unexpected.

While countries such as Italy and Spain are accused of having delayed and failed in their response to the virus, the truth is that the curves of new infections have stopped growing, entering a phase of recession, product of the strong measures of social isolation promoted in these countries.

This is not the case in the USA, where many analysts believe that the government’s response was even worse, and where both the new cases and the number of daily deaths, have taken much longer to give in, and continue still, albeit more slowly, to rise.

This temporary divergence in impact and response to COVID-19 would lead to the conclusion that the same should have happened with the impact on equity markets, that is, Europe should have anticipated its recovery to the United States. However, the opposite occurred, as can be seen in the chart below (in green the S&P 500 index).

“This temporal divergence in the impact and response to COVID-19 would lead to thinking that the same should have happened with the impact on equity markets… However, the opposite happened.”

Of course, the explanation for this is far from unique, and it would be a mistake to pretend to give an explanation by ignoring the interconnection that exists between the world’s financial markets today, which does not make it possible to study one case in isolation from others.

Even so, we believe that the lower impact and faster recovery of the US stock market vis-à-vis Europe is basically due to the different response of its central banks. In particular, the EDF took drastic monetary policy measures very early on, while the response of the European Central Bank (ECB) was later and more modest. But let’s look at it in detail. We believe that the lower impact and faster recovery of the US stock market vis-à-vis Europe is basically due to the different response of its central banks.

Everything must start from seeing the differences with which the ECB and the Fed faced the crisis for COVID-19. In the case of the ECB, the benchmark interest rate was set at 0.25% since 2016, its historic low. In particular, after the crisis of 2007-09, the ECB had to continue to cut its reference rate several more times in subsequent years, among other cases, to assist countries such as Spain, Portugal, and Greece, as well as countless other problems it had to face.

Let us remember that German bond yields, as well as those of many other Eurozone countries, have been negative for years. This meant that, by February 2020, in the face of the COVID-19 surge, the ECB had very limited room for maneuvering in its monetary policy.

Different was the case in the United States, where although the financial crisis of 2007-09 forced the Fed to cut its rate to historic lows, from 2016 to 2019 the rate could be increased successively. This fact, let us also recall, had inspired innumerable criticisms from Donald Trump towards Jerome Powell and the Fed, indicating that the Fed had made bad decisions by not cutting its rate, as while other countries in the world could place their debt (sell their bonds) at negative rates, a positive rate was still payable in the United States.

This difference between the starting position of both central banks ended up being decisive in our opinion, as it allowed the Fed to take drastic measures in the face of the COVID-19 crisis and the ECB could not do so.

“Different was the case in the United States, where although the financial crisis of 2007-09 forced the Fed to cut its rate to historic lows, from 2016 to 2019 the rate could be increased successively.”

As we know, very early on in March, the Fed was able to cut its benchmark rate by 50 basis points in the face of the sharp decline in equity markets. This move, while failing to contain the falls, was a sign that the Fed was ready to act.

-On March 15, again as an exceptional measure outside the FOMC meeting schedule, the Fed cut its rate again, this time directly to zero.

-On March 23, in addition to the previous measures, the Fed committed to an asset purchase plan to expand its balance sheet (quantitative easing) by a total amount, in principle, unlimited funds, an unprecedented measure.

Closer in time, on Apr 9, the Fed announced a new plan to inject up to $2.3 billion into the economy, including the purchase of state or municipal bonds. As is clear, the Fed’s monetary policy response was swift and drastic and adds to the fiscal policy that was also conducted in the United States with the same characteristics.

The Fed’s monetary policy response was swift and drastic and adds to fiscal policy. The ECB’s starting position was very different, with its interest rate almost at zero, it had no room for further cuts. All the ECB’s actions with regard to the crisis caused by the COVID-19 were limited to a single intervention, on 18 March, with the announcement of an asset purchase plan (quantitative easing) for 750 billion euros, substantially lower (one third) the one announced by the United States. The lack of further action by the ECB has been strongly questioned by analysts.

“The ECB’s starting position was very different, with its interest rate almost at zero, it had no room for further cuts.”

We believe that the criticisms are adequate, but it is often omitted to consider that the starting situation with which both central banks faced the COVID-19 crisis was clearly different. If we look at the positive side, there is indeed one thing to be recognised about the ECB’s only intervention, it seems to have been with timing or decision of the right time. The starting situation with which both central banks faced the COVID-19 crisis was clearly different.

As we know, the intervention is 18-Mar, which practically coincides with the minimum of the stock markets. In other words, we see that the ECB had far fewer tools at its disposal than the Fed, but it used them with better judgment, at least in the decision of the moment.

In conclusion, US equity markets have suffered smaller declines than Europeans and have recovered faster, although behind this is greater Fed intervention (at a higher cost of resources for that central bank).

The ECB was more modest, with only one intervention, but more precise at the time of making it, which implies a much lower cost of resources for that central bank. What seems very clear is that investors believe that the US economy has a greater capacity and potential to face this extreme event compared to Europe, which, while hit by the pandemic at first, The next few weeks will be dramatic for America.

The United States starts from a better baseline, good employment indicators, and modest but acceptable growth, and has the institutional capacity to react more quickly to problems. On the other hand, the Eurozone is based on a vulnerable situation, a stagnant economy and high levels of unemployment for the level of development, The same institutional complexity that has not allowed it to re-emerge from this macroeconomic situation is what leads to a lack of responsiveness.

“The United States starts from a better baseline, good employment indicators, and modest but acceptable growth, and has the institutional capacity to react more quickly to problems.”

Only the ECB was able to carry out measures, because of its independence, but with little room for maneuvering. On the other hand, the main European leaders have not coordinated powerful measures to get out of this extreme situation. For all these reasons, once again the North American stock market is better positioned to recover in relation to its European counterpart and this has been reflected by the market, unless once and for all the Eurozone wakes up.

Categories
Beginners Forex Education Forex Market

Which Factors Truly Impact the Forex Market?

To be a successful forex trader, you need to understand what affects the value of a currency and what can cause it to change. The following factors have a direct effect on the value of currency for a country:

  • Inflation Rates
  • Interest Rates
  • Capital Flow Balance
  • Government Debt
  • Trade Terms
  • Political Factors
  • Employment Data

If you understand each of the above factors, then you’ll be able to make better predictions about the market. We will explain each factor in more detail below.

Inflation Rates

Inflation refers to the general increase in prices over time and fall in the value of purchasing money. One of the main driving factors behind a currency’s exchange rate is its country’s inflation rate. Japan, Germany, and Switzerland are a few examples of countries with low inflation rates.

-Countries with higher inflation will see decreases in the value of their currency compared to the currency it is being traded against.

-Countries with lower inflation typically see an increase in their purchasing power compared to other currencies.

Interest Rates

Interest rates tie in with inflation and forex rates. Increased interest rates raise the value of a country’s currency because they attract more foreign capital. Investors gravitate towards economies with higher interest rates because they will increase the value of their returns. This creates more of a demand for the currency and increases the exchange rate.

Capital Flow Balance

This revolves around several different factors:

  • Exports
  • Imports
  • Debt
  • Retail Sales
Government Spending

If a country has a deficit, it means that they are spending more on imports than they are making with exports. This causes depreciation in value for that country’s currency. The capital flow balance is simply the ration of imports vs exports in a country. China would be a prime example of a country with a higher export rate, which makes its currency more attractive to forex traders.

Government Debt
This involves all public or national debt that a country’s government owes. Countries that are in debt are more likely to experience inflation. If investors know that government debt is predicted, they will sell their bonds, which results in a decrease in that currency’s value. An investor might look at the government’s overall debt over a few years to decide if it is worth investing in that currency.

Trade Terms

Terms of trade are the ratio of export prices vs import prices. If the number of exports is greater, then the value of the currency increases because there is a higher demand for that country’s currency. If there are more imports than exports, the opposite occurs.

Political Factors

Investors prefer stable countries and those countries pull investors away from countries that experience more uncertainty. Being a more politically stable country results in an appreciation of the currency’s value while being less stable results in depreciation. Elections, financial crisis, policy changes regarding money, and wars have a direct effect on the currency’s overall value.

Employment Data

Employment rates can give investors an overall idea of how the economy for a given country is performing. High unemployment rates signifies that the economy is not doing well or growing with the population. This would lead to depreciation in the currency’s value as investors pull away from investing in that country.

Conclusion

Several different aspects of a country’s economy can influence the value of their currency. Investors are generally looking to invest in politically stable countries with high employment rates and less government debt. Higher interest rates and low inflation rates are other ideal conditions. It is important for forex traders to understand what drives a currency’s price so that they can make more accurate predictions about the market.

Categories
Forex Market

Which Global Trading Session is the Worst? The Answer Just Might Surprise You…

FWhile the forex market offers the opportunity to trade 24 hours per day, smart traders know that certain times just aren’t prime for trading. Professionals make the most of their time by trading during the best market sessions, then they choose to sleep and take care of other matters during lame market sessions or other special times when the market just isn’t ideal for trading. So, which times are best for forex trading and when should you avoid trading altogether? Stay with us to find out.

The Best Times to Trade

The major time zones dominate the forex market: Asia, Europe, and the United States. When time zones overlap, it creates one of the best market environments for forex traders. Overlapping time zones occur:

  • In the New York and London sessions (12 pm GMT – 5 pm GMT)
  • In the London and Asia sessions (8 am – 9 am GMT)

If you trade during these times, you can take advantage of the market’s high liquidity, volatility, and the best price action. Trading can also pick up on certain days and lag on others. On Mondays, after the overlapping of the New York and London sessions, things tend to pick up and the market reaches its peak mid-week, around Wednesday, before slowing back down in time for the weekend.  

The Worst Times to Trade

If you feel like you need to trade as much as possible to be productive, you’ll be happy to know that there are times when the market should simply be avoided. 

  1. Certain weekdays: To be specific, Monday mornings start off slow, before picking up after the New York and London sessions overlap. It’s a good idea to start trading around this time, rather than first thing Monday morning. After the market reaches its peak mid-week, it also tends to slow down around Thursday and Friday, causing many traders to finish up for the week before the London sessions ends on Friday. 
  2. Weekends: The market is incredibly slow on weekends for pretty obvious reasons, as most traders take some time off on Saturday and Sunday. If you can’t stand to sit around all weekend, you could use the time to check news data and check other factors that might affect the market in the following week. 
  3. When major news releases are expected: You can use an economic calendar to keep an eye out for major news releases. These events can cause the market to become extremely unpredictable, which causes many traders to simply avoid trading altogether during these times. These events often include financial reports, economic data, political updates, etc. Keep in mind that some of these events will have a bigger impact on the market than others. 
  4. During certain holidays: Just like with weekends, most forex traders take certain holidays off from trading, therefore, the market slows down, and there just isn’t much action. Christmas is one of the main holidays where traders are not working, alongside New Year’s Eve and day, and certain holidays during the summer, like Independence Day, Memorial Day, Labor Day, and so on. 

Summary

All trading sessions were not created equally, and savvy traders know when NOT to trade. The market is best for trading when certain sessions overlap and from Monday afternoon through the middle of the week. It’s a good idea to close out positions on Fridays and to refrain from opening any new positions until after the weekend has passed. You should also avoid the market if major news releases are expected to hit and during big holidays, like Christmas, summer holidays, and New Year’s.

Categories
Forex Market

The Top 8 Must-Know Features of the Forex Market

There are more reasons to have exposure to the forex foreign exchange market beyond currency diversification. Once you do your homework, you will realize that the foreign exchange market is among the best-performing assets for traders and investors. This guide will explain what is the forex market and will present the 8 main features of the forex market that every trader should know.

What is the Forex Currency Market?

The foreign exchange, foreign exchange, or forex market is where currencies are traded. Coins are important to most people around the world, whether they realize it or not because coins must be exchanged for trading and business. If you are living in Brazil and want to buy cheese from Europe, be it you or the company where you buy the cheese, you have to pay the Europeans for the cheese in euros (EUR). This means that Brazil, the importer, would have to exchange the equivalent in value of the Brazilian Real (BRL) in euros. This applies equally to travel. A Brazilian tourist in the USA cannot pay in BRL to see Wall Street because it is not the locally accepted currency. As such, the tourist has to exchange all the BRL for the local currency, in this case, the American Dollar, at the price that is in the market.

A unique aspect of the foreign exchange market is that there is no central market for foreign exchange. Rather, forex trading is handled OTC, this means that all transactions are carried out with computer networks between traders spread around the world, instead of a centralized market. The market is open all day  (24 hours a day), 5.5 days a week, and the coins are traded globally in the world’s leading financial centers such as London, Tokyo, New York, Frankfurt, Zurich, Singapore, Hong Kong, Paris, and Sydney- across all time zones. This means that when US trading day ends, the forex market starts in Tokyo and Hong Kong. As such, the exchange market can be extremely active at any time of the day, with quotations constantly changing.

Here we mention the 8 main advantages of the Forex market that make it one of the most attractive markets for investors and traders globally.

Characteristics of the Foreign Exchange Market

  1. The best Risk/Benefit potential

The foreign exchange market offers one of the best opportunities of any financial market in terms of risk/profit, YES ( and a large YES) you know how to exploit it. The availability of forex leverage means the use of borrowed funds to control large blocks of money and thus magnify the gains and losses, creates an unparalleled potential to make profits for those with limited capital YES(and, again a great YES) learn how to handle the risk of loss. Let’s take an example, with leverage 1:100, 1% move means a 100% gain. It also means a 100% loss.

This allows us to make substantial gains in small movements in prices. However, as mentioned above, this means:

  • For $1 risk in your account, you can control $100.
  • For $1,000 risk in your account, you can control $100,000.

Many of the following articles talk about how to minimize the risk of large losses while maximizing the chances of making a profit. That involves learning to cut down on lost transactions on time and letting the winning transactions run so that you can make a profit even if you’re down on most of your transactions.

  1. The most flexible hours

The exchange market works continuously for 24 hours, 5.5 days a week, from Sunday at 5:15 P.M. EST until Friday at 5:00 P.M. EST. So, for those who work or have family commitments, they can negotiate a fully liquid market at the time that is most convenient.

  1. The lowest costs to start and operate

Forex trading is among the financial markets with the lowest cost to start and operate in terms of time and money, referring to the capital to operate, training, and equipment to operate. Like most markets, you don’t need thousands of dollars to get us started. This is why, at Forex, we can perfectly trade with high leverage (borrowed money), usually 1:100 or sometimes more.

In theory, you can usually start with as little as $100. However, you will learn that you can reduce risks and be more likely to make a profit with at least a few thousand dollars (or its equivalent) if possible. As we will see later, small forex positions that are available like mini and micro allow traders with more limited funds to trade smaller positions, keeping the share of risk capital at acceptable levels. More about this later.

Training and cost of equipment: Forex brokers typically provide fully equipped platforms and data sources for free, and the best forex brokers offer an extensive amount of free training and market analysis files. With online brokers, traders usually keep a minimum or minimum transaction volume balance to obtain quality charts and platforms from their brokers or access worthwhile research.

Free practice accounts: Even better, they typically offer practice with all the real circumstances, or, demo accounts that allow newbies to simulate much of the trading experience and practice with virtual money until they are ready to risk their capital.

Low transaction costs: Most forex brokers do not charge fees, commissions, or hidden charges. They earn money in the difference, called the spread forex, between the purchase and sale price, typically a few tithes, called pips, of the price. Depending on the size of the negotiated lots, a typical spread of 2 pips, 4 pips will be the total to open and close a position, which can cost between $0.40 and $40. Transaction costs are usually competitive when compared to online stock brokers.

  1. The exchange market offers the best liquidity

A liquid market means you have many sellers and buyers. The more sellers and buyers there are at a given time, the more likely it is that you will get a market price just when you buy or sell. The more liquid it is, the less likely a few insignificant orders or players will move prices in a wild and unpredictable way.

Indeed, contrary to the stock market, even the biggest players would have trouble manipulating the price on the main exchange pairs beyond a few hours. There are 2 exceptions to this, a few crooked central banks and Forex brokers. In reality, dishonest brokers are easily identified and it is easy to avoid with some investigation, and the risk of a central bank intervention is usually known or discovered promptly after the first incident, making markets vigilant. The more liquidity a market has, the easier it is to make a profit.

Prices are more stable and fairer, and less related to sudden and unpredictable movements. Generally, you should avoid trading in illiquid markets, except rarely when you’re trying to enter into bargain-price positions offered by those desperate to close a position. The volumes of foreign exchange markets dwarf those of equities. The latest estimates report that the average daily forex volume was around 4.71 trillion, of which retail traders represent 1.5 trillion (USD). That is the importance of the foreign exchange market, that huge volume, circulating 24 hours a day, means abundant buyers and sellers at any time of the day. That means it’s much more likely to get a fair price no matter when you sell or buy. That means you rarely see that you can sell only part of your position.

  1. Advance warnings of changes in other markets

Foreign exchange markets generally react to changing conditions before other markets, providing a valuable warning of possible changes in trends. As we will learn later, certain currencies tend to move in the same direction as industrial stocks or raw materials, and others tend to act as safe-haven assets like bonds. When these correlations are broken, this can also be a warning of a change in the direction of other markets.

  1. There is no centralised exchange with specialists maintaining the monopoly power to regulate prices

In the vast majority of stock markets, the largest specialist is a singular entity that serves as a buyer and seller of last resort, which controls the spread, which is the range between the purchase price and the selling price of a share. In theory, they must be supervised and regulated in order to avoid them from abusing the be able to manipulate prices at the expense of the public, specialists are experts in knowing when they can manipulate prices to make you buy more expensive or sell cheaper. In forex, there is no specialist to regulate the individual prices of currency pairs. Rather, there are multiple currency centers and brokers that are competing for your business. Although lack of centralisation complicates regulation, competition and easy access to price information have resulted in competitive quotations.

  1. There is no rebound rule: Just as it is easy to win on a bearish market, it is easy to win on a bullish market

Just as it is easier to row with the current than against it, it is easier to win by negotiating in the direction of a market trend. Unlike stocks (and other financial markets), in forex, it is as easy to win from the bottom markets as bullies. This is a huge advantage in the forex exchange markets. During an upward trend, when prices are rising, most traders go long, which means they buy an asset in the hope of selling it at a higher price. They’re trying to buy cheap and sell expensive, the classic way that people think is to invest.

During a downward trend, when prices are falling, it is easier to win by trading with the downward trend. So, the more sophisticated traders try to take advantage of the bearish trend and sell short; that is, sell borrowed shares in the hope of buying them in the future at a lower price, to return them and earn by difference-For example, Sell loaned shares at $100 a share, buy them at $70, return them to the broker, and pocket $30 a share. However, most stock exchange centers are controlled and regulated by those who have an interest in keeping stock prices high with restrictions and high sales costs.

  1. Forex need not be riskier than other markets

Forex has earned a reputation for being overly risky due to a combination of:

  1. A high failure rate due to novice forex traders who failed to do their homework and know the risks associated with the high leverage usually used in most forex trading.
  2. Brokers who do not provide us with minimum training to deal with the risks of using leverage. But, you can manage and reduce risks.

There are:

-Brokers, which allow you to adjust to leverage to what you can handle, will provide you with mentoring at an appropriate level.

Ways to trade forex without levers, which are no more risky than an exchange-traded fund (ETF) or a share.

-A variety of strategies to reduce risk in Forex trading, as well as new instruments to make transactions simpler and safer.

As we will see later, making money trading forex can be easier than in stocks and other more traditional asset markets, particularly bear markets. However, you need to do your homework, especially if you do or will do leverage trading, which adds risk and benefit. Part of the task is to learn simpler and more conservative techniques to make it easier to be successful in forex than with those instruments that are used more commonly. Until recently, there was not a single source to learn this more sensitive and conservative forex. No more. This is the only source for bringing these methods together in a single collection of items.

Understanding what is the forex currency market and what are the 8 main features of the forex market, as you have seen, is very important.

Categories
Forex Market

What Is the The Theory of the Dollar Smile?

In times of recession, the US currency acts in the same way. The global economy is cyclical. And whether in periods of GDP expansion or recovery, the US dollar allows other competing currencies to take the lead, but in times of recessions, the dollar grabs the blanket.

The main reason is that the US economy is too important and the dollar plays a major role in international payments, gold and foreign exchange reserves, Forex trading volumes, and cross-border loans. A global recession makes investors forget the influence of European macro statistics on the euro rate or the influence of the Bank of Japan’s monetary policy on the yen rate, the pressure of political risks on the exchange rate of the pound sterling. All eyes are on a single coin. The US dollar.

Interestingly, the dollar behaves very similarly in the course of recessions, and this may have become the beginning of the dollar smile theory, which was developed by Stephen Jen, a famous currency strategist for Morgan Stanley. There are three obvious steps in the dynamics of the USD index:

– The Dollar Is Actively Bought Since the US Economy Is Very Stable.

– USD is sold in the midst of the Fed’s aggressive monetary expansion.

– The dollar is bought back amid expectations that the US GDP will recover faster than other countries’ GDP.

As a result, a smile-like image appears.

Let’s look at the dynamics of the USD index in more detail. In the first stage, the dollar is in high demand as the United States economy is strong. It looks better than others, increasing demand for US stocks and bonds and leading to increased investment flows. In 2019 and early 2020, the USD index actually grew in the midst of trade wars, which are the reason for an impressive rebound of the S&P 500 and high demand for treasury bonds.

The first stage always ends with a correction of US stock indices that ultimately makes the bearings the dominant force in the stock market. The dollar manages to reach its peak, “the left side of the smile”, as investors prefer “flight to quality”. It acts as the main safe-haven currency. At the end of February, due to the coronavirus, the S&P 500 moves to bear territory in the shortest possible time, 16 days. The correlation between the stock index and the USD index becomes an inverse relationship. In the first phase of the previous global economic crisis, the dollar consolidated at 24 percent from March to November 2008.

In the second stage, which Stephen Jen decided to call the “smile fund,” there is a sale of the dollar due to the Fed’s aggressive monetary expansion. Cutting the federal funding rate to near zero, unlimited asset purchases, and the White House’s large-scale fiscal stimulus reverse the bearish trend of the S&P 500 at the end of March. Increased demand for risky assets contributes to the closure of long positions on the green note. A similar situation occurred in the last months of 2008, when the Fed through aggressive monetary expansion, including the launch of QE of $700 billion, tried to reverse the bearish trend in the US stock market and bring USD fans to a fixed point. For a while, there was even a sense that it did: the USD index fell in December.

In the third stage, the dollar rises again, as investors begin to believe that the US economy will recover faster than its foreign counterparts. US stocks seem cheap, while low borrowing costs, the Fed’s ultra-soft monetary policy, that gradually recovers GDP and hopes that corporate earnings growth will rekindle the interest of non-residents in US assets.

So, if we follow the dollar smile theory, it’s time to buy the dollar. At the same time, it is not the fact that the US economy can recover faster than China’s global GDP, and the Fed’s strong desire to prevent the strengthening of the dollar from seriously changing the rules of the game.

Categories
Forex Market

Forex Liquidity and It’s Impact on Strategy Selection

Liquidity is often confused with volatility, but both are different concepts. A liquid currency is an asset that can be exchanged very quickly for another type of asset. We will always find many buyers and sellers in the liquid market and consequently, the spread will be very small here. But as soon as some important news is published, buyers or sellers disappear from the market, and the currency changes from liquid to volatile. However, there is no strict inverse relationship between these terms. In this summary, you will learn more about this, as well as what liquidity is, what it depends on, and much more.

What market is the most liquid? It is logical that the less liquid markets are those of antiques and collectibles, where the turnover of capital is relatively small and, more importantly, few participants. Stock and foreign exchange markets are different. The stock market is believed to be more liquid, at least because the turnover of the OTC currency market is almost impossible to assess accurately. But can you buy a stock in two clicks with 10 US dollars? And a currency? That is precisely why I believe that the liquidity of the foreign exchange market is more attractive to a low-capital investor.

In this article, you will learn:

*What is the liquidity of a currency and why a trader needs to know about it.

*What is the difference between a liquid currency and a non-liquid currency. Factors that affect liquidity.

*Strategy and liquidity. How can we choose a currency pair for a particular type of trading system.

The concept of “liquidity” can also be easily found in the financial results of companies. It means assessing the company’s ability to pay its obligations quickly. Liquidity ratios are an aid to assessing the solvency of a legal entity. We can comment on this issue separately (if you are interested, leave a comment), but this summary will focus on currency liquidity.

Use of Liquidity and Market Volatility in Strategy Building

The liquidity of one currency measures the possibility of exchanging rapidly one currency unit for another. The faster it can be done, the more liquid the currency unit is. Freely convertible currencies are considered the more liquid. The lower the country’s share of the global economic space, the greater the “regulation” of the domestic market, and the manual control of the economy, the lower the liquidity of the currency.

Simple analogy. You have US dollars on your hands. You can always quickly find someone who is ready to exchange them, for example, for euros, because both currencies are traded worldwide. You can also change them with the same ease again. USD and EUR are very liquid coins, just as the EUR/USD pair is a highly liquid pair. You can also buy Venezuelan bolivars with dollars. The country goes through hyperinflation and will gladly sell you the national currency. But then you won’t find buyers and will be forced to sell it for a penny. Bolivar is a low-liquidity currency.

In a highly liquid market, there will always be a relatively equal number of buyers and sellers (or an equal proportion of supply and demand). Liquidity reflects the interest of market participants in both the absolute number of participants and the volume of transactions per unit of time. When liquidity is very high in a market, the faster goods can be sold/purchased, and the greater the volume of transactions possible.

Simple analogy. There is a market where there are 10 vendors, each ready to give 5 euros. The buyer needs 45 euros, the market volume is 50 euros (10*5). For the buyer, this market is very liquid. If there were 3 sellers, and each would be prepared to offer 15 euros. This market can be called highly liquid, as supply and demand satisfy each other. Suppose there are only 1 buyer and 1 seller on the market. The buyer wants 40 euros, but the seller only has 10 euros at the current price. The buyer is forced to raise the price or wait for other sellers. It is a low liquidity market.

Traders often confuse the concept of liquidity and volatility. Volatility is the extent of price changes per unit of time. In a market with excellent liquidity, prices do not have very large fluctuations in one direction or another, as purchases and sales are made almost instantly at satisfactory prices. Price moves smoothly in small steps. Conversely, a low-liquidity market has frequent price spikes.

High liquidity does not mean high volatility. A high-liquidity market is characterized by smooth movement, while in a low-liquidity market the shares of large individual players can bring chaos to the movement. Why do you advise not to operate during the news outing? Because any news is subjective and liquidity providers prefer not to open operations. The loss of liquidity generates an increase in volatility (increased amplitude), a situation in which small volumes of transactions, even small amounts, can influence price.

Differences Between Liquidated and Non-Liquidated Currencies

*Small spread (the difference between purchase and sale price). If the coin is not attractive to buyers, the seller will be forced to lower the price until a buyer wants to buy it.

*Free access to information. If liquid coins are attractive to traders, so are analysts, news agencies, etc. You can find information about non-liquid currencies mainly in the original sources.

*Formation of the contribution market. Highly liquid currency quotes are defined by the supply-demand ratio (floating exchange rate). Illiquid (illiquid) currencies are often strictly regulated by central banks.

*Economic development. Low-liquidity currencies are the currencies of developing countries.

*Liquidity tends to change. Despite the fact that more liquid pairs are considered freely convertible currencies, a possible situation is when the price of a particular asset falls but cannot be sold due to a lack of buyers.

Liquidity on Forex Depends On…

*Supply and demand volumes. Large trading volumes provide the currency with a constant supply and demand. If there are, for example, few buyers in the market, the seller is forced to place a lower price to have buyers available or expect. The fewer participants negotiate, the less liquid the currency.

*Session. Trading activity, and the liquidity of the Forex market, is to some extent defined by the trading session. For example, the largest number of operations in the Japanese yen is observed in the Asian session, when in the region it is day. If we talk about the currency market in general, the least liquid in the Asian session and the most liquid in the European session.

*Key factors, including holidays. News, press releases, speeches by representatives of central banks, force majeure: all this affects, to a certain extent, the volume of trade, which also means in liquidity. The liquidity of the currency is also affected by trading days. For example, on the eve of holidays (or the holiday season), trading volumes are reduced and liquidity along with them.

*High liquidity currencies are EUR, USD, JPY, CAD, GBP, AUD and CHF. If we talk about the liquidity of currency pairs, these are all previous currencies paired with the USD, although opinions differ here. In some sources, the GBP/JPY pair is also considered highly liquid

Interesting fact. The 2008 crisis showed how liquid currencies can quickly become volatile. In addition, investor dissatisfaction with the growing US public debt that we see more and more is a time bomb. According to one version, USD liquidity may falter and commodity currencies in the foreground will emerge as the most stable (least exposed to demand and volatility). These include the Norwegian krone, Australian, New Zealand, and Canadian dollars.

Choosing a Trading and Liquidity Strategy

Should I consider the level of liquidity when creating a strategy? The question is not so clear. I will try to put the same thing in other words. Small traders often follow the trend, that is, they follow the majority led by market makers. Which market is profitable for big players in terms of liquidity? There are two versions:

High liquidity market. Excessive liquidity will serve as a buffer for the sudden formation of price spikes. In other words, large volumes liquidate sudden price spikes. This market is considered quieter because it is interesting for market makers who are used to stable pragmatic trading.

Low liquidity market. The condition when a small number of traders remains in the market is called a thin market. For example, during the holiday season or holidays. For large capitals, this is a gold mine. The less liquidity, the easier it will be to change (need less money) the price in the right direction, taking it to key levels (disrupting other people’s stop orders).

Everything depends on the situation. It is very logical that liquidity levels may affect the choice of a particular strategy, but they do not actually affect it as much. For example, the EUR/USD currency pair is considered very liquid and with average volatility. When the market is calm, it is very suitable for intraday trading and scalping, but during the news outing, its expected volatility increases sharply, thus eliminating most scalping strategies.

What is Liquidity in a Currency?

Here you can see that, despite the high liquidity in short terms, in long-term periods, the amplitude of the movement is quite large.

Characteristics of highly liquid currency pair trading:

  • Liquid currencies require the utmost attention and the ability to make decisions instantly.
  • The time period is usually short: M5-M30, hourly intervals are used less frequently.

A trader must understand microeconomics and macroeconomics, know where to get some information quickly, understand the economy and policy processes of developed countries, and know what will have the greatest impact on the exchange rate.

Highly liquid currency quotes are more susceptible to the manipulation of large capital. The larger the size of the market and the smaller the participants, the greater the possibility of creating the right news fund using the right media, analytical summaries, or statistics.

Low-liquidity currencies are suitable for two categories of traders: lovers of long-term strategies and those who trade in Forex for excitement and pleasure, so the probability of winning is low. While here you don’t need to constantly monitor the news.

Liquidity is changing, so there are no liquidity calculators. But there are volatility calculators that show the current range of price changes.

What is Liquidity in a Currency?

This calculator can provide indirect information about liquidity. For example, low volatility may indicate high liquidity at this time. On the other hand, this can mean a plane, that is, the absence of negotiation in this pair. In other words, the volatility calculator does not allow for unequivocal conclusions regarding the level of liquidity, but it can serve as an auxiliary tool.

Conclusion. Liquidity is the ability to quickly exchange one asset for another. Low-liquidity markets are not protected against sudden price jumps. They may be of interest to investors who tend to take higher risks for high returns. The main advantage of highly liquid markets is that no major player is able to influence price significantly. They, therefore, involve fewer risks and, due to greater predictability, are more suitable for technical analysis.

Categories
Forex Market

Not Having This Information About Correlations Will Keep You From Growing

I don’t know if you’ve ever heard of the correlation, but just in case I’ve been working on this article. Have you ever thought that all operations appear to be positive or negative at once? This is because you are possibly unknowingly doubling, tripling, or simply pushing your account to the limit without knowing it.

Understanding the Currency Correlation

Speaking of correlation what we tend to think is when and how prices fluctuate. And more specifically how prices move in relation to each other. This is the main idea of correlation. How does the EUR/USD move with respect to GBP/USD?

Types of Correlations

Currency pairs can be correlated both positively and negatively, let me explain what I mean. A pair of splits can be correlated in a positive aspect if its values move at the same time and in the same sense. For example, you can see this in the GBPUSD and EURUSD pairs, this is because when the GBPUSD is quoted then the EURUSD is also quoted.

The correlation is negative if there are two or more currency pairs operating in opposite directions at the same time, i.e., simultaneously. You can also see this in the case of the USDCHF and the EURUSD, because when the first pair is negotiated, then the second one falls, and the same happens on the contrary.

Correlations Are Not Constant

It’s important to know that correlation can change, because of global economic sentiment and factors, their dynamism, or any market event. This means that the correlations we find in the market, it is not important how strong, may not align with the long-term correlation between two currency pairs. The changes present in the correlations are usually based on antagonistic monetary policies, also the sensitivity of commodity prices to a currency pair…etc.

Forex Strategies and Correlation

The effect of the correlations is vital and significant in the market, therefore as a trader, you should take into account your operation based on it. I explain to you, in periods of high market uncertainty, strategies are usually used that rebalance your portfolio by replacing a few assets that become positively correlated with other assets that have a negative correlation with each other.

When this happens, the asset price movements are mutually canceled and your account risk is reduced. However, their returns are also reduced. A simple way to look at it is to take a stock that would gain value as the price of value dropped.

Important Aspects of Correlation and Forex Trading

With correlation, you can assess the risk to which your trading account is exposed. In the event that you have purchased several currency pairs that have a strong positive correlation, then you will be facing a greater directional risk.

Through correlation, you can also cover or diversify your own exposure to the foreign exchange market, plus if you have a directional bias with respect to a particular currency, then you can diversify the risk if you start using two pairs that are positively correlated. Although I don’t recommend this because if you lose the correlation you can mess it up.

Commodities, Foreign Exchange and Correlation

Commodities also correlate with currencies. You may already know this but:

-There is a positive correlation between oil and the Canadian dollar (I hope you haven’t forgotten what that means) as Canada is a major oil-producing country.

-The Australian dollar and gold are positively correlated by Australia’s imports of this precious metal.

However, gold and the US dollar have a negative correlation. Since when the USD loses value in the classic periods of inflation then investors look for an alternative reserve currency and the most traded is gold, as it acts as a safe haven value.

These examples also give you a look at how correlations are given on different assets in the market.

How Correlation Coefficients are Calculated

Correlations between currency pairs are always inaccurate and are often constantly changing. Because they depend on prices, the correlation in the foreign exchange market also depends on the economy, the monetary policy of the central bank, and the political and social conditions that correspond to each nation. But the correlations can be quantified and done through a scale that varies from +1 to -1:

0 or close to zero means no correlation. This means that two pairs that do not have a correlation will not have similar behavior and their behavior will be independent of the other.

+1 or a close value means that two currency pairs will move in the same direction.

-1 or close, negative correlation. These currency pairs will move to the opposite side 100 percent of the time.

Forex Correlation Calculator

There is a formula for calculating this:

ρxy = cov(X,Y) / σxσy

But don’t worry, I’ll leave you three portals where you can consult it:

Mataf

An overview of currency seasonality: https://www.mataf.net/es/forex/tools/correlation

Myfxbook

A very complete correlation table: https://www.myfxbook.com/es/forex-market/correlation

Investing

Here you can see the correlation of one currency to the other assets: https://es.investing.com/tools/correlation-calculator

How to Read the Table

I recommend consulting the correlation in forex in extended periods of time, because in 5 min for example is not the most appropriate unless you are going to exploit a specific strategy. A good idea is to view it in a daily time frame. If the correlation is very close to +1 or -1 between two pairs you see, consider it or try to avoid it if you are operating in those pairs.

Risk of Correlation in the Forex Market

Socio-political problems cause currency pair correlations to undergo sudden changes. The devaluation of oil and commodity prices has also made the previously weaker correlations stronger in certain currency pairs involving commodity currencies.

Sudden changes in correlations can usually present significant risks in the foreign exchange market and that this has affected the traders who based their trading systems on this. If they exploit this type of inefficiencies it is basic to have concrete points where to leave the position or undo it.

Importance of Correlation for Traders

For you as a trader, studying the asset correlation closely gives you a broader knowledge of the market, since you can understand the allocation of assets that seek to relate those that have a negative or low correlation and thus could reduce the volatility of your trade.

In addition, if you are a beginner trader, you will be able to establish greater control of your operation and your account will not be so exposed. Here you can have an important added value.

Correlation and Cointegration

Many times people confuse cointegration with correlation, which we were explaining earlier. With cointegration, you can identify the degree to which two currency pairs are sensitive to a particular exact price during a specific period. Cointegration goes one step beyond correlation and measures the distance between the ratio of two or more active persons and the time that they are maintained.

Cointegration as well as correlation must also be calculated. It is easy also, the greater the degree of cointegration between two currency pairs, then the probability of maintaining a constant distance grows. Being objective, identifying, and calculating the correlation is easier.

Pros and Cons of Using Correlation

Some positive and negative aspects of using correlation by trading in the currency market:

Pros

– Easy visualization and calculation of the correlation using a scale -1 and 1.

– Capacity in ample spaces of time to be able to diversify the risk.

Cons

– In the correlation you can see the strength of a relationship, however, you will not be able to obtain information about whether the relationship is cause-effect.

– The correlation cannot predict the future behavior of the market.

[Extra] How to Trade with Currency Correlations

To the point, Ruben. I know how it goes, but how can I do it if I’m starting my operation? Well, a very simple way is for you to diversify by currency. For example, if you are thinking of trading in the currency market do not trade for example EUR/USD, EUR/CAD, EUR/AUD.

In the previous case, you will be very exposed to the euro (EUR). It is better to diversify more or better, for example, EUR/USD, GBP/USD, and EUR/GBP. We now have 2 EUR, 2 GBP, and 2 USD. We have a portfolio composed of different currencies although a priori EUR/USD and GBP/USD may be correlated.

It’s a very simple and basic way to start applying it now.

Categories
Forex Market

The (Far Too Often) Understated Importance of Volume in Forex Trading

Then we will answer the following questions: Why is the volume of transactions in the stock market so important? What are the basic concepts of volume analysis? What exactly is volume analysis? What is behind this analysis? Why do professional operators pay so much attention to the volume of trading and what is the benefit of their analysis?

The Path to Volume Analysis

The first steps of newcomers to the stock market usually consist of: opening a demo account, or with real money, on a broker and downloading a platform like Metatrader. A posteriori begins the great experience of using the strategies and the search for the Holy Grail.

Beginners often fail because they trust the advertising promises of brokers, as they expect to make big profits and quickly. Of course, these expectations are disappointing for most beginners. Efforts to recover increasing losses by increasing positions will only result in a complete sweep of your accounts.

Therefore, many newcomers leave trading without money and frustrated soon after starting their trading careers. After all, only the youngest, most motivated, and persistent traders try to find a sensible way to succeed on the stock exchange, which often leads to volume analysis.

What makes the volume indicator different?

The relationship between supply (in red) and demand (in blue) is the basis of trading. The intersection of both curves shows a fair price. The absolute majority of technical analysis indicators (moving averages, MACD, stochastics, RSI, Bollinger bands, and many more) are calculated on the basis of historical prices.

The volume indicator, on the other hand, works differently: the special feature of the volume is that it leaves the price out of the calculation. The volumes do not pass through formulas but are delivered directly: in tics (each tic corresponds to an executed operation), in absolute terms (a series of executed operations), or in money (sum of the costs of executed operations).

The first type of volume, the volume in tic is mainly known by Metatrader users. Volumes in absolute and financial terms are real volumes of transactions provided by official markets in real-time.

In principle, this volume in tics could already be used for the analysis of transactions, since both tics and actual volumes show market activity. However, the use of real volumes offers a more precise analysis, especially if we examine the volume and break it down into groups of purchase and sale prices. Only the movements of the progressive volumes provide this “X-ray view”.

Indicators of Progressive Volume

Thanks to the growing computing capacity available on the market and accessible to the general public, everyone is able to perform professional volume analysis using specialised platforms.

  • Analysis of the volume and interaction of supply and demand.
  • Demand and supply continue to play a very important role in volume analysis.
  • Developing strong trading ideas.

Analysis of the volume of negotiation provides the most likely answers to the following questions:

  • Why did the price increase (decrease) and the volume increase (decrease)?
  • How much did the volume increase (decrease) while the price went up (decrease)?
  • Why did you increase the volume while the price didn’t move?
  • How has the delta changed (the difference between buying and selling)?
  • How did the price behave when there was an abnormal volume?
  • What happened after that abnormal volume happened?

Therefore, each trader can form his own opinion on the change that is taking place between supply and demand by analysing the correlations between volume and price. Therefore, it is able to understand in real-time the dynamics between buyers and sellers directly from the graph.

In this way, solid trading ideas are developed. If, for example, the price slowly increases to the level of resistance, as the volume drops, the force of purchases is exhausted. There is a demand deficit which creates a sales signal, as the current price is likely to be higher than the fair price.

On the contrary, if the price falls slowly to the support level with a decreasing volume, the sales pressure disappears, which means that there is a supply deficit and therefore a clear signal of purchase since the current price is probably lower than the right price. But it is also possible that the price will refuse to go up despite a large volume of purchases. This means that, if there is a large company that sells assets using limited sales orders, on this occasion we have before us a clear signal of sale.

This is where we come to the issue of market rationality. Proponents of this theory believe that the current price is always fair and that the market automatically takes into account all the factors that may influence the price. However, market prices are formed in people’s minds, and people make mistakes.

Therefore, when you study the charts of prices and volumes you will find that the price at the ends is far from always fair. Unusual volume spikes in the market are often accompanied by media activities. At such times, the current price is likely to deviate from fair value. For example, Bitcoin reached a peak of purchases in December 2017 when prices were quoted at $20,000, and in late June 2019 when prices hovered around $13,000.

Advantages of Volume Analysis

Volume analysis does not require consideration of key factors, expert forecasts, and other additional sources. All the necessary information: time, price, and volume, is already included. This is the great advantage of volume analysis: from it, we can draw conclusions about the forces of supply and demand while providing us with all the necessary information in an appropriate way for analysis. It is not important what are the reasons for the buyers and sellers are: if they come from an intersection of moving averages, a deficit in demand in the area of oversold, a tweet from Donald Trump, or an unexpected accident.

If a graphics reader correctly interprets the interaction of price and volume on time, it will acquire the ability to trade online with stronger traders and make mistakes less frequently. The major experts will have already carried out their fundamental analysis and conducted their negotiation in the market (which can be followed in their volume chart) which will reveal their true intentions. Let’s see how the following example shows using the price and volume chart.

Example:

We mentioned above the high point of the purchase of Bitcoin at the end of June 2019. To analyze the volume of trading during this period, we must look at the footprint of the Bitmex markets over a period of 1 day.

The peak of purchases on June 26, which, as we all remember, was accompanied by an avalanche of positive news in the major media, shows a particularly high buying activity when the level of $12,500 was reached. The question then is: if these green groups show real buying power, why did the price of Bitcoin fall so low over the next few days?

On July 10, the level of 12,500 was tested. In fact, there are green “buying groups” (traces of activation of loss limits), but the main body of the sail is made up of red groups, which illustrate the pressure of sellers.

After comparing these facts in the price and volume charts, it seems that the market is not interested in moving forward so then we should expect a downward movement. Traders could then benefit from a good entry point with the help of Smart DOM or Smart Tape data.

Conclusion

Analyzing graphs based on price, volume and the changing relationship between supply and demand is a good way to interpret market sentiment. Without volume in the graph, it is impossible to analyse supply and demand.

A price chart without volume is like a bike without wheels: you can’t move forward. And this is what we have made absolutely clear in this article: only with volume analysis is it possible to have long-term success in trading!

Categories
Forex Market

Can Forex Escape the Current Crisis? Let’s Discuss its Future…

Forex is one of the tools that can be used today to prevent our money from losing its value and make profits in the process. To put it simply, Forex is the global market that allows the exchange of two currencies against each other.

For example, when you travel to a country you usually exchange the currency of your country for the one you are visiting in a currency exchange. In these places, you can see different exchange rates from one currency to another. You can find that an American dollar can cost 100 yen, and think that with 100 dollars you will have a huge amount of money. When you do this type of trading you are actively participating in the Forex market, as you are exchanging one currency for another. In Forex terms, you sold US dollars to buy Japanese yen. Anyway in Forex Academy you can find many more examples and tips on forex trading.

Continuing with the above example, when you finish your trip and you have money left,  you go back to the exchange house and you see that the exchange rates changed. If you’re lucky, the dollar may have gone down and the yen may have gone up, so you’ll get more dollars for your yen. These changes in the rates of one currency against the other are what allow you to win or lose money and what makes this market so interesting.

This market was born thanks to President Nixon in 1971 when he withdrew the United States from the gold standard in order to allow the value of the US dollar to float. No one could accurately predict how Nixon’s action would create a global industry of more than several trillion dollars.

In recent years, Forex has evolved from a relatively unknown and unavailable investment tool to an almost global phenomenon. The accessibility that computers give to Forex trading, the sudden emergence of multiple software tools and various Forex websites, coupled with all kinds of training and advertising offered over the internet, have made many investors want to try their luck to make a profit through it. Today many people in the world who operate in this market and many others want to enter.

What does the future of Forex hold?

Without a doubt, the Forex industry has grown exponentially in recent times, as online currency trading continues its growing popularity escalation. As such, the structure of the market has changed due to the expansion of participation in the industry, which is highlighted by the growing number of Forex brokers. Performance within the market has also changed, as the foreign exchange market was traditionally dominated by trade between distributors.

Technology has undoubtedly been one of the keys to this growth and is playing a very important role present and future of this market. The increased ease of entry into the market is largely attributable to the growing number of services and platforms. These have been backed by technological advances, which have had wonderful results, such as reducing the costs of operations, increasing the speed of transactions, and increasing transparency. As a result, e-commerce activity in the currency market has played a crucial role, now accounting for about 70 percent of daily turnover, compared to only 30 percent a decade ago.

Technology will continue to play an inevitable role in the growth of this industry. The extent to which brokers adopt the latest technological developments will play a crucial role as they earn credit for having a growing customer base and increase their market share. Some of the most recent technological advances we can find are trading algorithms and software written on specialized platforms such as MetaTrader, which can advise traders what trades to do. They can also program them to do operations automatically on a live account, making the whole process much more effective.

In line with this technological evolution, the industry has also taken a course towards mobile trading apps. At the same time, developments in online payments further facilitate the business process.

The world is very chaotic, and it is important to keep money always on the move. Forex is an excellent option to prepare for future economic crises that can affect such an unpredictable world. All you need is to invest time in your learning to unlock the potential of this market.

Categories
Forex Market

Should I Invest in Forex or the Stock Market?

When we speak about investing we think about the long-term period of holding some assets in expectation their value will increase. Therefore, investing is not the same as trading where we can also go short and use leverage in case we use CFD derivatives. Inverse investment with inverse ETFs is also an option to go short long-term, however, this option is not as extensively used by an average investor.

Now, depending on your goals and analysis you will invest in different assets. Asking this question means you want to follow opinions from other investors. Investors without an analysis of their own now have a dilemma. Advisors may advise going along with some tech companies (Tesla Motors alright), some will praise hard assets and precious metals, others will pump Bitcoin, and so on. You will find many groups with their own story, some are biased, especially those backed up by the government in one way or another.

If we compare forex and the stock market, there are huge differences, but you need to understand forex is defined as the currencies market, therefore you will be holding and investing in assets that are backed up by governments or states. Are there better options than equities or fiat investing? Crypto enthusiasts will say yes, precious metal holders will say yes, others may so no, leading you to the answer is probably in between. Diversification is the best way to reduce risk, so diversify your investments and choose different markets, you do not have to choose between forex or stocks, go wide. 

People love trading stocks, it is like a tradition and the first to come to mind when you see charts. The stock market does now have the capitalization as forex, but it is heavily traded. Liquidity is extreme with certain popular companies. Some facts have to be considered with the equities. Assuming you have the money management set up optimally, with stocks you have a high upside proposition. Companies that are hyped or have products in demand are going to multiply their value many times over whereas you cannot lose more than what is already invested. Timing is, of course, also crucial. 

You will belong to a very fun market with stock investing. There are so many shows and portals providing very interesting information about companies, their products, and strategies in the future. All this is entertaining as you take part in the action. 

Stocks also have dividends, at least some of them. You do not have this passive income with forex. In forex, you have financing swaps that could be credited, depending on the interbank rate and the broker markup, although it is more common to have charges. Companies will have dividends and you get to choose if you want to hold their shares, with forex you will have inconsistent charges or credits and there are just a few currencies you get to choose.

If you are used to stock trading or even investing, you could have some sort of attachment to a particular company. There is no such feeling in forex. Whatsmore, any information about a specific currency is not as easily translated for investing purposes. There is a lot of hidden pointers where could some currency go long term whereas companies are easier to follow. Companies you like and even having some of their products (Apple) gives you a unique feeling when you make money with them. Whatsmore, some of the research you make on a specific company could give you an edge to see trends about to happen others do not. 

On the other side, as mentioned, it is hard to go short with a stock. The options could be with some ETFs since stocks usually follow the index performance. There are situations where stocks are exposed to other factors that could halve its value. You may sometimes hear very bad news about your company and you would not be able to get out without a major loss. If you are trading indexes you will be protected from this kind of influence and of course with forex. Fundamental analysis is very important with stock investing, the news you get is very late info, you are the last to know. If you are not connected to some kind of insider sources, you just get scraps off the table. 

In forex investing you might need some fundamental research, but the kind that deals with reports and politicians’ major attunement with the certain country economy or currency. Stocks require a lot more focus on fundamentals. With forex, you have the big banks’ involvement and manipulation, in the stock market you have the insiders. There is so much going on behind the curtain that drives the stock value you just cannot foresee or control. And you cannot rely on the technical analysis here. Pay attention to mergers and acquisitions, monthly reports (you also need to know accounting and finance to get the underlying picture), how the company capital is managed, have information are they investing and its structure, what the company competitors are doing and so many more these things you have to analyze when you invest with stocks. 

After all, when things go bad with your stock, there are a lot of questions you need to answer before moving on. Are you going to keep holding your shares when it losses 50% of its value? Some companies recover, some do not. If you decide to cash out, are you going to hold the Dollar, Euro, or invest in some other companies? How do you find a recession-proof company? Airlines are killed by the pandemic even though they were holding ok during the previous recession. 

If you are investing in stocks, it is imperative to get out before the recession. But why not turn this downturn into a benefit. Your stock is unlikely to be immune to the recession so try inverse ETFs. Here are some of the ETF symbols that are inverse of the respective indices: SH – S&P 500, DOG – DOW, PSQ – NASDAQ, MRCO – Beanie Babies. 

Forex and currencies are not big movers when we compare indexes or stocks. Are they a “safer” market? Basically, no market is safe for anyone not having a plan and optimal risk management adjusted to work long term. The main advantage of forex trading/investing is that technical analysis is more effective. Some prop traders even completely rely on technical systems. This way they have more control over their emotional state, it reduces the noise, and you rely on the system rules strictly. Forex is more easy-going in this sense, unlike stocks. 

Now, let’s get back to diversification. You should diversify both the market assets and the market types with the buy and hold strategies. Diversification is a part of risk management but it is a separate rule in our book. Investors should know USD, CHF, JPY, precious metals, bonds, and to some even bitcoin are the safe heavens when the markets go down. These assets should be at least 50% of your entire portfolio. The other part can go into more risky assets such as stocks ETFs, crypto altcoins, and indexes. 

Experienced traders that asked this question a long time ago have some tips. The first one is never to fall into groupthink. People hoarding gold have a nice backup, but they do not take action, they just sit on their piles and complain when the price is going down. Have a plan, never go all-in into a single asset, diversify horizontally and vertically. Also, do not just invest, go short and long, and learn to trade too. See what other options are there except forex and stocks, we live in good times since there are so many opportunities now than 10-20 years ago.

Categories
Forex Market

Is There A Way to Make Forex Trading More Secure?

Persons asking this question are tackling the essence of successful forex trading. One of the essential starting points is the mechanism to cut your losses before you try to get more winner trades. You will find that in team sports, defense plays a key role to win, it is a must before all else. Traders asking this question also show they understand measures need to be put in place and are wondering what are the ways to do that. Luckily, there are many ways to make trading more secure, traders, and generally, -economy schools call this risk management. How we make the risk of losing acceptable so, in the long run, we are consistently able to reap the rewards out of forex.

Other names for managing trades and the risks associated are Money Management since we are putting money into trades and also Portfolio Management, we are managing many different shapes of capital through holding different assets. However you like to call it, it is all how we limit our losses and maximize our wins. Therefore, some measures are more effective for certain trading strategies and completely inadequate for others. 

Let’s put some simple wording here about the risk before we get into details. In forex trading, we have many factors that can ruin our trades. No strategy is immune to them so traders are careful, think about what could go wrong and also, what went wrong in the past. History is a good teacher, however, new things that ruin our trades come in more often nowadays, just because the economic activity goes wild in many directions. Whenever we need to solve a problem, traders measure the odds for and against, simple pros and cons of their decisions. If we are to put some capital at risk, to invest, we are looking at what could go wrong and if the probability of losing is justified for the rewards we might get. It is not only about the probabilities, it is also about the weight.

Losing 1% of your capital for a 5% gain seems like a good decision but if the outcome of winning is less than 15% then it is clear this is not good enough. However, if we have a 50-50 chance of winning, you are in for good long term performance if these opportunities repeat. Forex markets go up and down, can also go sideways for some short time but eventually, the price will move. Take a one-hour timeframe, for example, create your rule so you can get to a 50-50 chance of winning trades. This can be very simple, toss a coin every hour at the end of a candle. Set never to lose more than 1% of your capital with a Stop Loss order and set a Take Profit at 5x the Stop Loss. Close the trade after one hour unless your pending orders get triggered first. You will notice that after 100 trades the risk is limited whatever happens and over time you slowly get some profits. 

Of course, you will also notice you can increase your winning odds and further protect from the risks, forex is not a random distribution, there is some certainty to it. Historic charts will present you with trends, patterns, and various meaningness we make out from what is seemingly random. At certain times, you will notice a trend emerges, and your random 50-50 decision does not make profits as it could have had it more trades in the trend direction. Time to make some adjustments. These adjustments slowly specialize to trend following strategies. If you notice the price bounces back from the channels you or some indicator creates, great, you are shaping your own reversal strategy. There are so many ways to trade forex, but every trader starts walking from risk management. 

Now, adding on measures to your 50-50 decision-making results in more profits, even the odds are still 50-50. You could add more, say, a trailing stop. As the price moves in your direction, trailing limits the amount of weight you can lose. Consequently, if the trailing moves above your entry-level, you do not have any risks of losing, whatever happens, you can only win. You will notice this measure pushes your balance really well when you have a strong movement or in a trend. You may think closing your trade after every hour rule is not so beneficial anymore. Test it out, are you right? You probably are but make sure with a good testing sample on your demo account. Let’s get this money management even better. Diversify your positions with scaling out and moving Stop Loss to breakeven.

Diversifying is directly affecting the risk and in this aspect, we are diversifying the position size as the events unfold. Once your Take Profit is reached, close only 50% of the position and move your Stop Loss to breakeven if you are not using a trailing stop. Now not only you are protected from losing but you are open to grab a bonus from a trend that could last for many more hours or days. Compare your results with previous versions of your strategy after 100 trades for example (some traders go for 1000 trades sample). If it is better, your consistency increases as well as your gains. You may try to experiment with other risk management measures, such as scaling in, multiple take profit and exposure diversification, volatility-based pending orders placement, and so on, but do not overcomplicate things. Adding more rules does not always bring more profits. 

The example above only tackle technical money management and only in one way with a few example tools. Other things are in play on the fundamental side. Investors manage their risk using economic indicators such as government measures, reports, country key figures, elected officials’ mindset and knowledge responsible for governing the country’s economy or certain branch, and many more. They mix in the risk weight and probability with their own calculus. Risk management is a special economic discipline after all. As a forex trader, you do not have to be a mathematician, just follow proven methods that are very easy to implement in your trading platform. 

Risk has its categories and shapes, there are things we can control and those we cannot. Managing how big a trade is in relation to our total balance and market volatility is what we can control. We directly limit the risk with these measures. However, unforeseen events happen and there is nothing we can do. We will see losing streaks or sudden crashes however great our strategy is. This is an inherent risk we have to accept. There are other risks not directly tied to forex trading. We may have problems following our rules as we get emotional, we panic, we have a feeling, get angry, thrilled, we overtrade and overexpose. 

Can we learn not to be emotional or is this our personality that we cannot shake out? We now raise the question of where is the border between our psychology and the risk we can manage? Is this defined as an operational risk? A lot of things can be thrown into the psychology basket, even risk management. Therefore, psychology and risk management are intertwined. If we explore and recognize the importance of risk management we have the right psychology, we do not seek out fun tools and strategies only to lose everything in a few trades. We do not seek to get rich quick ways and thrills of betting. Defense comes first, even though it is not popular. This is why many lose on forex, and why the title question reveals healthy interest, a sign you will probably belong to the successful minority.

Categories
Forex Market

Is the Forex Market Better Than Other Markets?

Let’s discuss why investing in forex (the currency market) and not in other types of products (stocks, warrants, CFDs, etc.) or other markets (IBEX, DAX, NYSE, NASDAQ, etc.) is arguably the best plan for modern traders. Before diving headfirst into Forex, we need to cover a few topics first…

What is Forex? What is the main advantage of Forex? It is, with a marked difference from the others, the largest market in the world where the traded product is currencies. The daily trading volume amounts to a whopping $6 trillion ($6,000,000,000,000).

Why does this interest us? What brings us a large volume of transactions? The more liquid a market is, that is, the more money is traded in the market, much less difficult for us to enter and exit at the price we want (are always willing many sellers and buyers of each price level).

The more volume is negotiated, the more difficult it will be for someone to control the market, we will be “more protected”, although we will have to be attentive to the movements that hedge funds can make (groups of capital-intensive investors, which at certain times may move the market in their favour) to go in the same direction as them. Another time we will discuss how to read the market and see where the big investors buy and sell.

Commissions, how much do we pay on the stock exchange versus FOREX? Bank commissions will be less aggressive on our money the more money we have. Therefore, if we are a small investor, entering the stock market will drown us before the first operation.

On the other hand, in forex, you will pay 2 or 3 market points, a variable commission for each trade you make. It’ll always be cheaper than doing it through a bank. Depending on the amount of capital, these 2-3 points can be reduced to 0.5-1 market point.

To view it numerically suppose that you choose ING direct (one of the cheapest banks) and we choose a standard forex broker (2 pips commission). We will both invest €10,000 in the market: 

ING

10.000€ * 1.25% = 125€ of commissions.

As compared to…

Standard Forex Broker

10,000€ is equivalent to buying a mini-lot of forex, each pip of a mini-lot is 1€.

1€ * 2pips = 2€ commission.

Therefore with the same amount of money invested we pay very different commissions, in ING when investing 10,000€ in shares, we take 125€, in Forex we are charged only 2€. This is considering that in Forex we leverage and take advantage of the advantages of doing this strategy.

Other Advantages

The forex market is open 24/7, less on weekends (since, for example, when it is 8:00 AM in Europe, the Japanese are closing their day, and when it is 14:00 – 15:00 in the afternoon, they open the American markets, until 10:00 at night. Therefore, we have a wide range of possibilities). There are plenty of currencies you can trade with (although there are about 12 more traded pairs, with the extra liquidity this represents).

It’s practically impossible for a currency to go bankrupt, especially if we trade in the major currencies, instead, if we buy Apple or any other company, there’s always the risk of bankruptcy, and if not, look at Lehman Brothers, with more than 150 years of history, and that in 2008, he filed for bankruptcy.

Categories
Forex Market

Why Have Forex Trading Levels Spiked During the Pandemic?

The coronavirus situation has rocked the world, everything has changed. People are now working from home, millions have lost their jobs and many have closed their homes, but with all this loss has come an opportunity too. It’s not the nicest thing to say, that this worldwide pandemic that has ruined a lot of people’s lives can bring good fortune to others, but the facts are that it can and it has. 

Let’s not forget about how accessible the markets are now, it is incredibly easy to get into trading, all you need is an internet connection, a phone or a computer, and $10 to deposit into your chosen broker. With it being so easy to get into trading, it is no wonder that so many who are now stuck at home or have lost their jobs are looking to forex for something to do or for a new way to make a little money in order to make up for the lost income. The impact of the coronavirus on the markets have been huge, if you have read the news or watched it on TV then you would have seen the devastation that it has caused the world’s economic markets with crashes in the markets and stocks all over the place. With those losses, so many have seen the opportunity to take advantage of it and more and more people have been moving into trading.

Probably the largest factor that has contributed to the increase in forex trading during the pandemic is the rate of unemployment, millions of people have lost their jobs already and more will do so as time goes on. The unemployment rates have hit record highs in many countries around the world with very little to stop it, especially as new lockdowns are now coming into place. With the increase of unemployment, the number of people sitting at home has increased which has in turn led to people looking online for ways to make money one of the most prominent of those is trading and forex.

Many large corporations have lost value in their stocks, a lot of stocks, people have seen this as an opportunity to begin trading stocks, this trading of stocks is a pathway into forex trading for those that want a slightly faster-paced trading experience. There has also been an increase in the demand for the US Dollar, this is normally due to the fact that the USD is seen as the world reserve currency and this increase in demand has also helped to fuel the markets and the volume of trading, particularly on USD based currency pairs. There has also been a large increase in trading in areas such as southeast Asia, Eastern Europe, and Africa.

In terms of volatility in the market, over the past few years, the amount of volatility in the markets has been slowing which has made the markets a little less desirable for newer traders. With the impact that the coronavirus and the pandemic have caused, the volatility within the markets has increased dramatically. Due to this, the amount of profits that can potentially be made has also increased. This increased profit potentially has given a lot of people the hope of making a little extra money or to replace their lost jobs. However, this increased profit potential is also potential for loss and when people are getting desperate, there is an opportunity for people to use more than they can afford, again increasing the volume of trades being made.

There has also been a rise in something known as copy trading, this is simply where you sign up to an account, deposit your money, find a trader that looks good, and then your account will automatically copy their trades. There has been a lot of added advertising online regarding services like this, most likely trying to take advantage of the increase in the loss of jobs around the world. These services make it very easy to get into trading and forex, simply because you do not need any experience to do it, which is the perfect idea for someone who has lost their job and needs some money.

The increase of accounts on these copy trading services has also increased the amount of trading volume that is being put into the markets. Of course, the smaller traders and retail traders only make up a very small amount of the overall trading volume. The larger corporations are where a lot of it comes from. The loss of value to the stocks and shares for a lot of these larger organisations means that those of them that trade, will be putting more of a focus on that aspect of their business in order to try and make up for the loss of profits and capital, thus increasing the volume of trades being made.

Along with the pandemic, there has been a lot more going on in the world that could be affecting the markets as well, there is the Us election and Brexit going on which have also presented a lot of trading opportunities and also added to the volatility of the markets, with all three things going on at the same time it has created a hailstorm in the markets with the markets jumping up and down a lot, the three combined has created the opportunities that a lot of new traders are now trying to jump on.

The pandemic has caused a lot of turmoil around the world, which has, in turn, left a lot of people looking for money, this has presented those people with a lot of opportunities to join the trading and forex world in order to make a little bit of money to get by. The ease of access to forex trading in 2020 and beyond will only make things easier, the world has most likely been changed forever, so it is important that people find a way to get by and for many trading and forex is that option.

Categories
Forex Market

When Does Latency Become an Issue in Forex Trading?

It is important that before we ask that question, that we understand what latency actually is. You may have heard the term if you have ever played a video game online and if you have most likely experienced the consequences of it. Latency is simply defined as the delay or the lapse in time between a request and a response. When does this lapse become an issue in Forex and how can you overcome it? Read on to find out.

If we go back to the video game idea, when you press button A, the latency is how long it then takes for the action to be performed by the character. In a trading sense, the latency is the amount of time that it takes for your action to be executed and to interact with the markets. Latency will affect your ability to read the markets, the ability to act on any changes and actions, and pretty much everything else that you do.

The issue of latency has become more and more relevant as technology progresses. You will often now see brokers advertising their latency and execution times, especially if they are pretty low. #For the normal user, this means very little to him, but for those looking to get the most out of their trading and to squeeze every single penny out of their accounts then it can be relevant. Now that technology is far better, the need or want for better latency and execution ties is also greater.

Latency is prevalent in everything that you do when it comes to trading, especially when using a trading terminal such as MetaTrader 4 (there are many others available too). Each and every aspect of your trading is influenced by the latency.

The magical flow of market data being streamed to your trading terminal is affected by latency. The market starts out at a marketplace or exchange, it is then passed on to the trader who is then able to look at the data within the trading platform of their choice. The speed that this data is transferred between the exchange and the users terminal is often measured in milliseconds. Latencies can be found within these streams, latencies can take place at the exchange or market-based servicers, the broker that you are using can cause additional latencies, your own internet connection can of course create latencies and is one of the larger reasons for having them, and your computer hardware and software can also cause latencies within your trading operations.

One of the more common problems when it comes to latency with the market data is known as data lag, This is where there are problems or inefficiencies with the data stream, many of these issues are completely out of yours as a traders control, such as problems with the hardware at the exchanged, in addition to bottlenecks with the internet connections which can happen without any sort of warning and won’t be recognised by the trade or those monitoring the services for a period of time.

There can also be some issues when it comes to order routing and execution, these are also the areas where latency can have the biggest effect and can potentially be the difference between a profitable or losing trade. Being able to rely on consistent order filing and low slippage on those order fills is vital for a profitable trading experience and this all relies on the data actually arriving at the market ahead of the competition.

The general route of an order and the execution goes along the lines of the order being entered by a trader remotely on an online trading platform, the order is then received by the broker, the order is then relayed by the broker to an exchange or market. The order is then placed in a queue at the exchange or market. That is generally how it goes, however during each of the four states mentioned above, there’s a chance that latency can cause some issues with this process including some delays. The problem with latency in this situation is that any sort of delay can mean that the order will be filled, but it will be filled at a price other than what it was executed at, so it could give you a much worse opening price than originally planned.

So latency can have an effect on your trading. It can be the difference between making a profitable trade or having a loss. There are, however, some things that you are able to do that can help you to manage the latency that you receive. Of course, some of it is completely out of your control, with very little you can do, but there are some things that can be done to help. For larger more institutional firms, there is something known as DMA which stands for Direct Market Access, this enables them to simply bypass a number of different stages of order executing. For a DMA order, there is simply the order being placed by the trader via a connection to an exchange or market, the order is then placed in a queue ready for execution at the market or exchange. So you can already see that half the stages are gone and so there is much less room for any latency to creep in and cause issues.

The problem is that this is not really relevant for retail traders as DMA services are quite limited. As technology is progressing through, more and more brokers are looking to bring this sort of service to retail traders, claiming to offer direct access to the markets, but until it is properly available for retail traders, there are a few things that you could do to try and help your own latency issues. Some of these things include ensuring that you have up to date computer hardware that can easily handle the running of the required software, regularly perform internet connectivity tests and ping servers to ensure that your internet is remaining stable, you should also evaluate your trading platform on a regular basis, to ensure that there are no lag issues in the updating of the charts or any other features.

Latency can be a real issue when it comes to trading and it is something that you want to ensure that you do everything that you can to keep low. It can be the difference between a profit and a loss, so do what you can to reduce it. Check your hardware, your software, and your internet, if your broker constantly has slippage and latency issues then you could potentially start looking for one that offers slightly better latency to the markets. Just be sure that you regularly monitor what latency and lag you are getting so you can be on top of your game and to ensure that you are getting the most out of your trade executions.

Categories
Forex Market

Overview of Trends and Lagging Tools

Veteran traders often develop a kind of intolerance to certain life and relationship issues. This intolerance developed from a professional mindset for decision making, making it clear for them to decide should they get involved, spend time, or not with a certain person or issue. To some, this behavior may seem like intolerance but in fact, it is decision-making skills used in real life. Veteran traders have realized progression is quick when we stick to our decisions and learn from bad ones, making it easy to repeat the right call in already experienced situations.

When it comes to deciding which trading tools to try and test, it is also clear to them. If we categorize indicators and tools to Lagging and Leading, they know which to pick based on their system, mindset, and experience. Lagging indicators are not regarded as good to trading by the masses since they have the “lagging” word to it. So beginners may wonder, why are people still creating them, and why traders use settings that seem unresponsive to the market price action? Even if you are testing your trading system for a few months you will realize lagging indicators are the kind you have better results with for trend confirmations. 

Lag is mostly a negative effect we experience when we speak about trade execution, internet connection, but also about motors, plane control, transport, and so on. Therefore, we are wired to think lagging indicators are also not as good as leading indicators. Well, trend-following strategies are mostly based on lagging indicators. If you are trading reversals, you would need leading indicators such as RSI, Stochastics, and similar indicators that give signals before a trend emerges or stops. Since trend-following strategies are proven to be the best form of forex trading, most professional traders use at least one lagging indicator in their systems.

The role these lagging indicators have is mostly trend confirmation, but interestingly, volume indicators are almost always lagging type too. Now, let’s be clear what is the definition of a lagging indicator. One of the better explanations is given on babypips.com, leading indicators fall into the reversal category while lagging leads you to trends that are already happening. Leading indicators give you the signal to trade before the trend emerges, therefore they “predict”. As with most predictions, they do not foresee the future and fail in a trending environment. 

Consequently, experienced trend-following traders do not use them to find trends. But it does not mean they do not use them for other purposes. One of the most popular leading or reversal indicators is RSI. Some reversal indicators based on the RSI are very good trend exit point indicators, as described in one of our articles about when to exit. Most of the leading indicators are based on the oversold and overbought concepts or levels where they tend to be range-bound. Trends do not respect any ranges and the best lasts for weeks.

Now, for psychological reasons people like to get into action and try to predict or bet on many events, including trends. This makes reversal indicators more popular than lagging indicators, not just by the download count but also on the internet. Unfortunately, the internet is full of marketing which gives what people want to see, and when something is described as “lagging” it does not sound good. Experienced traders just have clear decision making when picking what tools they need and then test it out to rank the best. They do not pay attention to what the mass wants or think it is good, their benchmark of what is good is their back and forward testing result. 

Ratings on indicators do not always come from established professional traders if they are based on the votes of users. If they are based on marketing, it gives us even less reason to pay attention to. You will typically find some comments or ratings on the MetaQuotes site and also on other indicator sources for the MT4/5 platform. These do not mean much to the one on a quest to find a good trend confirmation or exit indicator. Every trading system is unique and adequate to each trader, if a tool does not do a good job to one it does not mean it is bad for yours. Again, if you have decided it can fit your system, test it out, just know a reversal or leading indicator is not the type you want as a trend confirmation indicator

In our article about trend confirmation indicators, we go deep into how to test and where to find for the MT4 platform. We also mention types and how to spot good ones. Essentially, all of these are lagging and will give you a signal to trade only when there is enough data (historic movements) that fit into their calculations. Now, most people are impatient and can even tweak the setting of such indicators to show too many signals, many of which are false. This tendency is similar when we are attracted to leading, predictive, reversal indicators for the wrong purpose. 

The use of leading indicators is bound to reversal strategies, and reversal strategies work in calm, trendless markets. On some occasions, a reversal strategy could be used for pullbacks in a direction of a major trend although these setups are somewhat less successful according to stats by prop firms than classic trend following. Some of the best leading indicators are based on RSI and other popular tools but are much newer and produce much better results. 

Better category names for indicators would probably be reversal and confirmation indicators to avoid bias with the “lagging” word. Similarly to some life events, it is best to decide an action after all is settled, you do not want to make any rash, emotional decisions. Impatience is easily punished in forex, some try to understand why and learn while most just continue to lose or give up. This market will filter the ones who are just expecting an easy way to financial freedom and rewards those who were persistent enough to learn the right way. 

Setting your indicator to be reactive instead of confirmative will limit the beneficial effect of having a “lag”, as when you zoom in too much to see a bigger picture. On the other side, a setting that forces the confirmation period too long will give you signals too far between to be useable, as when you zoom out too much to see relevant action. A good example is the popular 200 EMA used by some investor type traders. If you want to be a day trader, stick to timeframes and settings relevant to your needs. A trend trader that has a position open for a few days on average should not be concerned with what happened 200 days before. 

Another point with popular tools (reversal indicators) is that they are based on oversold and overbought levels which are by the opinion of most traders, not relevant to forex. Also, when you are using popular tools is means you follow what the masses are doing. The mass effect triggers the attention of the big players on forex – funds, and big banks. Consequently, the price will move in the opposite direction of what most traders follow. This phenomenon is evident when we look at the sentiment tools on the most liquid forex pairs and indexes. Crypto and other alternative markets lack this correlation, as the big players do not have or cannot have an effect on them. 

In conclusion, understand that names and ratings do not matter, your testing and system performance with these tools do. You will make an easy selection of what can fit your system well once you get some experience with testing and searching for tools. Know to set up your lagging indicators optimally, test, and find the best setting this way. Lagging indicators will not work well in calm markets without volume, they should be just one element in your system. Reversal or leading indicators are not useless, their role is probably found when looking for an optimal point to exit a trend-following trade. Just do not think there is magic in their predictive nature, even when others say it is amazing.

Categories
Forex Market

Buy Now Because It´s ALL Cheap!

“Buy now because it’s ALL cheap!” This is a sentence we have heard hundreds of times and it must be said that the basis is correct. In the markets, you should buy when a stock is cheap and sell when it is expensive, Easy? Yes, but not simple.

Many small investors with little travel on the stock market think as follows:

Stock A a year ago was worth $20, today it’s worth $10. The small investor hastens to attribute this fall in price to the crisis, to the slump of the sector, to the inability of others to see the bullish potential of that multinational, etc… But there’s one thing you don’t take into account, why was that action worth $20 a year ago? It is not because of the crisis, the crisis is a consequence of the reason why it was worth 20$ the previous year, the real reason is a bubble, speculation, or price inflated by a false feeling of growth and well-being, call it what you want.

But well, the small investor is on the sidelines of all this and will make a lethal second step, the world’s biggest stock market fallacy will say:

“Man, a company this big and solid will sooner or later be worth $20 again.”

We could find a few thousand graphics with prices that have been quietly 3 or 4 years that have not been touched and may never touch again. Never fall into this fallacy, prices need not return to the levels of a few years ago, and if they do inflation and opportunity cost will have eaten away your investment in an overwhelming way.

To give you an example I propose a TEST:

Company X is listed at $300, 5 months later it is listed at $100:

  1. a) Buy shares because 100$ is cheap because it is three times cheaper!!
  2. b) Do not act because the stock has lost 66.6% of its value.

Company X is now listed at $50, what do you do?

  1. a) I buy shares because now company X is 6 times cheaper than before and clear, sooner or later we will be back to 300$ or more. I have also read some very positive news for the sector and an article where they leave this company as the one with the greatest potential.
  2. b) You are still on the sidelines, although everywhere you read that this action is a real bargain, Who would be the fool who would not buy at such a low price?

The action keeps cutting prices and now it’s only worth 5$ (Maybe I’m already exaggerating, right?)

  1. a) Man, at 5$, if before it was worth 300$ this is a safe investment, the day that this goes up I will retire directly.
  2. b) There is no sign of the price that the stock wants to go up and even knowing that the stock now “only” is worth 5$ you decide not to buy and let your friends laugh at your poor eyesight to invest in “safe securities”.

Finally, the share price is $1 What do you do now?

  1. a) You laugh and think “But how exaggerated, how will it cost $1 a share that was trading at $300?” “If this is like saying that Google quotes $1!”
  2. b) You’re still on the sidelines, we don’t have anything to buy even though the value has been devalued by 99.9% of the initial value and it looks like it can’t be worse.

Well, gentlemen, the story ends with quotes in the area of $0.2 or what’s the same, the price of 4 chewing gum per share.

Any one of you who has opted for option A in any of the cases would be almost bankrupt right now. Imagine the friend who bought 10000 shares at 1$ (10000Acc * 0.2$= 2000$). It has lost 80% of the money, nobody can stand a loss of this size, and surely in the 50-60% of losses, most of us would be out of the market complaining about the crisis, the governments, and the manipulation of the market.

I’m no longer talking about who bought for $100 or $50 by making a “long-term investment,” you can imagine that he will never see his money again. Well, maybe I was a little over the top when I said that the price could drop from $300 to 20 cents, something like this would never happen on the market… Would it? Remember, always use a system with technical foundations and operate with knowledge, never open an operation if you do not have clear where to place your Stop Loss.