With this publication, we will look at an incredible method of market analysis based on the volume Volume Spread Analysis (VSA), developed by the famous American financial analyst Tom Williams and published in the book «Master the Markets». This is an unusual view that deals with how market makers manipulate crowd behavior.
With this publication, we will look at an incredible method of market analysis based on the volume Volume Spread Analysis (VSA), developed by the famous American financial analyst Tom Williams and published in the book «Master the Markets». This is an unusual view that deals with how market makers manipulate crowd behavior.
With this publication, we will look at an incredible method of market analysis based on the volume Volume Spread Analysis (VSA), developed by the famous American financial analyst Tom Williams and published in the book «Master the Markets». This is an unusual view that deals with how market makers manipulate crowd behavior.
Not to recount the book, so in this series of articles, we will focus on the practical side of the method with a traditional reference to cryptocurrency trading. You can apply this method to any financial instrument, my examples will be in the BTCUSD pair.
Now, let’s discuss the theoretical principles of price formation in the market and how large capital traders influence the market. I will define the main concepts that I will use throughout the course. Therefore, you should study this article if you are interested in VSA and want to better understand the actions of large traders.
What are Trading Volumes?
Even if you’re just starting your trading career, you’ve probably found the following phrase: “The market goes up when demand prevails oversupply. And, on the contrary, the market will suffer a decline at the moment when supply is surpassing demand”. We need to study the principles suggested by this phrase in order to better understand what the volume of trade means.
For those who could not find a similar term, I must explain that, in trading, is the number of lots traded on the market within a specific period. Firstly, it should be understood that the volume taken in isolation does not provide much information. But, if what we do is compare the current volume with the previous day’s volume, or a week earlier…, you will see clearly the changes in business activity.
To better understand market processes, let us compare a change in volume with the price differential. This will show the feeling of the great players: bullies or bassists. Remember, the spread is the difference between high and low prices during a particular period.
In practice, price movements do not always correspond to current market activity. There are often cases where, after a small increase in volume, the price increases sharply, confusing many traders. But if you have already studied the concept of inertia, then you will have everything clearer. Then, in this situation, the market can be compared to a car in which driving at high speed will go uphill for a while, even if the driver has taken his foot off the accelerator.
What is Volume Spread Analysis?
The VSA method provides a complex approach to market analysis, which defines the relationships between asset price, spread, and volume. The last indicator shows the activity in the market. While the spread speaks of the amplitude of the price movement.
In establishing the relationships between these two characteristics, we strive to identify the imbalance between demand and supply. For the most part, it is a consequence of transactions opened by large operators, and in the trading environment, it is considered one of the most significant reasons for the market to move in one direction or another. In turn, knowing the imbalance and the true causes of its occurrence, we can easily predict the direction of future price movement.
Principles for the Movement of Assets
Volumes, like stock market trends, are also divided into bullish and bearish. The bullish volume increases the volume in the upward movements and decreases the volume in the downward movements. Consequently, the bearish volume increases the volume in downward movements and decreases the volume in upward movements.
Now let us examine the concepts of accumulation and distribution…
Cumulation means buying as many shares as possible, without significantly increasing the price compared to your own purchase, until there are few or no shares available at the price level you have been buying. This purchase usually occurs after a bearish move in the stock market and there are the best prices to buy.
Once most shares have been removed from the hands of other traders (ordinary natural persons), there won’t be much action left to sell at an additional price. In other words, resistance to the bullish movement has been neutralized. Then, in this situation, we can expect a steady increase in prices until syndicated traders perceive prices too high to sell those assets that just bought.
Distribution is the sale of assets, which should ideally be achieved without lowering the price against the sale of the market maker. This operation is done to take advantage of the profits of selling at the conditional peak of a bullish market. At the same time, most of these great players place large orders not even at a fixed cost, but at a range of prices.
If the total volume of transactions is so large that prices are forced to fall, the sale is suspended. Traders have another opportunity to sell securities profitably in the next wave upwards. Once professionals have sold most of their holdings, a bearish market begins because markets tend to fall without professional support.
Now, you understand that big forks see both sides of the market at the same time, which gives them a big advantage over common traders. To better understand the market, study the concepts of strong and weak holders.
Strong forks are professionals who have convenient positions and are able to easily read the market. Despite their ability, they can open more unprofitable operations than profitable ones, but close them quickly, considering losses as inevitable trading costs.
Weak holders are often new market amateurs, tied to their capital and therefore make emotional decisions, which are often at odds with common sense. They are often subjected to market pressure when prices turn against them, which is why they suffer heavy losses.
If we combine these concepts with those described above, we can summarize that: a bullish market is like this when a significant transfer of shares from weak holders to strong holders, usually with a loss for weak holders. A bearish market occurs when there has been a substantial transfer of shares from strong holders to weak holders, usually with a gain for strong holders.
When the market moves from one major trend state to another, an event called a buying or selling climax will occur. As a definition, it is an imbalance of demand and supply that causes a bullish market to become a bearish market or vice versa.
The climax of the purchase arises at a time of high demand for the asset and the active dumping of securities by the big players, which makes continuous growth impossible. In addition, in the bullish bar, the volume looks exceptionally high, accompanied by a new maximum and a widespread. At the end of the purchase climax, the market will close in the middle or high of the candle.
The selling climax, as seen in the name, is the exact opposite of a buying climax and usually occurs at the time of high sales. It presents an extremely high volume in downward movements, accompanied by wide spreads, with the price entering the local minimum. In the last phase of the sale climax, the price will close in the middle or under the candle.
Causes of Price Reversal
There are only two main reasons why there is a reversal of long-term trends in the market:
Most traders panic after observing substantial drops in a market (often from bad news) and usually follow their instinct to sell. Professional traders, in turn, think differently, asking a question: “Are big market players prepared to buy mass stock at these price levels?” If this is fulfilled, this will be a sign that indicates the strength of the market.
After substantial increases, usually for good news, most will get angry by missing the upward movement and will rush to buy. At this point, their professional colleagues are only interested in the willingness of big players to sell enough securities at the current price to meet demand. As you’ve already guessed, mass sales are a sign of market weakness.
Fundamentals of Market Reading
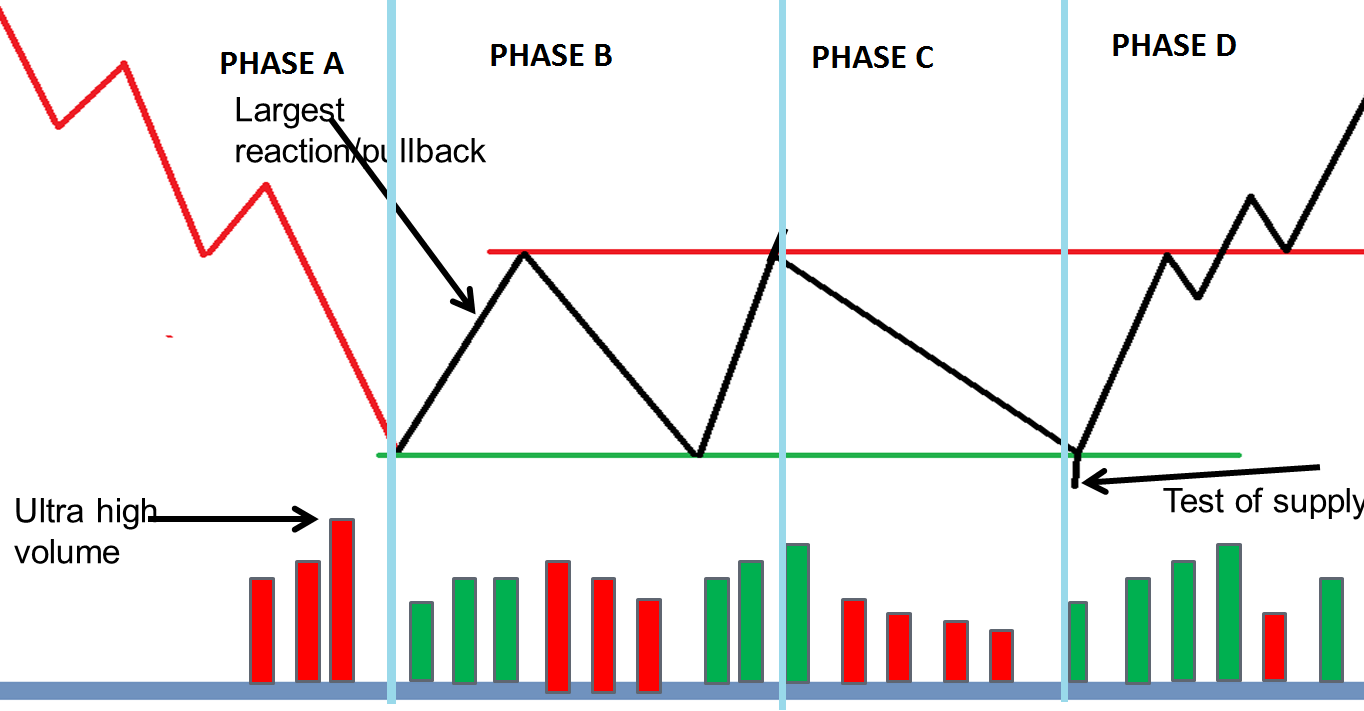
First, it is necessary to understand that markets move in so-called phases. Looking at the changes in volumes and price spreads, we can see that the market builds a cause for the next phase. The duration of the phases may vary. At the same time, it is normally assumed that short phases lead to small changes, while long ones lead to serious steps. In addition, we will group spreads in width, narrow, or simply average, which will allow us to delve into the current processes.
Definition of Market Strength
Marketers generally process and match purchase and sale orders from traders around the world. It’s your job to create a market. To perform its functions, the creator must have sufficiently large participation or values. If you do not have enough quantities on your books to trade at the current price level, you can move the price to a more appropriate level.
Often there are situations in which the bullish movement manages to get a better price from the floor of the bag. Why are you getting a good price? Incredible kindness from the creators? The reason is different. In fact, the market value perceived by market makers is much lower than theirs, because they have already received enough sales orders and want to get rid of them quickly, expecting a reversal of the trend or at least the transition from the market to the uncertainty stage.
Such action, repeated many times with any other buyer, will tend to reduce the spread of the day towards contraction. In other words, the upper price limit will be minimal. If, on the other hand, market makers have a bullish view, they will increase the price on their purchase order, giving you what appears to be a low price. This, repeatedly, causes the spread to expand as the price is constantly marked during the day.
Then, by simple observation of the extension of the bar, we can know the references of those who can see both ends of the market.
Another example is when you find market gaps or price gaps. This term in the technical analysis refers to a situation where there is a gap between the closing of the first bar and the opening of the next bar. For example, the market opens when market makers trap as many traders as possible in a potentially weak market and lose trades and create additional stress. As a rule, weak gaps are always in the zones of new highs, when the news is good and the bullish market seems to last forever.
It should be noted that gaps can be seen in strong markets. However, in such cases, a serious difference can be noticed in the form of an extended plane. Traders who have been trapped inside the channel will panic, convulsively trying to exit the trade at a price very similar to what they first entered. Some of them expect a break in price after having bought assets close at the upper limits of the channel. Others bought at the bottom, but do not see any serious upward movement.
In turn, professional traders are aware of the situation and, looking for the time it takes to sell their own assets, to keep the bullish sentiment raise prices, or open a new candle with a gap up. The volume increases, substantially supporting the movement. This leads to the conclusion that the movement of price is not a deceptive maneuver and the big players really see the strength of the market.
Broad spreads in most cases are designed to block most traders out of the market rather than trying to absorb them. This will tend to postpone, as it goes against human nature, buying something today that could have been bought cheaper yesterday. Such manipulations also frighten market participants who opened short positions near the last minimum in the constant bad news that appeared during this period.
So we draw an obvious conclusion. The volume that usually shows a healthy increase is the bullish volume. However, excessive volume is never a good sign, this indicates that supply can saturate demand. The low volume warns you of a clearly misleading upward movement. In this case, professionals perceive the market as weak, refusing to participate in the bullish movement. The amplifier of this signal will be the presence of a flat before the price jumps to low volumes.
We must also pay attention to the low volume rates in the downbars. This is a sign that the strength of the upward trend remains high, and the upward movement will continue in the foreseeable future.
For a bearish movement, the indications are the opposite. A bearish trend is strong when the falling bars have a high volume. However, excessive volume warns that the fall in price may not be natural and that demand may affect supply.
If the volume is decreasing on bearish sails, the sales pressure is also decreasing, which means that professionals are not interested in a further drop in prices. The market may be declining for longer due to inertia, but, soon, the price may increase due to insufficient supply.
Imagine that you are a doctor and a patient visits you. Instead of conducting a full check-up, you just put the person on the table and start operating. This doesn’t sound good, does it?
Imagine that you are a doctor and a patient visits you. Instead of conducting a full check-up, you just put the person on the table and start operating. This doesn’t sound good, does it?
Imagine that you are a doctor and a patient visits you. Instead of conducting a full check-up, you just put the person on the table and start operating. This doesn’t sound good, does it?
…well, neither does trading without any analysis.
The thing is…we may choose between thousands of different ways to start trading, but there are always a few crucial points to consider. We have all heard stories about people who approach trading as if it were gambling. They rely on emotions, luck, and intuition to determine the future of their finances. However, although this method is wrong and dangerous, what do you believe is the missing component?
If you just took a coin and chose the head as a sign to go long and the tail to go short, you would have a 50-50% chance of succeeding, right? Well, it depends. With knowledge of the market and indicators, a developed toolbox, and proper analysis, this ratio would immediately change.
We need to have a clear idea of where we are going to set our take profit and stop loss and what our risk-to-reward ratio is going to be. These points cannot be determined randomly. We need money management to know how to manage any trade, from entry to exit.
Many professional traders will condemn any vague, unclear approach because, as traders, we can have a much greater chance of winning with the precision and clarity that come with knowledge, analysis, and money management.
No matter which strategy you apply in trading, money management should come first. Calculate your risk properly and do not let the trade run loose.
Traders may prefer lower or higher time frames, trying to make the most out of the chart analysis. Technical traders are going to rely on different tools to gather information about the market. However, to know whether you should enter a trade or not, you can do the naked chart reading as well and still know exactly what you should do to succeed.
Naked chart traders do not use algorithms but focus on what candlesticks are telling them about current market activity. Although these traders do not use any indicators in this case, they still need a developed skill set to generate wins and limit losses.
As naked-chart strategy requires traders to interpret price action signals, they need to determine the overall market direction and read various patterns. Indicators may not be relevant in this trading approach, but managing one’s emotions and attitude is as important as in any other trading style.
Some aspects of trading are universal. Whether you are a technical trader or a naked-chart one, you will need to learn to analyze the market and yourself.
We know how the trading world offers abundant possibilities. Needless to say, trading comes with its own set of risks. That is why some affluent people are keen on seeking advice from experienced traders to ensure a good return. Nowadays, we are also seeing a rise in automated trading (i.e. expert advisors or trading robots) that aims to alleviate the entire trading conundrum and achieve profit without breaking a sweat.
With this approach, traders are free of having to manage each step of the trade themselves. They, however, need to invest in this ready-made system and, preferably, consult with a trading manager as well.
Now, regardless of any easing that comes with purchasing EAs, people still need to understand the strategy that their robot is using. These traders may not be complete or independent, but they must analyze how the EA they chose works.
You may not care about who is running the state or which report is coming out next, but you still have the task of realizing how you are going to manage a new trade. How do you know that something is a signal or not? How are you going to tell if you are in an uptrend or downtrend? Which strategy brings you the best results? The questions may go on and on, and you are the only one who can answer them.
Based on everything we said above, there is no trading without some form of analysis.
To earn a profit, you need to know the key points in your trading, including your maximum risk and potential reward. What is more, earning a sustainable income should also push you towards understanding what triggers you to behave irrationally. For example, your leverage may be too high or too low, but without assessing the whys, you cannot progress any further. Any algorithm you develop can also help your trades run smoothly and prevent future losses.
Some professional technical traders will say how trading is based on three key concepts – money management, trading psychology, and technical analysis.
Now, even if you are not a really big fan of indicators or prefer a different approach, you need to build experience, as it will help you eliminate future mistakes and manage your emotions better. Yet, to get to the point of having a comprehensive perspective of your personality and the market, you still have to carry out thorough testing.
You need to see in advance if your chosen strategy is going to yield results. And, even if it does, you might react differently once you start investing real money. Try to obtain a 360 vision of everything – the market, your involvement, and any tools you may be using.
This is why, whichever time frame or strategy you are using, you need to backtest, forward test, and real-life test your system.
Imagine a situation where you finally started making money, but you suddenly, out the blue, take a few really bad losses with the price hitting your stop loss.
What do you do?
You must assess what went wrong – was it emotions, technical analysis, or something else. How can you improve your trading without recording what you were doing? The only thing that matters at the end of the day is the bottom line. Compare your total wins and losses and see if there are any loose ends.
Trading is more about protecting your account from losses than about sole winning.
You can always use a demo account to see how your approach is working out for you. Any trader with experience will advise you to take notes on every trade you take, including all entry and exit points, indicator settings, and other key information concerning the trade.
Personality tests are also an invaluable tool for traders to get the gist of some negative beliefs that are deeply rooted in your subconscious. You do want to know if there is a part of you that is blocking your prosperity and growth. Finally, understand that whichever approach you take, trading is all about analysis, of yourself and what you do.
You are free to make your own selection of your trading style or even entrust a trading robot with your finances, but do not for one second believe in easy money with no involvement on your side.
Your trading is like a flower bud – you need to devote time, effort, and energy to see it grow, and bloom. Sometimes, you will use less water and more fertilizer to accommodate the changing seasons, but you will always be present, monitoring the development from the seed to the full-blossom stage. If you wanted to take yourself to the next level, you might consider attending a florist competition. That is when you would further build your skills and might even learn how to cut and decorate flowers.
Still, the one thing that connects all the different stages of this process is analysis. Some people are blessed with a green thumb, so they know intuitively what to do to help the flower grow. However, to be an expert, everyone needs to include a detailed assessment of factors affecting their success in their chosen field.
TradingView is a technical analysis tool with a wide range of functions. It is basically a platform where you can perform analyses of different assets and markets in a simple, easy, and intuitive way. But it doesn’t stop there… TradingView offers an online social network service for Traders. It is the most active social network […]
TradingView is a technical analysis tool with a wide range of functions. It is basically a platform where you can perform analyses of different assets and markets in a simple, easy, and intuitive way. But it doesn’t stop there… TradingView offers an online social network service for Traders. It is the most active social network […]
TradingView is a technical analysis tool with a wide range of functions. It is basically a platform where you can perform analyses of different assets and markets in a simple, easy, and intuitive way. But it doesn’t stop there…
TradingView offers an online social network service for Traders. It is the most active social network for traders and investors, where you can talk to millions of traders around the world, and where users share their study of different assets and financial markets as well as being a place to discuss ideas for possible operations. In addition, we can operate directly from the platform if we connect a Broker to our Tradingview account.
What is TradingView?
It is a social trading platform, founded in 2011 and covering a major need for many traders. Since TradingView only acts as an analysis tool for upcoming trades and exchanges between investors and traders, we cannot classify it as a broker… In short, TradingView is a kind of social network for traders that in turn allows for analyses of different markets and financial instruments.
How much does Trading View cost? There are several possibilities as far as account type is concerned. We can get Tradingview for free, and we can opt for paid versions. As we write this article (during the final quarter of 2020), the available options are as follows:
You can create a free account, which provides basic services such as 1 chart per tab, 3 indicators per chart, and a saved chart layout, among other features. Access is limited to one device to the free account at a time.
Payment account options include Pro, Pro+, and Premium.
We have the TradingView Pro subscription: It is priced at $9.95 per month if billing is done every 2 years, $12.95 per month if invoiced every year, and $14.95 if invoiced every month.
Second TradingView Pro+ subscription: It is priced at $19.95 per month if billing is done every 2 years, $24.95 per month if invoiced every year, and $29.95 if invoiced every month.
And finally the TradingView Premium subscription: It has a price of 39.95 dollars per month if billing is done every 2 years, 49.95 dollars per month if invoiced every year, and 59.95 dollars if invoiced every month.
For more up-to-date information on prices and features, you can visit their website.
How to Use TradingView
How to set up Tradingview is one of the questions that every user asks the first time they use the platform. As we mentioned before, it has many tools, different types of graphics, and indicators of all kinds, designed in an easy and intuitive way for easy use and for all types of Traders, both beginners, and experts. Therefore the user will have at their disposal everything necessary to analyze, in a professional and simple way, the assets and/or markets that interest him.
How to operate Tradingview is simple thanks to its intuitive and user-friendly interface. Still, let’s give a brief overview of the entire platform. On the platform, in its most basic format; the one that comes by default before working and customize our space based on the functions of the package we have, we can see:
In the center, we find the price chart.
On the left side, we show the tools available for the analysis of the graph.
If we look at the top we will see a menu that allows us to change the asset, the temporality of the chart, the type of chart we want to have, indicators, or price alerts that we want to program.
At the top right, we can create and save profiles or graphics templates, or switch between those we already have saved. We can also from here modify the view size or some basic design options and properties of the chart as well as publish or share it with other users.
In the extreme right, we will see tools to create watch lists, the news calendar, our published operational ideas, or the option of “help” among other functions.
Finally, in the right area of the screen, we will see a table where we can follow the prices and news of the watch lists that we believe in the menu of zone 5.
As you can see, Tradingview offers endless features and features that will be useful for Traders who are starting their way in the financial markets as expert Traders or Professional Traders.
How to Trade With the TradingView Platform
Many traders ask themselves the following questions, usually before entering the mode of payment, in order to make the most of the platform:
Is Tradingview a Broker?
How to connect a broker to Tradingview?
Which brokers do you support?
All these questions have answers. Tradingview is not a broker, but if you have Brokers that can connect to the platform and so be able to trade with them through the platform and thus avoid having to change screens and simplify and streamline the operation.
Unfortunately, not all brokers can connect to Tradingview, and in addition, these, are changing over time. On their website, we can find the Affiliate Brokers, but we will see how to see it in the platform in a simple way and also know how to connect a Broker with TradingView.
Display the Tradingview Supported Brokers box. To see this, it is as simple as clicking on purchase or sale. We will automatically open at the bottom of our screen the Brokers available to trade with Tradingview, make sure you no longer have your Broker connected or you will be entering with a purchase or sale to the market.
In order to realize everything, we will have to be logged into our Tradingview account and have a Trading account in one of the accepted Brokers. Once we select the Broker we want to connect with, we will simply have to follow the simple steps and provide the information we are asked to provide. Once the broker is connected to the platform, being able to buy or sell will be just one click away.
What we would recommend is to do a bit of land survey and read reviews about Tradingview and its functionality with a connected Broker, as well as reviews from the Broker that we will use before launching into the water. This way we will not make false moves. And if our Broker is not one of the accepted ones, we can always take a look at alternatives to TradingView…
Is Trading View a broker? No, it is not. But as we mentioned, it has the option of being able to connect the broker’s “partners” and thus be able to operate from the same platform.
Alternatives to TradingView
Some examples of alternatives to TradingView may be:
MetaTrader
NinjaTrader
Protrader
Muunship
Trade Republic
Kattana
Tradingview is a platform of great utility for all Trader, be it Novice or expert, where to analyze different activities and financial markets. The reality is that it is a large social network with the aim of operators to exchange analyses, ideas, and opinions. And if we have our broker account connected, it will allow us to operate directly from the platform. It is therefore a platform with many functionalities and therefore one of the most used trading platforms.
Now with the knowledge of three type analysis, let us determine the best type of analysis suitable for you.
Before that, let’s brush up through the previous lessons.
✨ Fundamental Analysis – This is a technique to analyze the market by considering the factors which affect the supply and demand of security (currency). Some of the fundamental indicators include interest rates, inflation, GDP, money supply, manufacturing PMI, etc.
✨ Technical Analysis – It is the analysis of the market by understanding the historical price movements of the currency. In other words, it is the study of price movements using technical tools like candlestick patterns and indicators.
✨ Sentimental Analysis – This type of analysis involves understanding the real essence of trading. Here, we get into the shoes of the bug players and determine if they’re buying or selling.
Out of these three, which do you think can help you find success in trading? Well, as a matter of fact, once can succeed in trading only if they have the knowledge of all these three types of analysis. Let us understand with an example of the hurdles that can come your way if you focus only on one type of analysis.
Let’s say a trader named Tim trade only on technical analysis, and he found a good buying opportunity on EUR/USD. But, after he hits the buy, he sees the market falling straight down 100 pips against him due to some news he wasn’t unaware of. This situation brings in emotions in him by which he ends up closing the trade. However, later in the day, he observes that the market ends up going in the direction he predicted.
Here, though his analysis was right, the obstacles like news and emotions took over the technical analysis and put him in a loss. Hence, from this, we can conclude that technical analysis, fundamental analysis, and sentimental analysis are interdependent on each other.
How to structure your analysis?
Above, we have discussed how crucial and dependent all three types of analysis are. However, there are traders in the industry who have expertise only in a kind of analysis but still manage to grow their accounts significantly. Below are some of the tips on how one must structure their analysis, considering they specialize in technical analysis.
Before you begin to analyze the market, determine if there is any upcoming news on the currency, you’re looking to trade. And it is recommended to stay away from the currency pairs which have fundamental news coming in.
Once you determine the currency pair you’re going to trade, you can begin your technical analysis on that pair.
And most importantly, before you place the trade, you must have a complete plan on all the situations that can possibly occur when you’re in the trade, including position sizing, stop-loss levels, and profit-taking levels. Because, once you enter the trade, emotions take over technical analysis which can make you take incorrect trading decisions.
Therefore, following these three simple steps can drastically bring a change in the way you analyze the markets. Cheers.
A way to analyze the markets other than fundamental analysis is technical analysis. In this lesson, we shall exactly understand what technical analysis is, and also the different techniques to analyze the market using technical analysis.
A way to analyze the markets other than fundamental analysis is technical analysis. In this lesson, we shall exactly understand what technical analysis is, and also the different techniques to analyze the market using technical analysis.
A way to analyze the markets other than fundamental analysis is technical analysis. In this lesson, we shall exactly understand what technical analysis is, and also the different techniques to analyze the market using technical analysis.
What Is Technical Analysis?
In simple terms, technical analysis can be defined as the study of price movements.
Unlike fundamental analysis, where people study the factors which affect the supply and demand of the market, technical analysis involves the study of the historical price movements and the present market condition.
Why should Technical Analysis be used?
Let us answer this question by bringing up an analogy.
The first thing one must understand about the market is that the forex market business is no different from a real-life business.
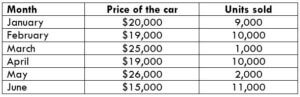
For instance, let’s say there’s a car dealer and they have been selling one particular car for six months by varying the prices every month. And an illustration of the sales report is given below.
Now, from the above table, can you predict what could be priced in the near future? If yes, then you can consider yourself as a technical analyst, as this is what technical analysts do.
Consider the above table. We can see that initially, the car was priced at $20,000, and 9,000 units of the car were sold. Next month, the owner price reduced by $1,000, and the sales increased by 1,000 units. Seeing this demand in the car, the owner increases the price to $25,000. But, this time the sales drop down to 1,000 units. So, the car owner reduces the price back to $19,000. And he observes that the sales increase from 1,000 to 10,000. Later, he again raises the price to $26,000.
Now, by analyzing the past price movements, we can predict with a high probability that the price will reduce yet again, as the previous time the price came to $25,000, the price dropped drastically. Thus, looking at the price of the car in June, we can see that the price did fall to $15,000.
Therefore, the above example, in a nutshell, is referred to as Technical Analysis.
Switching back to the Forex market, the analysis is done similarly. The only difference being the Forex market involves the trading of currency pairs, and the real market consists of the buying and selling of products.
Hence, from this, we can conclude that a market moves as per the historical price movements. The above example is just to give you a gist of how technical analysis work. There are many more complex ways to accurately predict the market using technical analysis. Price Action traders do their technical analysis using different types of charts (like candlesticks, bars, lines, area, etc.), timeframes, and indicators.
Hence, this brings us to the end of this lesson. In the lessons coming forward, we shall be discussing tons of stuff related to technical analysis. So, stay tuned.
The Forex market dances to the beat of its own drum! Unlike investing in the stock market, where stock prices tend to
https://youtu.be/AZKeGuszjrg
Market Analysis – Know Your Market!
The Forex market dances to the beat of its own drum! Unlike investing in the stock market, where stock prices tend to
Market Analysis – Know Your Market!
The Forex market dances to the beat of its own drum! Unlike investing in the stock market, where stock prices tend to go up and down depending on the performance of an individual company, the movement of currencies in the Forex market is wholly more complicated:
For example, all currencies are traded in pairs, such as the British Pound against the US Dollar, or the Euro against the Pound, etc. Therefore, not only do you have to be fully aware of the fundamental economics of one country’s currency, but you also have to be aware of the fundamental economics of the counter country’s currency of the pair you are trading. The two styles of investment are like chalk and cheese!
When it comes to knowing the Forex market, there are three major factors to consider when trading: Fundamental analysis, Technical analysis, and Market sentiment. Let’s look at these three in more detail: –
Fundamental analysis is the way of studying a particular country’s currency by analysing economic, social, and political forces in order to gauge the current and future outlook of that country’s economy and, therefore, the current and future strength of its currency.
Technical analysis is the study of price movements of a particular currency via the analysis of charts and where certain technical tools are used in order to study historical price action in order to predict future price movements.
Market sentiment Is the overall feeling that traders have regarding a particular currency and where that sentiment might be in contradiction to technical and fundamental analysis of a currency and may therefore cause a trader to abstain from a trade (or to trade counter to his/her indicators) even though the technical and fundamental indicators are telling him/her to pull the trigger.
A good example of market sentiment would be that at the time of writing the British pound is currently being bought against most of the other major currencies, including the US Dollar, the Euro and the Japanese Yen, even though the fundamental indications are that Britain’s economy is slowing and could be exiting the European Union at the end of this month (31st October 2019) without a deal (withdrawal agreement), which could be catastrophic for the British economy. Technical indicators also show that the Pound could move further to the downside, especially against the US Dollar. However, the current market sentiment Is that Britain may find a last-minute deal in order to exit the European Union with an agreement in place, and this would be very good for the British economy in theory, and therefore, the Pound.
And so if the above three components are the major drivers of the Forex market, we should be good to go, yes? Unfortunately not, if only it was that easy! Unfortunately, market sentiment also changes from region to region. For example, the Asian region may have a different market sentiment/outlook from the European or American regions, depending on those markets’ industrial and commercial sectors and their economic activities, including the buying and selling of commodities and goods and services.
Also, the Forex markets operate 24/5, from Sunday night to Friday night (GMT), and market volume and volatility varies from region to region and the different time zones. And as a note of caution, a trader opening a trade at 9 PM (GMT) based on his/her technical analysis, just as the American session is fading, and before the Asian session opens, runs the risk that market sentiment in the Asian area might be contradictory to the US region and therefore adversely affect the outcome of their trade.
Here is an example of how to have a better understanding of trading activity and currency volumes and volatility in the various time zones. Traders are fairly predictable creatures, and most traders work for banks or large financial institutions. These guys and girls are able to independently
move the market with their trade size, which is much much greater than that of retail traders. A retail trader might typically trade a few Pounds/US Dollars or Euros per pip, whereas an institutional trader will be in the hundreds of thousands, if not millions per pip. They are usually paid large salaries and are all under pressure to make money for their firms. Therefore, what we usually see is greater volatility in the Forex markets when they arrive at their desks and especially at the beginning of a new session in a particular region because the traders are fresh, eager, and take advantage of the regional time cross over.
Another time of increased volatility and currency volume in the market Is during periods of economic data releases in the various countries. Price action during these times can be extremely volatile, and the reaction of the market can often fly the face of market sentiment, technical and fundamental analysis, as traders try to decipher economic data release information and how it might impact on a currency’s exchange rate.
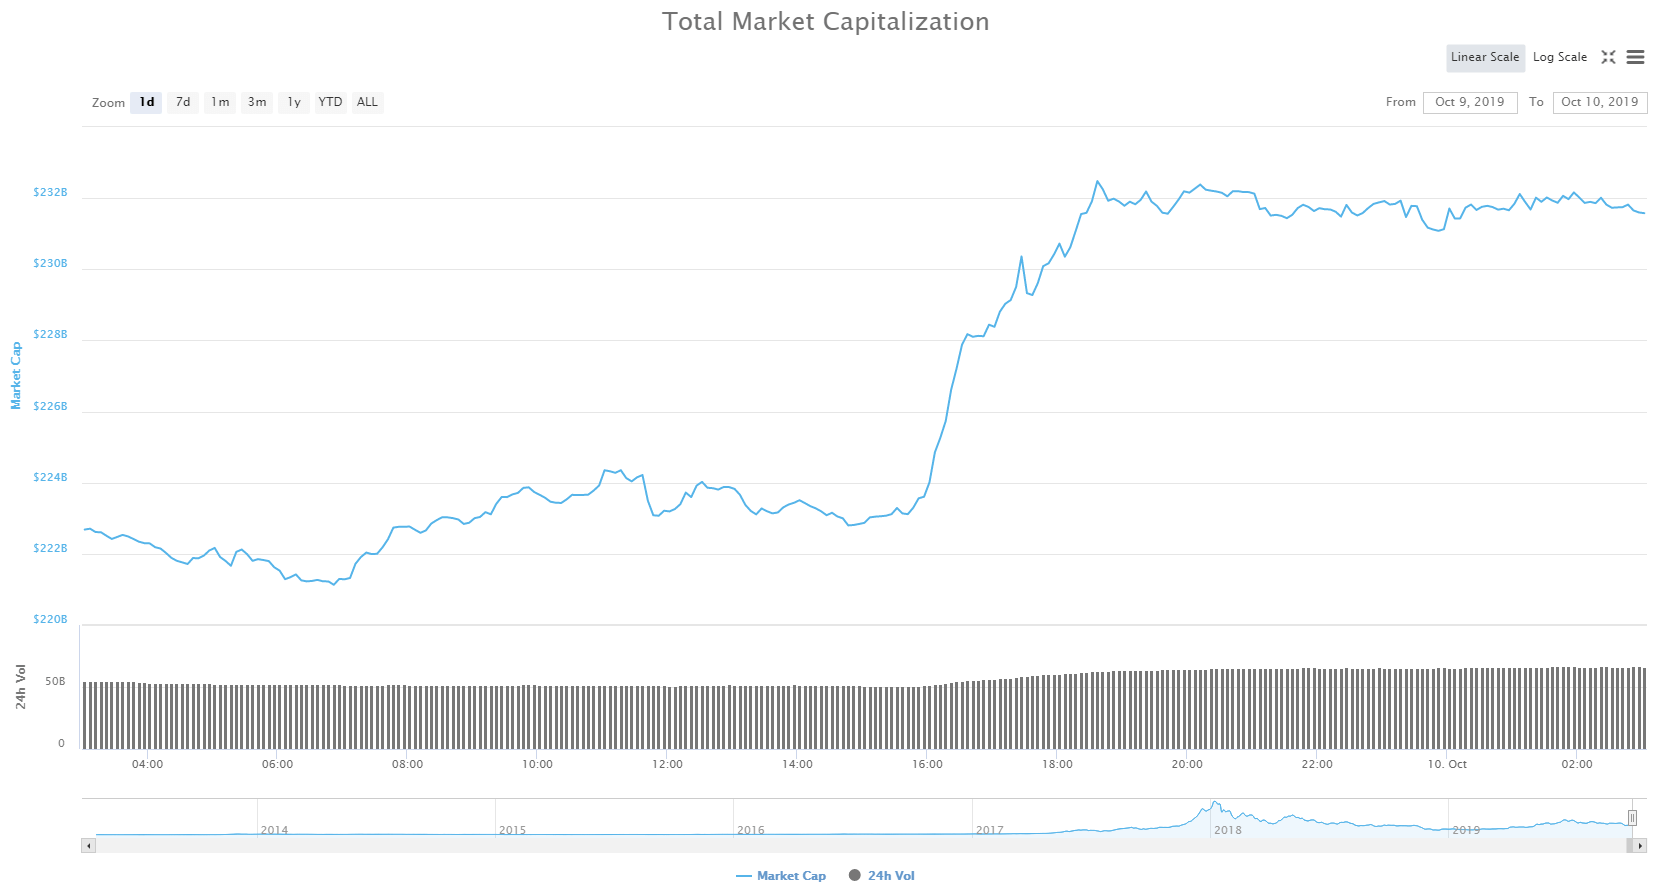
After yesterday’s day of consolidation, the markets decided to head up and test new prices. With increased volume and new money coming into the market, Bitcoin increased its price by
After yesterday’s day of consolidation, the markets decided to head up and test new prices. With increased volume and new money coming into the market, Bitcoin increased its price by
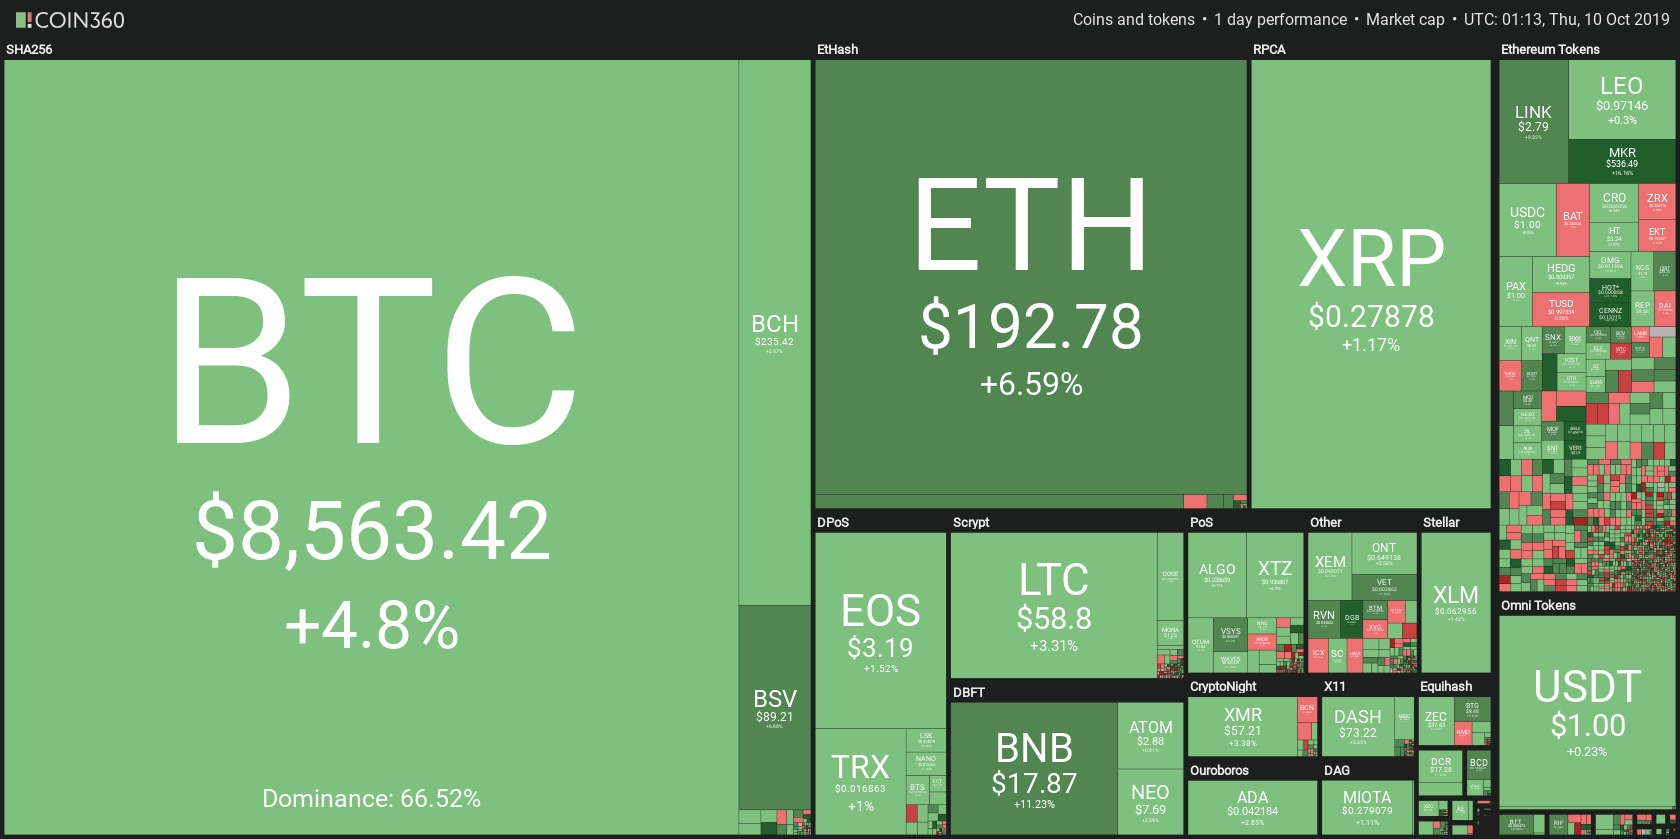
After yesterday’s day of consolidation, the markets decided to head up and test new prices. With increased volume and new money coming into the market, Bitcoin increased its price by 4.5%, while Ethereum managed to go up by 6.62% and XRP by 1.35%. After reaching RSI overbought territories, the prices started stabilizing at the same or slightly lower levels, while RSI managed to settle down.
As both Bitcoin and most altcoins are in the green, the total cryptocurrency market cap has increased. It is now hovering at around $231,8 billion, just down from the daily high of $232,47 billion. Bitcoin is still keeping its dominance high, currently being around 66.6%.
What happened in the past 24 hours?
Cryptocurrency markets, judging by the increase of volume, have had an influx of new money coming. That has sparked some solid price growth, especially if we expand our views to not only Bitcoin but the rest of cryptocurrencies. Out of the top50 cryptocurrencies, only eight have been in the red. Out of the eight being in the red, half of them are stablecoins, which happen to lose out when the cryptocurrency markets go up. On top of this upward-facing move, the prices are not consolidating far below the levels they reached today. In fact, most of the cryptocurrencies kept their gains and are looking promising in the short-term.
Technical analysis
Bitcoin
Bitcoin has reached a new short-term high of just above $8700, before stabilizing its price at just below $8,600. The new influx of money coming into the markets helped Bitcoin surpass the immediate resistances and start making its way up. With volume skyrocketing, Bitcoin flew through the immediate resistance lines and stopped as the volume started reducing. However, it did not lose its gains and started consolidating at the top, which is rarely seen. This move has sparked some new thoughts in terms of whether the altcoins season has started or not. As the price reached the top of the movement, RSI indicated it was heavily overbought but managed to reach lower levels as the price consolidated.
Ethereum
Ethereum has surpassed Bitcoin in gains today, reaching the price of $196.3. It has retained its gains and started consolidating at close to its daily highs, which is a highly bullish sign. However, that may not be as promising as it sounds. Ethereum found new resistance at the $196.3 line. This price point acted as support and resistance as far as September and proved to be effective as both support and resistance. Only time will tell whether Ethereum can surpass this resistance, or if it will fall back to its previous levels.
On a brighter note, Ethereum’s RSI is almost identical to the one currently seen on the Bitcoin chart. After being heavily in the overbought territory, it started to fall while the price did not follow it. Even though the volume died down quite a bit, it still sits at a higher level than what it was before today’s spike.
XRP
Unlike Bitcoin and Etherum, XRP did not have a particularly good day. XRP moved, fueled by the price growth of Bitcoin and other cryptocurrencies, passed the 23.6% resistance line that the Fib retracement from the Oct 7th-Oct 8th move. However, it quickly found resistance at the top of the Fib retracement (0%), failed to break it, and retraced to the 23.6% line, which now acts as support.
Another thing separating XRP from the top2 cryptocurrencies at the moment is volume levels. Unlike the other two, XRP’s volume is currently lower than what it was before the upward-facing spike. Even with the RSI indicator reducing and the price staying relatively high, it might not be enough to keep XRP on a green path.
https://youtu.be/EF9tlpJj9k4
Hello, and welcome to this latest edition of courses on demand brought to you by Forex dot Academy! In this course, we will be discussing market analysis, and
https://youtu.be/EF9tlpJj9k4
Hello, and welcome to this latest edition of courses on demand brought to you by Forex dot Academy! In this course, we will be discussing market analysis, and
Hello, and welcome to this latest edition of courses on demand brought to you by Forex dot Academy! In this course, we will be discussing market analysis, and there is, of course, inherent risk when trading these financial markets. So, as we begin, please do take a moment to familiarise yourself with the following disclaimer.
When discussing the market analysis, first and foremost, we must outline the difference really between trading versus investing, so we can grasp an idea of the market participants that are trading in these markets, and whether they look to hold positions for short medium or long periods. And that brings us into discussing, and really developing upon the trading skills of thoughts. So, what we have is fundamental analysis technical analysis, and sentimental analysis, and these traders whether they have a hybrid of different trading strategies or not will take on board some of these feelings or objectives into their trading then we’ll be looking to trade these perspectives on some price action charting, and just towards the end of the lesson to actually practically apply what we have discussed throughout the webinar first before most let’s try, and define the difference just Anna lemons expression with trading versus investing when it comes to wealth creation in equity markets in particular investing, and trading are two very different approaches in generating a profits in the financial markets okay. So, let us imagine today that yourself, perhaps on the friend bought an equal amount of seeds to sow in in a garden or field we then sold, I sold many seeds in a day because I could earn a profit. So, I’ve traded I’ve made a trade, and they’ve earned a profit that’s great your friend on the other hand and sowed the seeds, and let him grow for a few years till they gave I created new seeds he then sold the new season continued this for years and sold a lot more seats eventually than were initially bought. So, obviously, he has taken a much more longer approach to developing his seeds to developing his purchase and invested those seeds in a future respect us by investing his seeds. Your friend has made a profit in quite a different way than what you made by trading your seats okay. So, two very really a big stark differences here in terms of discussing trading versus investing first of all the time period obviously I’ve decided to buy the seat, and sell them in a very quick period of time I’ve made a short-term profit that’s absolutely fine no your friend or the guy who decided to invest these seeds obviously, and growing more seeds over a longer period, and probably growing his overall perspectives or project, and would have of course made more money on this one particular trade but would have taken or accomplished a lot more time towards this project that is the same for investing over a long period of time. So, ifyou’re looking to purchase, perhaps equity shares in Google or Microsoft or a company of your choosing you will be looking for long-term growth, whereas an advantage as opposed to the trader there it is a short-term profit, perhaps that transaction was completed in 30 minutes or one hour I could make potentially thousands of those smaller transactions, and still make profit, and by potentially lots, and lots of seeds, and sell them resell them at a higher price. So, there’s a big difference in actually these two approaches, but they could both be very profitable approaches to trading at this market in particular. So, just a food for thought there let’s delve in a more detail the differences between trading versus investing the time period trading is a method of buying or selling a security for a shorter time period, and for shorter-term profits today as liquidity allows quick entry, and exit, and profits can be true to leverage okay. So, we know that, perhaps as forex traders we can trade we can use leverage to trade very small amounts of currency but actually to make much better profits in terms of the relational move in the currency pair investors choose to invest capital amounts for longer periods on hope not only to profit for price increases but profit from ownership as well. So, obviously, if you’re looking to invest, perhaps commodity index or, and share a particular share of your choosing you’re looking for capital growth. So, you’re looking for the price to increase over a long period of time but there are many potential up sites aswell, to, perhaps only in the shares that dividends obviously corporate earnings can affect you there, and you can look to actually build a portfolio based on actually only the physical shares aswell, capital growth taking us on nicely to discussing that trading on the other h, and focuses more on the movement of price unders based on more skill from timing investing aims to create long term value unless is less worried about shorter timeframes okay. So, that’s very important to note as an investor we’re not particularly worried about what time of the day that we enter this trade perhaps, if we are concerned with, perhaps only in these shares for a 1-year period or a longer time in search of value. So, that is very important, and potential upside in investing, and al. So, the time focus of trading in terms of that capital growth you could be in a trade for one day or for three hours or for thirty minutes depending on how you’re looking to trade the markets for that capital growth an art versus skill is a good discussion, and brings a lot of analysts who actually to discuss the real techniques involved in both trading, and investing traders are most certainly skilled we have many technical individuals who time the market, and learn market trends to hit higher profits in a stipulated time investors analyze the stocks they want to invest in, and investing includes learning business fundamentals on a commitment to stay invested for a longer-term. So, we do know in terms of our research that it is really much I suppose an art investing a lot of research goes into your to your fundamental analysis, wherethis, whether you’re a short-term scalper or looking as a technical trader for price points or inflection points, are very structured technical analysis to give you your trading signals there’s a certain skill as opposed to the art, and in there within each time period respectively, and risk, of course, is of high-end keen importance here, and in terms of discussing trading versus investing trading involves high risk due to much higher possible returns okay. So, it’s very important to note and more frequent trading. So, obviously traders the reason why we look for those returns, and in terms of the investment community, it’s a very different discussion that you do have you often get investors asking well, how much return do you make as a trader? And for me I really find that a strange question because it’s not relative in terms of return, and only in the portfolio of assets over potentially a 1-year period you’re looking to get more stuck in there in terms of trading the markets, actively trading the markets you might make 500 euros in one make you might make 2,000 euros in one week you might make twenty euros in one week.
So, it’s there it is relative to your current size, and how you trade the markets sometimes you traitor you’re trading verywell, but it’s the consistency over a long period that defines, and makes you a definitive effective trader, where as investing involves lower risk unreturned, and is often a more complex function of price interest on potentially dividends, ifyou’re looking for growth aswell, in terms of return because you’re looking to effectively what you’re looking to do as an equity trader is I’d perform an equity index for higher return let’s say the S&P; 500 is returning 6% in 2018 we will be looking as long-term investors to outperform that equity index, and to really perform in terms of beating the index, and make a higher profit however in relation to trading obviously, ifyou were looking to trade the markets more actively, perhaps very actively for one year 6% over a one year period most certainly would be not a high target at all would be respected as actually looking for those sort of more long-term approach targets let’s discuss the N or trading skills of thoughts first, and foremost fundamental analysiswell, what is it is the examination of the underlying forces that affect the well-being of an economy in history group or company. So, it’s very important to understand, and fundamental analysis isn’t just trading, or it isn’t just investing in stocks, and shares you can have fundamental analysis in a gold market in the commodity itself in any commodity there, coffee sugar wheat oil and. So, anything that you really can do research in to get more knowledge on the fundamentals, perhaps the supply, and dem, and function of that market is a particular interest to you as with most analysis the goal is to derive a forecast, and profit from future price movements okay technical analysis is a methodology for forecasting the direction of prices through the story of past market data primarily price, and volume, and really that’s what all the technical techniques in terms of technical indicators point to that point to either primarily a change in price or a change in volume market participation. So, technical analysis is that study, wherewe use these technical tools we look at previous price action to actually get a formula divide ear of, whereprice is more likely to move to then we develop our probabilities in trading those in terms of stacking the odds in favor as a technical almost on l, and trade in pulling the trigger to actually get involved more heavily with these markets than a fundamental trailer, and then sentimental analysis it focuses on identifying, and measuring the overall psychological state of all market participants it attempts to quantify what percentage of market participants are buyers are sellers, and obviously we know they’re both called bears on bulls respectively. So, we have our trading schools of thought we often see a traders or investors develop a myriad of trading strategies or, perhaps a hybrid approach whether they’re they combine all three or whether they choose to combine one or two together separately, and most traders will develop more of a hybrid approach actually trading the markets, and it does depend on is indicative of what asset class you’d like to trade or invest in. So, let’s discuss in much more detail fundamental analysis what we discussed there is the examination is the underlying forces that affect the well-being of an economy in history group commodities, and companies. So, what does that mean?well, let’s say that we want to trade the 40 fundamentally we want to invest the in the 40, perhaps or, perhaps we are looking for opportunities aware from the 40 100, perhaps more central European markets, and we’re looking to outperform these equity indexes that are, perhaps generating a 4 or 5 percent per year then we can actually look at the 40, and analyse it fundamentally with, perhaps the top ten performers understand, and why the market is, perhaps under price at the moment are in relation to what’s happened in 2017-18 in terms of depreciating sterling that might have a, and certainly how sort of strengthening in fact on UK assets. So, there are some fundamental analysis in the well-being of that economy in high things, and assets a price within an economy let’s go into industry groups, and we know that London is famous for its financial services industry we can certainly do a portfolio of research there, ifwe find that is performingwell, we can use that analysis to look for our opportunities, and we know what companies are, perhaps I’m under, and I performing within the UK at the moment. So, we can use all this research together to really combine a portfolio of our research to give us an idea of value is something under our overvalued, and make an assessment as such, ifit’s undervalued we potentially look to buy that asset and, ifit’s overvalued we potentially look for selling opportunities or look across different sectors for correlated markets to potentially buy those or invest in those assets. So, there is a lot of research that goes into our fundamental analysis. Let’s take a case here. So, what we have here is a bit of comedy sketch I suppose with OPEC I’m Saudi Arabia really leading the charge with OPEC we have the market share pamphlet that we have, and then the quote is fracking Americans. So, we know that there have been I’m really investing a lot in this new process of fracking of drilling down, and in finding oil, and gas beneath the surface of the rocks that has led over the past five years to a huge surge in supply u.s. supply in the oil market. So, what do we do is a fundamental analysis analysts how do we approach this how do we approach first of all our research in this environment how could we potentially assess trading opportunitieswell, let’s move on to actually discuss a bit more fundamentals of thewell, being again of the economy we have what is known here as a shift or an increase in demand, and from D to D-one. So, just with the right-h, and picture there we can see our axes we have WTI crude oil price, and the quantity or that were suppose that’s indicative of demand, and supply. So, you can see as there’s a shift in demand, and from A to B, and that actually will be reflective of an increase or decrease in price given what will happen. So, with our example here with this the increase in fracking in terms of US production it really caused an increase in surgery with the past four to five years in the oil market we know that OPEC and many oil-producing nations have tried to combat this by introducing supply cut extensions, and these are still ongoing in the oil market to look to actually manipulate the price of oil or to keep it above its above I suppose the 50 $60 level we did see a very strong sell-off cause a shift in demand, and, and obviously an increase in the price of that commodity itself, and we often see these retractions or contractions in supply caused a shift in demand, and, and therefore price react in such a fundamental way. So, that’s a bit of a fundamental announced case in the oil market as a traitor you could position yourself for long-term price gains in this commodity, and certainly, that’s something you could have done in 2017, say, at the start of 2017. I was trading around thirty-five, forty dollars. It’s not at sixty, and sixty-five dollars, and we’re seeing that a price fluctuating between 60, and 65. So, I’m certainly a lot of growth in the oil market, and that’s a result of a lot of these fundamental changes or shifts in actually pricing or looking to price the asset here we have a price action chart in front of us this is the gold market, and we see that we have quite a lot of technical analysis already imported on to our price action chart. Now, these are daily candlesticks. So, each of these, and trading periods represents one day in the gold market at the very high we have a long-term resistance level there that’s probably providing some support for sellers in this market in terms of looking to fade this, and long-term strength in the market we can see they’re roughly around six months ago it was trading quite strongly up to that level on immediately reversed with a very bearish trend, and indeed in regards to more relative price action we can see that it has touched the level of resistance one-two, and three times almost, and obviously that is the high of a Fibonacci retracement from the more relative low to high of the market.
So, that would possibly provide us with an indication technically that this market is not looking to continue to the upside. Now, do bear in mind that using these technical indicators do conflict trade ideas at times as well, ifwe look at the moving averages we have three respective lines won’t being a 200-day moving average that’s a red line then we have a 100 day moving average that is our green line, and the more I suppose constructive – – more recent volatility is the orange line which is the 50-day simple moving average, and that won’t move, and in relation quickly move to new changes in price in this market, and that will give us an overall, and Tran structure to the upside that this market is actually polish over those time periods which will actually conflict, perhaps with some of the technical analysis. So, you do need to know what type of trade you’re looking for what term of the trade you’re looking for as a technic illness, and, and what those other measures, perhaps like observing the daily volume, and the relative strength indicator will access, and, perhaps accept or reject your trade decision we can see that the volume did experience increasing momentum with this volatility in the most recent price action it is. Now, looking to decrease over the last three trading periods which maybe would suggest aswell, that, and there is decrease in volume in terms of looking to buy this market as it reaches new highs then we see relative strength indicator it really isn’t giving us a signal it’s roughly around 60 below 70 overbought period but it’s up there it’s getting close to that level. So, it might be something we could consider. So, that is what we do is as technical analysts look it took a bind at many different indicators technical areas or price inflection points of, perhaps historical pricing in a market to actually give us an idea to look for trading opportunities or to stack the odds in our favor in terms of probability. Now, in a plain technical analysis to a more structured short-term view we call these traders or technical traders price action specialists are many traders look to use technical indicators aswell, as observing, and trading the price action to give you an overall technical structure of the price my question that I would like to pose is how would we assess this chart just due to the price action to look for potential trading opportunitieswell, let’s do some analysis here we have from low there we have a bit of a trend to the upside, and as at the bottom of that trend we can see a bullish hammer that would potentially give us a signal that, and there’s no more selling opportunity after that candle close, and that’s potentially the market is looking to reverse it certainly does and causes a very bullish trend in the gold market, and to the upside we can see that supportive of training candlesticks we see a very constructive trend to the upside over, perhaps two weeks price action. So, that would indicate the over all trained structure he’s very solid in terms of polish momentum we see an engulfing bullish combo, and just breaking up for a little from a little level of price consolidation I’ll just point that out in terms of, and address in the market itself we see this, and little Tran structure in here, and then we get a break just to both with this bullish candlestick giving us a signal that there’s potential more momentum for this market to continue to the upside we then see the reversal indecision with her countenance legs up towards the top of the market, and that would indicate, perhaps just looking at the price session we like to call these areas double tops. So, I’ll just draw this in that we can see this double top phenomenon I would indicate to us that we’re not actually getting continued strength to the upside with the candlestick structure themselves they’re certainly rejecting a price movement in terms of bullish activity then we see something quite significant we call this candlestick, and a bearish dragonfly which actually tries to break a level a very supportive level, and then close above the level which it actually has closed quite a bit above this level indeed. So, that would indicate we have some market support in an around er level here, and it’s a bullish market support. So, we’re still looking for buying opportunities, perhaps as a technical analyst or perhaps, ifyou like the selling opportunity from those highs, and with the reversal, and decisions you’re looking for more of those again what we see with the most relative price action just in, and around this point is a market exhaustion I can that’s the gold market. So, it’s from our long-term high it is a lower low excuse me it is a lower high from the most recent price action again, and with the third I suppose shoulder in terms of looking to trade to the downside, and this could be an idea for us to look for potential trades to actually sell this market to the downside. So, that is what we do as technical analysts to use the price action whether you’re a price action specialist or you’d like to combine technical indicators as well, or simply make a hybrid approach indeed that is higher technical traders will look actually to formulate price discovery, and make trades. So, let’s move on to discussing a sentimental analysis sentimental analysis aims to assess at all times who is in control of the markets trading decisions can be made on either a short-term or a long-term basis the sentiment changes in the marketplace shorter-term traders will look for news events to cause a centum shock while longer-term traders will take a longer approach to the bullish, bearish outlook of the market. So, it’s all about assessing who is in control of the market at any given period at any given a price point when you’re actually looking to trade that time period. So, whether you’re looking to trade daily camel sticks only daily camel six, perhaps that structure you’ll be looking for longer-term trades, ifyou’re looking for sentiment shocks you know you break that day down into assessing the five-minute candlesticks I’m looking for sentiment to tell you who is in control of that time period, and in the day, wherethe volatility is suggesting there’s a price shocker or sentiment is shifting. So, what I’d like to pose is a couple of charts here we can actually assess the market, and very basically itself, and it all leads into just focusing on the sentiment or the feeling of the market at that time. So, here is a control of this market. Well, what we see is a very clear trend. Now, I know this is related to actually studying the markets with price action on technical analysis, but this is purely speculative on sentimental analysis by judging the market we can see that there has been a level of recovery. So, that is more of a value question in terms of its fundamental approach there is a level of recovery in the market it’s trending up, and the market is very supportive in this long-term price trend. So, ifwe are trading this in the long term, and again these are daily candlesticks here in our own Swiss market as a forex trader we will of course develop more of a strong sentimental approach to price growth, and more an appreciation in this currency pair let’s move across to yet another currency pair to potentially assess that chart, and really derive an idea of again who is in control of the market here we have the in the end market, and Forex pair, and we can assess it purely from a sentimental approach again. So, again, these are daily candlesticks, and I’ll just highlight that in terms of the actual price chart as well, we have daily count 6 or Canadian yen who is in control of this market, where we see a very well-structured trend to the downside. So, initially, just by looking at the market, we have a directional bias, of course, we do as a sentimental trader it’s all about your feeling of the market, and the market participants or who is in control of the markets are certainly looking for selling opportunities in this market.
we can see apart from the transferor moving very much strongly to the downside. We could see that buyers don’t even enter the market really, we have one buyer are not as quickly I’ve done with some price movement to the downside we have a second buyer again price movement to the downside a buyer comes in potentially looking to trade the market up as buyer 3 we’ll call we see continuation to lower prices buyer for again. So, you can see, whereI’m getting out here sentimentally we are thinking there are no buyers in this market, and we’re seeing this trend structure really start to push to the downside again it does lend itself to discussing it, and that is why a lot of these traders do take on a technical, fundamental approach, and hybrid their trading strategies but sentimental market participants again potentially for not a trader but you’re an investor, and you’re looking to judge sentiment in the Canadian Japanese yen you’re going to observe this market on what you can see in terms of the price structure is that the market wants to trade down on our sentiment is bearish we’re bearish this market, and we’re looking for selling opportunities or potentially waiting for the market to change our sentiment to change. So, that we can look to buy this market that is a very important point aswell, for sentimental traders the times these home traders will have fundamental analysis, perhaps for the Canadian yen, and are simply looking for buying opportunities, and given they need to make an investment in such a market that is certainly the case aswell, and you can get very good trades off just due to how the sentiment, perhaps Lee, perhaps will shift in terms of a short-term shift in sentiment let’s move across to a third, and final market when considering sentimental analysis we have the gold market again, and what we see this is a more relative price section that we have viewed over the last two charts or when discussing technical analysis in different time frames here we have, and the most recent relative price action, and in in the cold market, and what we can see here over, perhaps a month maybe five weeks of trading is that there is no strong sentiment in this market or not can answer. So, many questions for you as a sentimental trader who is in control of the market. Well, neither bulls or bears are in long-term control of this market. It is an upper in turnaround, and not long-time highs but certainly highs of the past three years. So, it is an area of interest for sentimental analysts and traders, and we’re looking for opportunities to really see a shift in this sentiment is the price, and going to really breakthrough or long-term level then sentiment will really shift, and all these short-term traders will really change their sentiment in terms of being bowls in this market, ifthat is the case I do not need to know why as a sentimental trader I just need to know that I want to follow this sentiment as the market shifts potentially as we discussed with our technical analysis that we did have a bit of a price structure at this resistance level here. So, potentially just think logically of this as a trader, ifthe market trades down, and looks to break this level could we argue that the sentiment is shifting to the downside in this market, and market participants or who is in control of this market is actually changing, and towards the bull that the Bears certainly the answer will be yes, and to take that into consideration in our sentimental analysis. So, let’s just put that all into detail in terms of searching potential trading opportunities what I would like to look at just to finish off is on market analysis with different perspectives here, and obviously the question is how you do traders analyse the marketswell, market analysis we know that primarily we have three main schools of thought we have fundamental technical, and sentimental analysis, and those traders obviously look to position themselves with a different decision-making process as trainers in the markets first, and foremost we have a price action short in front it’s the Chinese, and 50 equity index, ifwe were first, and foremost, perhaps a fundamental trader how would we look to trade this marketwell, overall we know that we are in a very strong bull market in terms of higher global equities are performing at the moment. So, that leads us to observe our long-term price trend, and obviously we have a directional bias to the upside; secondly, we understand, and the construction on manufacturing sectors of the Chinese economy to be very strong, and very important in the overall growth story. So, such tech firms are at performing that I would leave to continued growth we know that industry and construction are very important as well, and we have seen bond markets in such metals, and copper, and aluminum over the past year. So, that would lead us to, and to speculate that there is strength latent in this market, and one can follow this momentum to the upside how would we position ourselves on strainers fundamentallywell, the question is always on value we look for value opportunities, perhaps we follow an investor, led by the tip sentimentality, wherewe can look for opportunities to actually bury this market to the upside with a very strong directional bands fundamentally this market is strong how do we look -, perhaps trade this market, ifwe were to apply our technical analysiswell, first, and foremost we can see there is a very obvious trend to the upside. So, that confirms our technical directional bass to be common buyer okay then we look for opportunities to, perhaps follow a price channel we can see a few very well-defined price channels here which leads to or words momentum but remember as technical traders we’re looking for, perhaps levels of plants consolidation. So, we can see one here in the middle it actually starts to follow, and consolidate a trading range. So, we can look for shorter term opportunities, perhaps within this range, ifwe don’t want to trade the long-term we could buy, and sell of course the lows of these trading ranges, and, and when the price structure breaks down they have still a directional bias to the upside we follow the breakout to the upside when that occurs al. So, remember we are technical traders that we can look for shorter term opportunities in potentially some sentiment that may shift the market in the short-term by simply looking at the Japanese candlestick structure here we can see that have a very strong candle, and golfing marbles are to the upside then we have a doji or indecision candle, and then a complete reversal from the next candle there. So, that would lead us to speculate that there will be some continued in the short run at trading to the downside. So, a few potential trades that are obviously both in a long medium, and short-term trading opportunities for the technical trader how did we, perhaps look to trade this market, ifwe were to base our decisions purely on a sentimental analysis approachwell, simply by looking at the price action over the long-term we can answer the question who is in control of this market over the long-term, of course, it is the balls. So, sentimentally, if we take a directional pass, we are, of course, buyers in this market, then we can al. So, look for short-term buying opportunities, wherewe see a sentiment, and combos, and these would be they think about an actual common stick structure, wherethere is more volume, perhaps there is more trading, and the ATR it’s greater than a candle that would lead us to say there’s momentum when the sentiment is stronger in itself or, perhaps a well-formed range whether it’s clearly total control from the buyers that would focus our attention on actually trying to capture these great opportunities as a sentimental trader we al. So, know sentimental traders will look at short-term shifts or changes in the sentiment. So, the name another example here we see a very very significant change in sentiment that leads to the market actually pulling back from new highs for a quite sustained period perhaps, and one week to week period, and then forms a range. So, definitely a good trading opportunity, thereby trying to find these areas, here is another one. Perhaps the market has reached a high on sentiment is changing what the feel of the market participants are changing on the direction of principle that is as a result changing, and allowing these trading opportunities. So, there we can see three very different perspectives in how to actually look to trade these markets both fundamentally technically or sentimentally, and the answer or question is really up to you as an individual trader whether you want to delve into one particular school of thought or maybe embroider or combine all of these approaches into your own hybrid style of trading, and that will develop your own trading strategy of course. So, let’s move on to the webinar review this concludes the lesson what do we learn in this lessonwell, we learned the main differences between trading versus investing whether it is based on a time approach to your old trade or, perhaps you’re looking for value as opposed to actually looking for a short-term price speculation then we discussed the trading schools of thoughts obviously in a lot of analysis within the webinar we have fundamental technical sentiment analysis, and higher traders could actually position themselves in the market. So, that brings us to the end of this market analysis webinar thank you very much for joining us on this instalment of courses on demand, and I brought to you by Forex dot Academy, we do hope to see you very soon bye for now.
Hello and welcome to this latest edition of courses on demand, brought to you by Forex.Academy. In this course, we will be discussing how
[embed]https://youtu.be/JHf9964Cdr4[/embed]
Hello and welcome to this latest edition of courses on demand, brought to you by Forex.Academy. In this course, we will be discussing how
Hello and welcome to this latest edition of courses on demand, brought to you by Forex.Academy. In this course, we will be discussing how to assess market conditions. Just before we begin to explain what’s involved in this Webinar, please take a quick moment to familiarize yourself with our disclaimer. Moving on to our webinar outline, we’ll start with an introduction to market conditions. We’ll then progress on to looking at the three different types of market conditions. We’ll have a look at the role different time frames can play when it comes to identifying market conditions, which is quite important. We’ll have a look at techniques that can be used to objectify market conditions, of course, being objective in the market is a really important skill to have, so we look at that in some detail. We’ll then have a look at the principal of a price cycle and how it can impact market conditions. We’ll finish this Webinar by looking at how to incorporate market conditions into one’s personal training plan, so we’ll make it very relevant and very practical for you as well.
Let’s start with an introduction to market conditions. Before we define what market conditions mean, it is important firstly to note that it is impossible for a trading strategy to work all the time, which is also known as indifferent market conditions. The reality for profitable traders is that, unfortunately, losses are inevitable, and there is no getting away from that basic principle. Now, the reasons for this are often that every trading strategy approach will be built on specific characteristics, which can from time to time contrast with the conditions of a particular market. It’s a case of certain approaches, suitable for certain market conditions, and invariably you will experience times where there’s actually a clash between the market condition and the strategy that’s looking to be adopted. It’s important to take note of the fact that with a trading strategy, it is unrealistic to expect that strategy to work in every different type of muscle, market environment, and market condition. To give you a brief definition, this is the state in which a market trades. In simple terms, markets typically transition between states, or different market conditions, on a regular basis. It is important to note that each state, or market condition, possesses its own unique characteristics, which we will have a look at shortly.
Now, there are three different types of conditions which a market can experience, and I’m sure you’re probably quite familiar with some of these terms. They can be Range Bound, or also known as consolidating markets, but they can also become Break Out market conditions, which have very unique characteristics as well, and also Trending markets. What’s important to take away is that they all have specific characteristics when it comes to the best time to buy or sell, which we’ll be looking to discuss in some detail very shortly. To give you a very quick snapshot, looking at this first graph, we can identify what’s called support and resistance levels on this chart. With the blue lines, we can clearly see and identify that the market bounces off these levels, and it does so on a number of occasions. That presents those that are range-bound traders the opportunity actually to sell. When the price gets up to these levels up here, they look for opportunities and see if they can sell these markets and drive the price lower. They do so on numerous occasions, so that’s how a range-bound trader would look to capitalize; create a trading edge when they trade these markets. The same applies to buyers when they look to trade these market ranges when the price reaches a low. There are certain characteristics which can be used to define a trading opportunity, but in principle, and broadly speaking, they would be looking for opportunities to buy at the lower end of the range and looking to sell the market at the higher end of the range. So, that’s the approach a range-bound trader would like to take when trading a market like this.
Another type of market condition is referred to as a break-out of the market. This is when you receive, or you experience a certain confirmation – which suggests to you that this market is no longer looking to move and stay within a range. So what you find, you need certain confirmation to actually make this trading decision and a trading strategy. Just looking at this candlestick here, you can clearly see we break through with momentum, and we get a close beneath this level. That is a little bit of a game-changer for those that look to trade breakouts on this particular occasion. So, what you will experience is that it will provide an opportunity, in this example, to potentially look to sell this market to the downside.
Now, the third type of market condition. To sort of give you a very brief introduction to a trending market, and what’s important to sort of takeaway from a trending market. This just happens to be a bullish price trending market, meaning prices are pushing to the upside. When you look at a price chart, you will notice that for a trend to be bullish, what you’ll experience is often the price for the beginning of that particular trend to be very much towards the bottom left-hand corner of your trading screen. If the trend is to the upside, what you’ll often experience within that trend is higher prices on the right-hand corner of your trading screen. There are additional characteristics, which we look at in so much more detail very shortly.
To give you a brief introduction and a general overview, you’ve got three significant phases. You’ve got your range-bound market, i.e., a market that clearly moves within a range, you’ve got your breakout markets, and you’ve also got your trending markets. These different types of markets can present traders with some interesting and very profitable opportunities. Let’s take a look at these three types of market conditions in a little bit more detail.
First, we’ll look at range-bound market conditions and the fact that they do possess some very unique characteristics. For a range-bound market to exist, you will need to see the market respect both a clearly defined level of support resistance and see prices bounce off those levels on multiple occasions. I’m just looking at this price chart and using this as a first example. We can work with what’s called genuine levels of support resistance, and you can identify those levels fairly easily. What we can see is a clearly defined range-bound market, which moves from highs to lows and back to highs. It does this on many occasions and therein lies the opportunity for a range-bound trader to, like we’ve alluded to before, look for opportunities to sell the highs at this top edge, and look to buy the lows, which is the bottom edge of this particular range.
Another example to go through would be identifying the price action. Again, looking to determine the range, and there are some specific characteristics that would need to be seen and achieved. When we work with genuine levels of support resistance, we can identify these levels relatively easy. It’s never important to be incredibly precise with the positioning of these supports and resistance because what you can clearly see is the market respecting roughly that sort of level. That gives traders some incredible opportunities to trade.
The three conditions that need to be met for a potential for a range-bound market to actually be performed are as follows; first is with regards to the move. By this, we mean this market is clearly moving to the downside. It creates an initial low, and that low is actually the first important part of the formation of a range-bound market. The second characteristic we are now looking for is actually with regards to the recovery point, and we just refer to it as a point because it does create a high in the market. Initially, the move has been very aggressive and very bearish in this particular example, and it creates a low. Then, we normally get a bit of a recovery point, or a pullback on this market, which creates a recovery point. That’s what range-bound traders look for; they look for these points, wanting the market to behave accordingly in and around those levels. The third characteristic, which would be required to effectively look to establish a range-bound market, would actually be the range-bound trade. This is when your range-bound traders would look to effectively identify an opportunity to actually look to push prices higher, as far as this particular market is concerned.
Again, that gives us some very useful information. If we take it over to the next example, we can go through that same process again, except this time the move is coming from down to up. So, we’re now in a bit of a bullish market, up to this point it creates a high. We get the recovery point, which can be located at this level in here I located at number two. As you can see, the price continues to behave around this level for a reasonable period before, effectively, we get our range bound trade. This is where your range-bound traders would look for opportunities to sell this particular market. If they get an opportunity, they would look to exit around the lower band, whereas on the left-hand side example, a range-bound trader will be looking to buy this market, and they’ll be looking to exit at the top edge. In this particular example, we’ll be looking to a range-bound trade, looking to sell the market at this point and looking to exit roughly around the lower edge, so it obviously presents some very interesting opportunities for traders. That is effectively range-bound market conditions and how traders interpret them.
The next type of market condition we’re going to look at is our breakout market condition. Again, these possess unique characteristics. Firstly, for a breakout market to exist, you will need to see an initial break out of a range-bound market. All breakouts occur from range-bound markets, so straight away, hopefully, you can see the transition from one market condition to another. You will also need to see explosive momentum and volatility in favor of the direction of that particular breakout. To give you a little example, there’s your support resistance levels, and you can clearly see this market breaking above this level. We have the confirmation that we’re looking for, we get to confirm the break. It’s always nice to see the market come from a much lower position. It certainly gives lots of time to look to try and capture this move when we get that breakout trade above that level, looking to drive prices to the upside and that’s what we’ve seen in this particular example. It’s very important that we identified a potential for a breakout and we use our range-bound levels to do that. When we get a breakout of those levels, we can clearly see that we experienced explosive momentum and volatility in favor of the direction of the breakout. If we’re breaking to the outside, we want to see a nice explosive move and look to capture that as a breakout trader.
To give you another example, this time to the downside, we’ve got a slightly different formation in terms of our range. This is effectively a descending triangle, so it’s actually creating a little bit of downward price pressure looking to push prices lower when prices reach these levels and of course we get our breakout trade, which is what we’d be looking to do in this particular example.
The two conditions in this case that need to be met for the potential for a breakout market to be formed; the first one being the initial explosive move close are the momentum closure, should I say above or below the range. If this is our range to the upside, you know, do we get an initial explosive move to the upside? The answer is, we certainly do. In this case, it’s above the range. Do we get continuation with a series of new highs on this particular occasion, where we’re getting this constant sort of pushing or prices? The answer is yes, we do. This is a classical understanding of a breakout market, and it ticks those particular boxes. Now, with this trade to the downside, we’re seeing exactly the same thing, so we’re getting a confirmed close. On this occasion, beneath the range low, we ask ourselves if we get that initial explosive momentum close to the downside below the range. The answer is yes, we do. The continuation can take a variety of forms. As you can see, we’ve got a nice continuation with the following candlestick and a little bit of a pullback before the market starts edging lower. As long as it conforms with seeing an explosive move above or below the range, then it constitutes a great opportunity for breakout traders. Just looking at the final version would be looking at trending market conditions.
Again, they possess quite unique characteristics as well. First, for a trading market to exist, you will need to see an initial break out of a range-bound market, so you will also need to see continued momentum and volatility in favor of the direction of the trend. Most importantly, you will need to see a series of what are called higher highs and higher lows in an uptrend and lower highs and lower lows in a downtrend. To explain this in more detail, we’ll have a look at this particular example on the left-hand side. To identify the fact that this market moves from the bottom left to top right means that we are in a confirmed uptrend pushing prices higher; however, you will also need to see periods of momentum and volatility in the direction in which we’re wanting to trade. There are numerous opportunities where you get nice and green explosive candlesticks in this particular example, pushing prices higher. That should give you more confidence to know that the likeliest response for this market to keep pushing prices higher.
As you can see on the screen currently, there are numerous examples of being able to see and identify that momentum and volatility in the direction of the trend, which in this case is pushing prices higher. What you would also need to see is what’s called a series of higher highs. These are quite easy to identify, and we will refer to it as in this particular example h/h. As you can see, as the market moves it up in favor, we get to experience a higher high, and this happens on numerous occasions, so these highs are actually higher than the previous highs. This is the classical definition of a trend, where you constantly see a series of higher highs back-to-back.
In addition to higher highs, what you would also need to see is the market being supported from the downside. What we mean by that, is you will also need to see what are called higher lows. We call these HL, for higher lows, and as you can see, these higher lows will be printed in a similar fashion to the higher highs. As the market pushes higher, we get a classical understanding of an uptrend, which prints a series of higher highs followed by a series of higher lows. I’ll just finish off these last few, and this is a classical definition of an uptrend, so hopefully, that makes sense. Prices continue to push higher, so in addition to that, we’ll move it along.
We’ll have a look this time at a trending market to the downside in this particular example. Again, what we want to see is the momentum and volatility to the downside, which is overriding the buyers in this particular example, and that’s showing nice continued strength. Keep looking to flush prices lower, so we can physically see the momentum and the volatility in this market. That’s the first thing, and we can see this as this market continues to drop lower now. We can identify this as a downtrend because the price this time is moving from top left to bottom right. What we can see is this market moving in this direction fairly consistently.
Another important characteristic of a downtrend is the fact that we will see it’s the same as an uptrend, but just reversed. We will see a series of what are called lower lows. As the market moves, it’ll print a series of lower lows on numerous occasions as this price moves in favor. This again is a classic definition of a downtrend, but you’ll also get support preventing prices from pushing higher, and these are lower highs. As you can see there, the higher the market, but they’re lower than the previous levels. Again, you get a series of these printed. These are lower highs and lower lows as this market moves down, so this is a classical sort of definition of an uptrend and a downtrend. As you can see, it’s just the polar opposite of each other.
That’s a good overview of the three different types of market conditions, and we hope you can begin to identify and see the opportunities that this can present for different traders whether you’re range-bound, whether you’re a breakout, or whether you are a trader that looks to trade the trend.
Another important topic to look at when we’re looking to identify market conditions is the timeframe in which you are trading. It’s important to note that all market conditions are relevant to the time frame you are wanting to trade, meaning you might experience, for example, a range-bound market followed by a breakout and a trend potentially on a one-minute chart, which you may struggle to see, or you might struggle to identify with on a much higher timeframe. For example, on a four-hour chart now to explain this in a little bit more detail, and let’s share with you a live chart at the point of this recording. I’ll try and explain this in more detail for you. Just looking at this bit of price section, what we can clearly see on a one-minute time frame, and this just happens to be the eurodollar, but what we can see is prices trending to the upside. We’re getting this sort of pattern, where range-bound traders may be looking for opportunities to buy and sell within this framework. As you can see, there would be multiple opportunities potentially, until something happens. At this particular area, we get a little bit of a breakout to the downside, and for that, there’s a level of support resistance, sort of sitting in this level. You can see that the market clearly breaks through that level with a little bit of volatility coming into it, which could present opportunities for breakout traders to look to see if they can push this market lower. This is just an overview effectively of an approach that might be taken from a range-bound trader in a much smaller timeframe.
Look what happens when we increase the timeframe. A lot of that analysis can subside very quickly, indeed. Now, we’re looking at a market which is clearly moving to the downside. It can be argued that there are some clearly defined levels of support resistance sitting in this market, and this market is breaking out to the downside. We’ve got a little bit of a pullback inside that level, so it’s a slightly more convoluted picture. All we’re doing is straddling what we thought was a level of support resistance, which can clearly be defined as actually being relatively close to being a significant level of support resistance, but as you can clearly see, the price action is bouncing above and below it. Now, the view could very much be that this is a range-bound market. Those that look to trade range might look at this price action and identify some opportunities, but let’s increase the time frame again and see what other information it gives us. Again, we are actually able to see a market which has bounced off a low. It’s created a new high and all we’re seeing at the moment is a little bit of a pullback, with some consolidation. At this moment in time, price is moving sideways for a relatively short period of time. Taking that analysis, a range-bound trader might look at this price action and suggest there are opportunities to trade this range. That would be down to the trader’s methodology, as to whether that’s the case. As we go through the different time frames, you can suddenly start to see how choppy this price action really is and that can give you some really useful information. Not only are there identify opportunities and much higher risk opportunities, the lower timeframe you go, and they can be based on a different rationale.
Looking at this hourly chart, you can see that the market has been moving above and below this particular level of support resistance on an hourly timeframe for a significant period of time. Again, if we go up into timeframes once more, the picture begins to change. What we’re looking at here is a pullback of the previous high, and this is for an hourly chart. This is where your pullback traders or your trend traders might look to get involved in this market. The breakout has already occurred. We get a pullback, and they might be looking to buy the pullback in a situation like this. On a daily timeframe, you can see what’s beneath it, which is a significant bull market; however, it must be addressed that market conditions can shift from one market condition to the other. Clearly, on a daily timeframe, we are getting a bull market, but it has to be said that since we’re looking at sort of mid-January, we have moved from a bull market into currently a range-bound market. We’re getting prices that move above and below our levels of support resistance, so therein lies the potential for different types of traders. The necessity really is for any trader to be able to identify the market conditions, obviously, prior to trading them. Hopefully, you found that useful in terms of the importance of timeframes. It can really look to give you a completely different complexion and outlook, depending on the timeframe that you are looking at.
Moving on to techniques that objectify market conditions, this is really about a trader looking to remain objective as much as possible. To give you a brief definition, objectivity is the lack of bias judgment or prejudice, and that can facilitate some significant benefits to traders. Now the question we need to ask, is how can a trader remain objective when assessing market conditions? There are a couple of ways in which we can do this. This is when technical analysts can come into their own because they can use certain training related indicators to help them remain as objective as possible when identifying these market conditions. We’ll go through three of them now.
The first one is just identifying support and resistance. I didn’t find genuine support resistance normally on bigger timeframes, and this will allow you to assess the market conditions properly. So, when we look at price action like this, it’s very choppy. We can literally apply a technique. It’s something that we’ve used in previous slides, and we’ve discussed it a little bit now in detail, we’re simply looking to identify a top edge or a top edge range in this particular market and a lower edge or a bottom edge range. We’re getting this market moving from highs to lows, and doing so in a relatively consistent manner when we identify these genuine levels of support resistance because that’s what’s happening. They’re supporting prices at the lows, and they’re resisting the price from pushing higher at the highs, and that is what can give traders some significant opportunities. As you can see, we have price action, which is slight and obviously slightly bearish to the downside, but very much moving sideways. That’s really what you would need to take away from price action like this, that you are clearly in a range-bound market. You have your range-bound highs and lows, and the market is bouncing in between them. If you happen to be a trend trader, this is not really the market condition in which you would be looking to execute trades. That’s how support-resistance can be used to remain objective. All you would need to do when using support resistance is to basically acknowledge what you are seeing and not psychologically talk yourself out of what is actually happening. That is just a little bit about support resistance.
Another technique that could be used is a basic understanding of Japanese candlesticks, and of course, this works hand in hand with support resistance. An understanding of Japanese candlesticks and their respective support/resistance will help you with objectivity. Again, we’ll have a look at this same chart. We’ll identify those levels of support resistance, as in the previous chart, and we can see that price is slowly moving down, making lower lows and lower highs. There’s a gradual grinding to the downside where we can look at the Japanese candlesticks and the information they’re telling us, which is that we are rejecting prices from moving higher at these levels. It’s doing so on a number of occasions, so that can give those that understand Japanese candlesticks a good opportunity to look to try and sell these markets at these levels. As you can see in this particular example, they can do so on many occasions, and the same applies to the downside.
So, we can identify if we understand Japanese candlesticks and how they respect and react with levels of support resistance. All of a sudden, we can pin this is a range-bound market. For those range-bound traders, this can provide really interesting opportunities to push higher. The reasons why they can make these decisions is because they’ve got a comprehensive understanding of market conditions. Again, you can see the rejection to the downside on many occasions within these areas. You can see the same again just recently, so your range-bound trader would be looking for an opportunity to look to take this price back to the upside. They’ll continue to do so until this range, the market condition that we’re currently experiencing, transitions to a new market condition, so that’s another technique that can be used to object to find market conditions.
When you apply this moving average, you can still identify visually your support-resistance. You can have a comprehensive understanding of Japanese candlesticks, but if you apply a very straightforward simple moving average to the chart (you can do so on any MetaTrader 4 platform), you can generally sort of identify. Don’t forget this is the moving average of each candlestick over a certain period over a certain number of candlesticks. As you can see, you should derive at the same conclusion, which is that this market is ever so slowly drifting slightly to the downside and is very much range-bound because we’re getting prices breaking above the moving average, and below the moving average. This is happening on many occasions, and that’s why a simple moving average can assist you with being able to remain objective about what is truly happening with this market. We can see this moving average, that prices are trading through it on many occasions and that is obviously a good thing for range-bound traders. It can provide them potential opportunities to look to sell the highs and buy lows, and this is just another technique that can be used to assist you with market conditions.
Moving on to price cycles and market conditions, price cycles can also be used by technical traders to support the identification of market conditions. There is cycle theory, and it asserts that cyclical forces both long and short, without doubt, drive price movements in the financial markets and that price cycles can be used to anticipate turning points in a particular market. These turning points can often be identified as periods of consolidation, or clearly defined in indecision, effectively allowing the market to pull back. Do not expect psychoanalysis to pinpoint reaction highs or lows necessarily. Instead, psychoanalysis should be used in conjunction with other aspects of technical analysis and to try to anticipate these turning points to a greater degree. To explain this in a little bit more detail, price cycles can also be used by technical traders to assist with the identification of market conditions.
I want to share this chart with you, this happens to be an S&P 500 daily timeframe, and you can see that the timeframe along the bottom is over the last four years. You can use price cycles, and it’s a well-known price cycle with regards to the S&P. There are a couple of caveats to this because this is a more recent chart. There’s been a number of developments within markets like the S&P 500, which has changed what used to be a little bit more reliable price cycle. Nonetheless, if we roll this on that there’s just a MACD down the bottom of this particular chart, which you can reference as well, and what this particular chart shows is a typical price cycle that you may experience in the S&P 500. The principal of the price cycle in the S&P 500 is that normally between November and April you’re likely to see prices push higher, and from May through to October you’re likely to see a price cycle where prices are squeezed lower. These can move to varying extents, which is why it’s important to make sure if you’re conducting price cycle analysis, that you are combining it with other, more reliable forms of analysis. Nonetheless, in each of these sections of the year, you’re likely to experience prices pushing higher, and you can see that in three out of four out of these periods, even though this middle one here has experienced a significant pullback. It has spent a majority of time retracing that particular pullback. The same applies from the upside, so it has been historically expected for prices to look to move lower during this particular cycle. As you can see, it doesn’t always ring true, but it is important to know that price cycle analysis should be combined with other methods of technical analysis. So that’s just a little bit about price cycle in conjunction with market conditions.
Let’s move on to how to incorporate market conditions into one’s personal training plan. The first thing to do is for you to decide the type of trader that you are. Do you prefer to try ranges, breakouts, or trends? That’s the first thing, because obviously there’s multiple opportunities, depending on your time availability and things of that nature. More experienced traders can trade multiple market conditions as well. Then, it’s just a case of looking to get really good at identifying the unique characteristics of each particular trading style. Whatever approach you want to adopt, whatever fits your personality, your capital, and your time availability. Then focus on the key characteristics of that style and take it on board; obviously, the timeframe that you would like to trade, and of course your tolerance to risk as well. Finish with a personal trading plan, to identify market conditions before executing a trade, something most new and experienced traders really struggle with. Please make sure you first identify those market conditions before you execute a trade. Don’t just jump into the markets blindly.
A basic trading methodology should look to revolve around things like deciding what markets you would like to trade, which is trade selection. Then, identify the market conditions of that particular market, and once you’ve identified that, and this is how it fits into a personal trading plan, then you can focus on the trade setup characteristics.
Let’s say we are a range-bound market. We need to set up the characteristics of seeing those top edges and looking at the Japanese candlesticks on whatever indicator you may be using, or whatever form of technical analysis you may be looking at, to adopt those characteristics and see if that trade conforms with those characteristics. The more criteria that are reached, the more confidence you should have in that trade and the more consistent you should become trading those particular setups. Then, your approach needs to focus intently on trade entry, what price are you actually looking to get into that market, and of course trade exit as well. So, we’re talking about risk management and making sure that you always draw that line in the sand, in terms of making sure that you mitigate risk obviously as quickly, or as well as you possibly can, and really have a strong focus on protecting your capital. The final part is obviously the trade management side, which will hopefully lead to a successful outcome for you. Within trade management, you’re talking about how you can mitigate risk. Can you look at a book and profit in that particular trade? Should we be looking to cover the position, or take profit? Whatever the case may be, you’re managing that trade as effectively as you possibly can. This is just an example to show you how identifying market condition fits in with an overall trading approach.
That just about concludes this particular Webinar. To review, we’ve introduced market conditions, and we’ve looked at the three different types of market conditions. We’ve looked at the importance of looking at different time frames, we’ve looked for some techniques to objectify market conditions, we looked at price cycle, and market conditions as well. Finish there with how to incorporate market conditions into one’s personal trading plan. All that’s left for me to do is to thank you very much for joining us on this latest installment of courses on demand, which have been brought to you by Forex.Academy. We hope you enjoyed it and we hope to see you soon. Do take care and we’ll see you soon. Bye for now.