Categories
Forex Course

173. How To Trade Using Three Different Trading Timeframes?

Introduction

Our previous lesson covered how to use multiple timeframe analysis to find better entry and exit points. Timeframes in forex trading can be categorised into three: long timeframe, intermediate timeframe, and short timeframe. This lesson will illustrate how you can trade with three timeframes depending on the type of forex trader you are.

Depending on your forex trading style, the long timeframe is used to determine the prevailing market trend; the intermediate timeframe used to show the consistency of the observed trend, while the short timeframe used to determine the best entry and exit points for a trade.

Long Timeframes in Forex

The long timeframes are used to establish the prevailing primary trend of a currency pair. Depending on the trading style, the long timeframes in forex ranges from a 30-minute timeframe to a 1-month timeframe.

Day trader long timeframe: 1-hour GBP/USD chart

For a forex day trader, a 1-hour timeframe shows the prevailing and dominant downtrend in the GBP/USD pair. Using this timeframe, you can establish support and resistance levels.

Intermediate timeframes in Forex

These timeframes are used to establish the current market trend. The intermediate timeframe in forex helps you to determine the magnitude of the trend observed with the long timeframe. It is expected to see more price fluctuations when using this timeframe, but the general trend should align with the long timeframe.

Day trader intermediate timeframe: 30-minute GBP/USD chart

As can be seen, the price pullbacks are more visible using the intermediate timeframe. The price fluctuations are more pronounced as you can see how the primary trend observed with the long timeframe is broken down.

Shorter timeframes in Forex

Depending on your forex trading style, the shorter timeframes show the most current and shorter changes in the price movements.

The shorter timeframes are used to determine the best entry and exit points of a trade. With shorter timeframes, you can quickly establish whether the price has reached the support and resistance levels.

Day trader shorter timeframe: 15-minute GBP/USD chart

Using the 15-minute timeframe, the day trader can quickly establish the entry positions for shorting the EUR/USD when the price bounces from the resistance levels.

Trading three timeframes helps you establish the dominant trend, narrow this trend down while determining its magnitude, and finally establish the best entry and exit points.

[wp_quiz id=”89198″]
Categories
Forex Course

168. Learning To Trade Multiple Timeframes In The Forex Market

Introduction 

In our previous lesson, we discussed multiple timeframe analysis in forex means. Now, let’s find out what forex trading with multiple timeframes means. In case you are wondering, trading multiple timeframes in forex does not mean that a trader is opening several positions using different timeframes. We are not saying you can’t do this, you if you have the money; but that is not what trading with multiple timeframes in forex means.

Trading multiple timeframes in Forex means using different timeframes to establish the trend and support and resistance levels of a currency pair to determine the best point of entry and exit of a trade. Let’s use a few examples to show how trading with multiple timeframes in forex occurs.

As we had mentioned in our previous lesson, the timeframes you use for your analysis depends on which type of forex trader you are. The best way of trading multiple timeframes in the forex market is by using the top-down technique. With this approach, you first observe the longer timeframes for the general market trend, then use the smaller timeframes to establish more current trends.

Let’s take the example of a forex day trader. You will start by using the 1-hour timeframe to establish the primary market trend. Say, a day trader wants to open a position on September 9, 2020, at 11.00 AM GMT, using the 4-hour timeframe, the market shows an uptrend.

4-hour timeframe for EUR/USD

1-hour timeframe for EUR/USD

The 1-hour timeframe confirms that the pair’s intermediate trend is consistent with the uptrend observed in the 4-hour timeframe.

15-minute timeframe for EUR/USD

The 15-minute timeframe can then be used to select the best entry point.

Determining the market limits: the longer timeframes will enable you to determine the support and resistance levels of a currency pair. The resistance levels help you set your exit points while the support levels will help you timing your market entry.

Establish the trend momentum: While the larger timeframe gives you the overall market trend, the smaller timeframes will help you establish the spikes in the price of the currency pair. These spikes will help you to establish the short-term strength of the trend compared to the longer-term trend.

Helps avoid the lagging effect of some technical forex indicators: Most technical Forex indicators are lagging, meaning trend changes signaled by the indicators lags the real change in the price of the currency pair. Therefore, price-action can be said to be leading the technical indicators in the forex market.

We will cover these three reasons in detail in our subsequent lessons.

[wp_quiz id=”89146″]
Categories
Forex Basic Strategies

How to Profit Using The ‘Gap and Leave’ Forex Trading Strategy

Introduction

Gap and Leave is an interesting trading strategy that utilizes one of the most distressing phenomena of the forex market, a weekly gap between the last Friday’s close and the current Monday’s open price. The gap takes its origin in the fact that the interbank currency market continues to react on the fundamental news during the weekend, which results in a kind of opening on Monday at the highest level of liquidity. Today’s strategy is based on the assumption that the gap is a result of speculations and excess liquidity. Therefore, a position in the opposite direction should become profitable after a few hours.

In the past few articles, we discussed strategies that were pertaining to ‘trend pullback.’ Now, we will shift our focus and talk about a strategy that is best suited for trading a ‘range.’

Time Frame

This strategy works well on the 15-minutes and 1-hour time frame. Traders looking to trade intraday should use the strategy on the 15-minutes time frame. While traders looking for swing trading opportunities should look at 1-hour charts.

Indicators

No indicators are being used in this strategy. It mostly relies on price action and market speculation.

Currency Pairs

This strategy is suitable for trading in currency pairs, which are volatile and liquid. Also, since the Asian market is the first one to open for trading after the weekend, we would suggest applying this strategy in currency pairs involving the Japanese yen, Australian dollar, and the New Zealand dollar.

Strategy Concept

Gap and Leave is an easy strategy that is based on simple price action and speculation. It is observed that events and occasions that occur during the weekend give rise to unfilled orders in the market, which leads to a gap on Monday. This gap is a result of speculation and sudden infusion of liquidity in the market, as an outcome of the event. Most of these events are not of great importance, which means they do not have long-lasting on the value of a currency.

This characteristic can be used to our advantage by entering at discounted prices. Here it is important to note that the gap should coincide with a technical level of support and resistance. As mentioned earlier, this is a ‘range’ trading strategy. The price must reach the extremes of the ‘range’ as a result of the ‘gap.’ The idea is to go ‘long’ at support and ‘short’ at resistance. But this is done by following all the rules of the strategy.

The strategy offers a high risk-to-reward since we are executing our trades at the lowest prices, keeping a target at the other end of the ‘range.’

Trade Setup

In order to explain the strategy, we shall consider an example where we will execute a ‘long’ trade-in GBP/NZD pair on the 15-minutes time frame. Here are the steps to execute the strategy.

Step 1

Firstly, we should identify a ‘range’ that is newly formed. By this, we mean, the price should have reacted from the top or bottom of the range at least twice and moved to the other end. At the same time, we need to also ensure that the ‘range’ is not very old. We should not be considering ‘ranges’ where the support and resistance levels have been respected more than 5-6 times.

In our example, we have identified a ‘range’ on the 15-minutes time frame where the price has reacted twice from the resistance and four times from the support.

Step 2

The next step is to watch for Friday’s closing price. The candle must close somewhere in the middle of the range. This is because if the market has to gap on Monday, the gap will take the price at one of the extremes of the range. If the candle closes at support or resistance on Friday, the price gap will lead to a breakout or breakdown that will violate the ‘range’ trade. Then we should look for a breakout strategy.

In the case of GBP/NZD, we can see that the price almost closes in the middle of the range.

Step 3

This is the most important step in the strategy. In this step, we watch the market’s behavior on Monday and see if it opens with a gap or not. If the market gaps down to the support of the range, we will look for taking a ‘long’ trade after a suitable confirmation. On the other hand, if the market gaps up to the resistance, we will take a ‘short’ trade provided we have followed all the steps discussed earlier. A bullish candle after ‘gap down’ is the confirmation for a ‘long’ trade, and a bearish candle after ‘gap up’ is the confirmation for a ‘short’ trade.

In the below image, we can see that the price forms a bullish candle after gapping down on Monday. Hence, we enter for a ‘buy’ at this close of the first candle.

Step 4

Lastly, we need to determine the stop-loss and ‘take-profit’ for the strategy. Stop-loss placement is pretty simple, where it is placed below the support when ‘long’ in the market and above the resistance when ‘short.’ We take our profits when the price reaches the other end of the range. This means at resistance when ‘long’ and at the support when ‘short.’ The risk-to-reward of trades using this strategy is above average, which is quite attractive.

Strategy Roundup

Gaps are one of the most common tools used by institutional traders due to the high probability of winning trades. This strategy is based on market movement that is only a consequence of speculation, which does not hold any value. If we are looking for a gap trading strategy in forex, the Gap and Leave strategy is a good one to start with because it is great for beginners who want a relatively easy entry, at a slow pace and not involving complex indicators.

Categories
Forex Basic Strategies

Learning To Trade The Forex Market Using ‘Pure Die-Out’ Strategy

Introduction

Everyone wants to be the hero in the market and claim that they have picked the top or bottom of a currency pair. However, apart from boasting, there is no gain from repetitive selling at every new ‘high’ in hopes that this one would be the final ‘high.’ One of the biggest dangers encountered by novice traders is picking a top or bottom with no logic. The pure die-out is an intraday strategy that picks a top or bottom based upon a strong recovery after an extended move.

Time Frame

As it is an intraday strategy, the highly suitable time frames are 1 hour and 15 minutes.

Indicators

In this strategy, we will be using two indicators. The two indicators are RSI and Bollinger Bands.

Currency Pairs

This strategy works best on major currency pairs only. Among these, the preferred ones are EUR/USD, USD/JPY, GBP/USD, GBP/JPY, and USD/CAD.

Strategy Concept

The strategy looks for intraday fake-outs using three sets of Bollinger bands and the relative strength index (RSI) on the hourly and 15-minute charts. The trade setup is formed when RSI hits either an overbought or oversold level. The market is considered to be overbought when RSI moves above 70, while the market is considered oversold when RSI goes below 30.

This signals a possible reversal in the market and that we can start looking for a trade in the opposite direction. However, rather than just immediately buying or selling in hopes for a trend reversal based solely upon RSI, we add in three sets of Bollinger Bands, to help us identify the point of over-extension. We use three sets of Bollinger Bands because it helps us assess the extremity of the move along with the extent of possible U-turn.

The conventional theory of Bollinger bands suggests buying or selling when prices hit the two bands. In our strategy, we will totally be using three Bollinger bands, and when prices hit the third band on any side, we say that the move is within the 5% small group, which characterizes the move as extreme.

When prices move away from the third standard deviation Bollinger band and move into the zone of first and second Bollinger band, we are confident that the currency pair has hit its extreme point and is moving into a reversal phase.

Finally, we look for one last thing before making an entry: a candle to close fully between the second and first Bollinger Bands. This last step helps us screen out false moves and assures that the previous move was really exhaustion. This is a low-risk and low-return strategy that is suitable for traders who like to scalp the market.

Trade Setup  

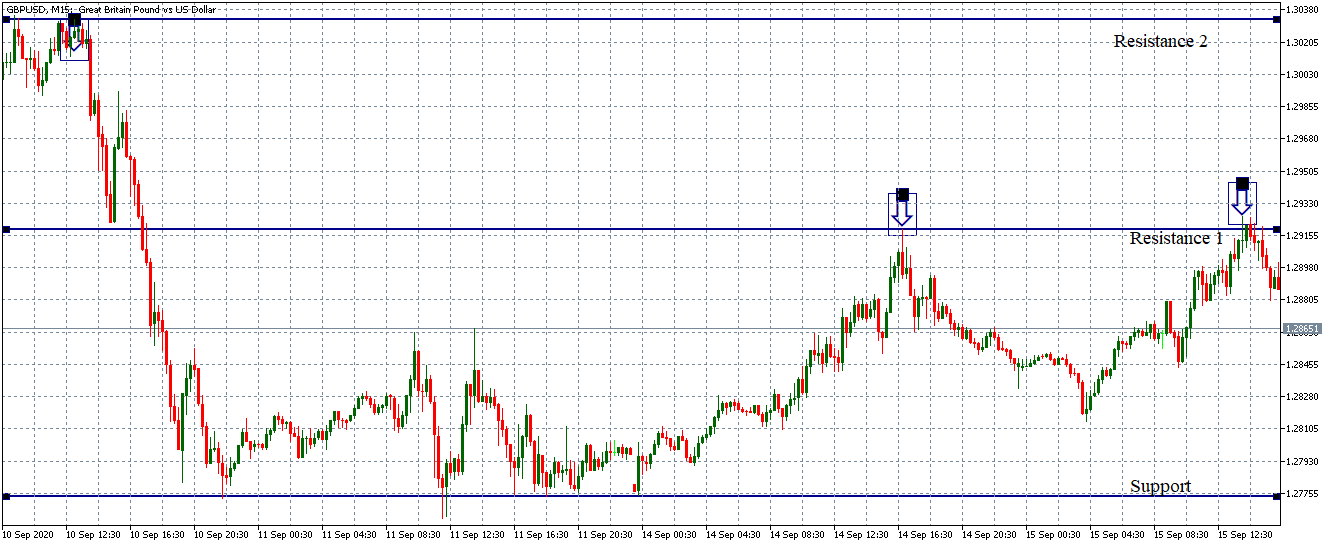
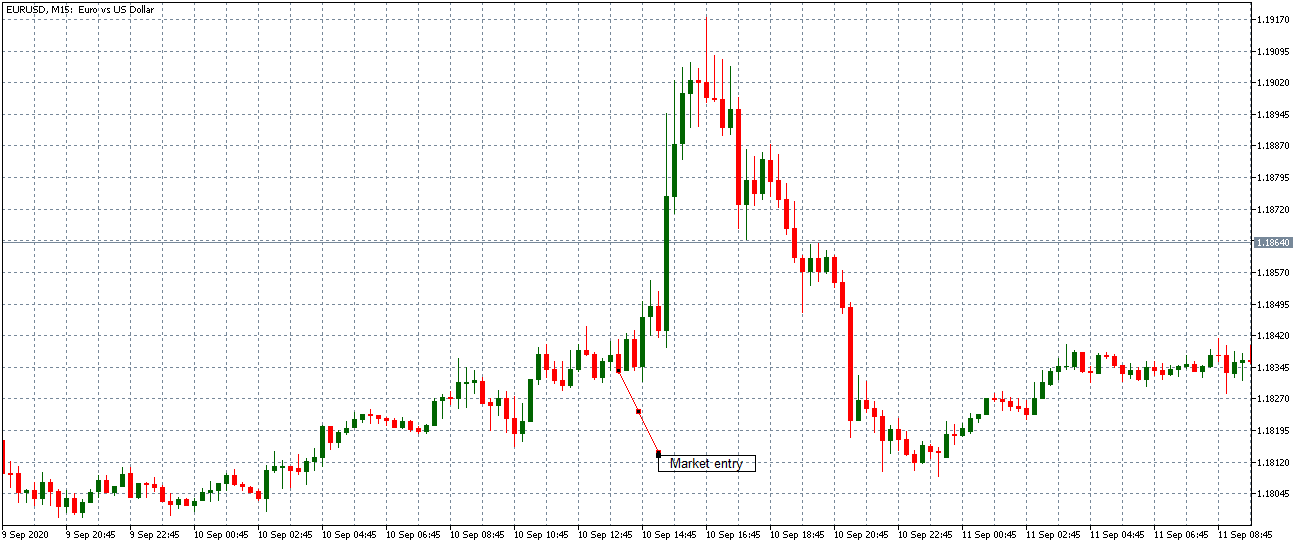
To illustrate the strategy, we have considered the USD/JPY currency pair, where we will be applying the 1-hour chart strategy. Here are the steps to execute the strategy.

Step 1

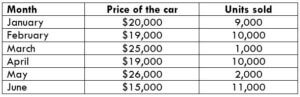
Firstly, open the 1 hour or 15 minutes chart of the desired currency pair. Then plot the Bollinger band and RSI indicator on the chart. We need to plot 3 Bollinger bands with the same ‘period’ but different standard deviations. The first Bollinger band (BB) should have a standard deviation (SD) of 1, the second BB will have SD of 2, and finally, the third BB will have SD of 3. RSI will carry the default settings.

The below image shows the Bollinger band indicator plotted on the USD/JPY currency pair and the RSI on it.

Step 2

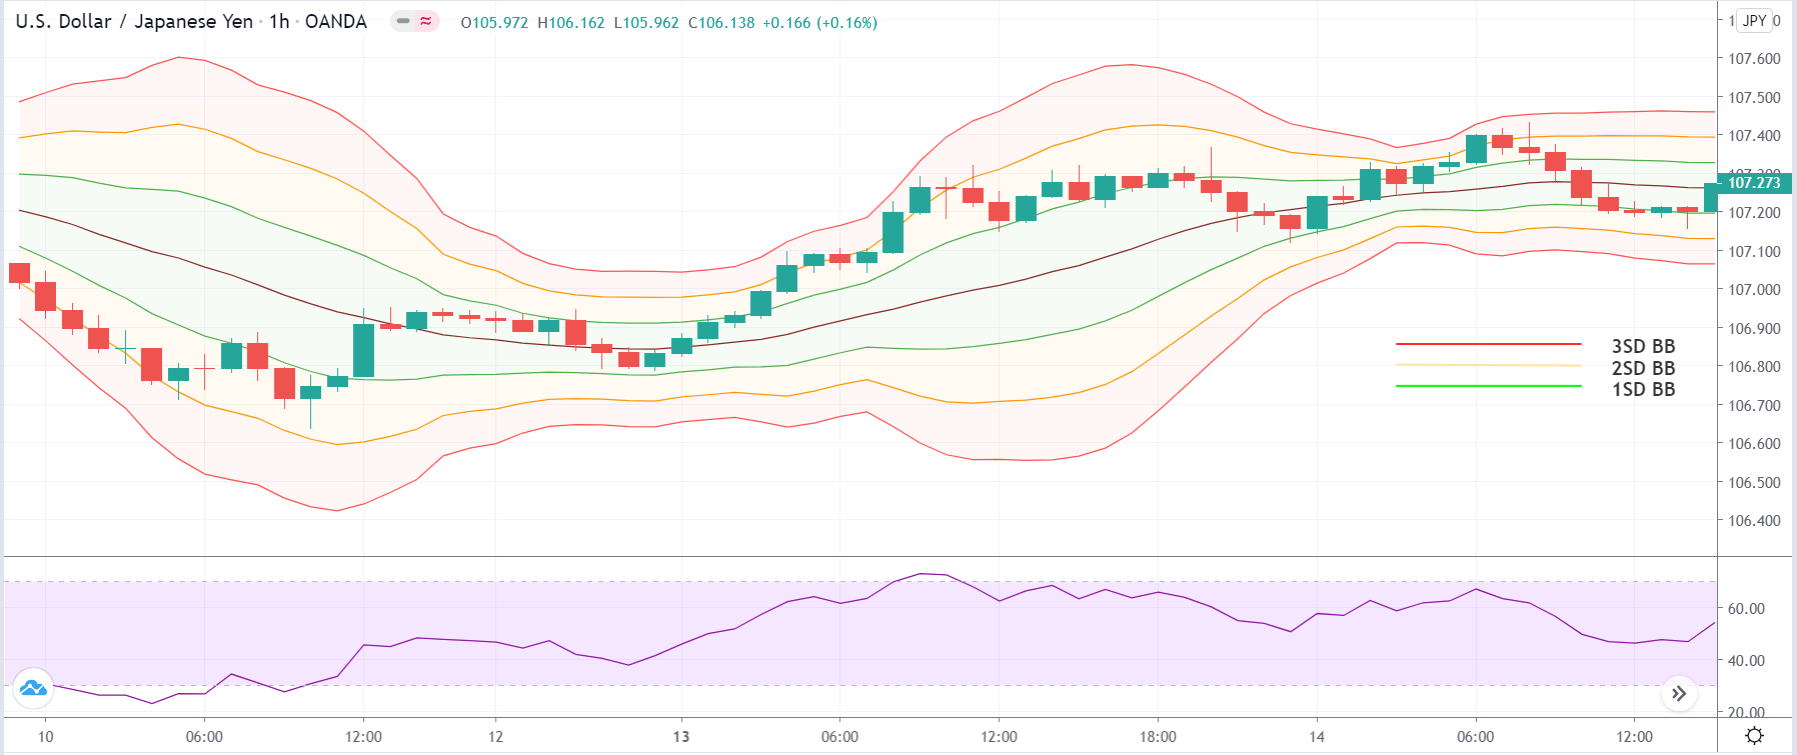
If we are looking for an overextended move on the downside, wait for the price to cross below the lower band of the 3SD BB or if we are looking for an overextended move on the upside, wait for the price cross above the upper band of the 3SD BB. Along with this, we need to see that the RSI goes below the 30 ‘mark’ in a down move and moves above the 70 mark in an up move. Both conditions need to be satisfied simultaneously.

In the example since we are looking for a ‘buy’ trade, we have to wait for the price to cross below the lower band of the 3SD BB along with the RSI reading of below 30. The below image shows that the conditions mentioned above are fulfilled.

Step 3

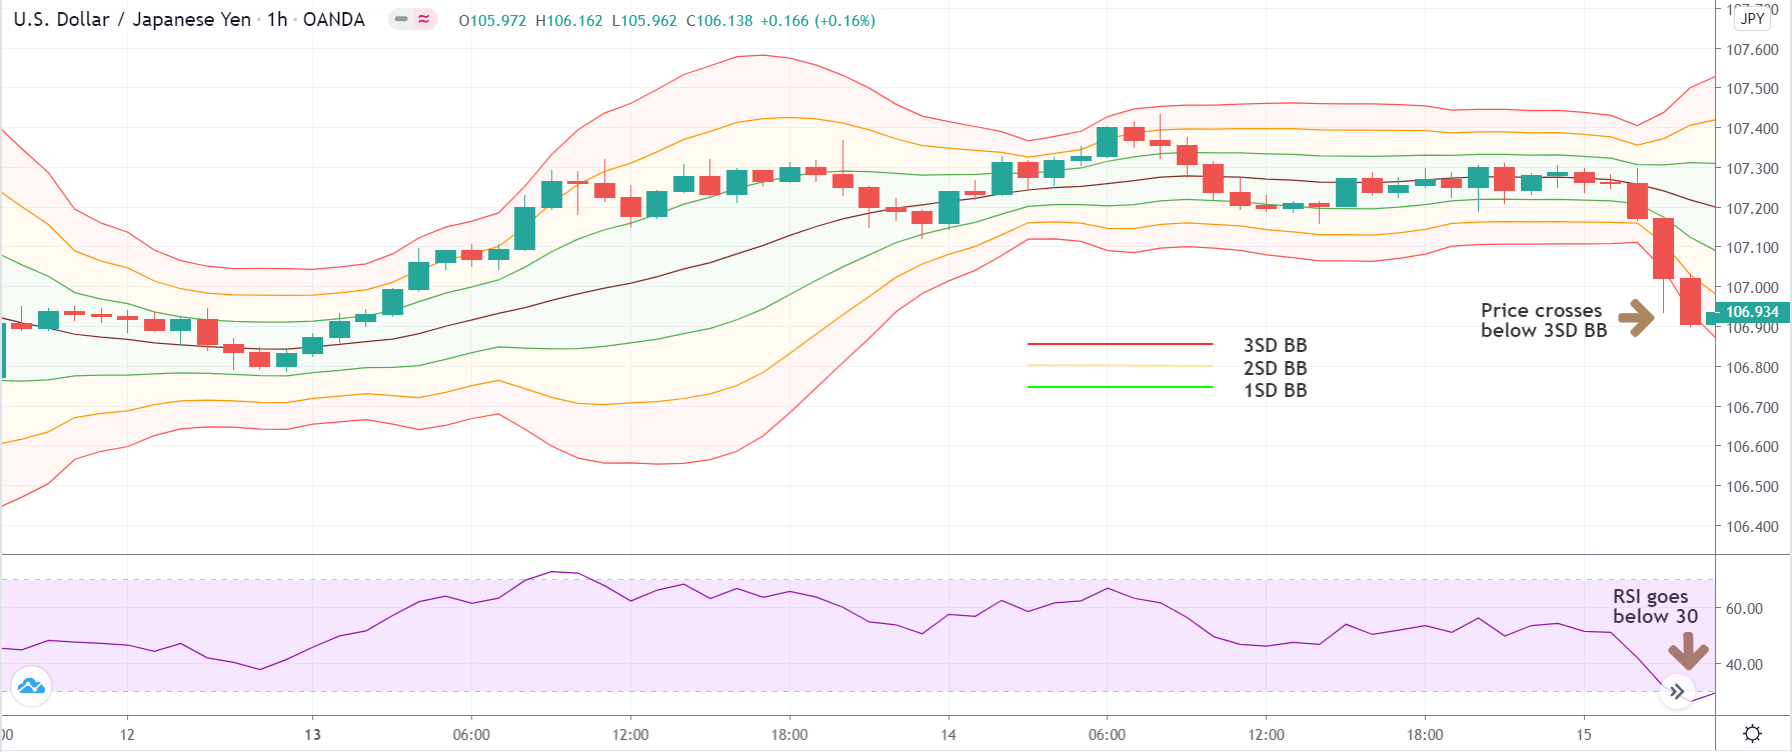
In this step, we wait for a candle to open and close between the 2SD BB and 1SD BB zone. It is important to check that the entire body of the candle is within this zone, and it closes near the lower band of the 1SD BB. This was for a ‘long’ setup. In the case of a ‘short’ trade, the only difference is that the candle should close between the upper band of the 2SD BB and 1SD BB.

In the below image, we can notice a bullish candle that closes well within the required zone, which is a sign of reversal.

Step 4

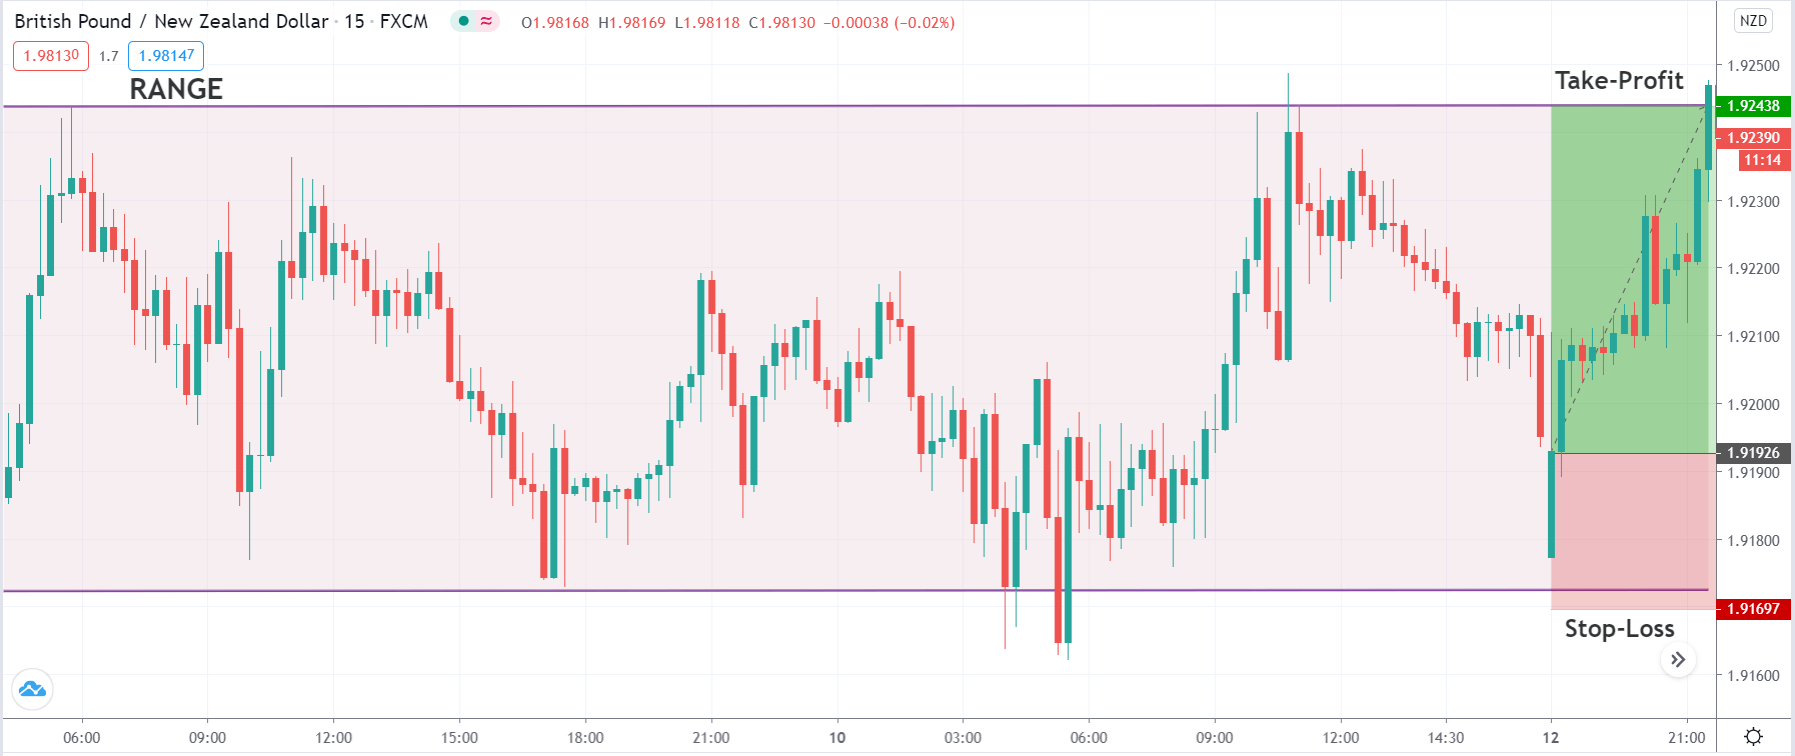
In this step, we determine the ‘stop-loss’ and ‘take-profit‘ for the strategy. Stop-loss is placed below or above the ‘low’ or ‘high,’ respectively, from where the reversal began. As we are trading against the trend, the ‘take-profit’ is set at 1:1 risk to reward. We will also lock-in some profits when the market starts moving in our favour, to ensure that we don’t lose money if it turns midway.

Strategy Roundup

In this strategy, we combine two technical indicators to identify the market’s top and bottom, without making wild guesses. This means we are determining overextended moves logically and technically. After practising well on the 1-hour chart, we can spot trade setups on the 15 minutes time frame. Since these are counter-trend trades, the probability of success will be less. This strategy is very simple to understand if we have basic knowledge of indicators.

Categories
Forex Course

45. Analyzing the Forex Market – Technical Analysis

A way to analyze the markets other than fundamental analysis is technical analysis. In this lesson, we shall exactly understand what technical analysis is, and also the different techniques to analyze the market using technical analysis.

What Is Technical Analysis?

In simple terms, technical analysis can be defined as the study of price movements.

Unlike fundamental analysis, where people study the factors which affect the supply and demand of the market, technical analysis involves the study of the historical price movements and the present market condition.

Why should Technical Analysis be used?

Let us answer this question by bringing up an analogy.

The first thing one must understand about the market is that the forex market business is no different from a real-life business.

For instance, let’s say there’s a car dealer and they have been selling one particular car for six months by varying the prices every month. And an illustration of the sales report is given below.

Now, from the above table, can you predict what could be priced in the near future? If yes, then you can consider yourself as a technical analyst, as this is what technical analysts do.

Consider the above table. We can see that initially, the car was priced at $20,000, and 9,000 units of the car were sold. Next month, the owner price reduced by $1,000, and the sales increased by 1,000 units. Seeing this demand in the car, the owner increases the price to $25,000. But, this time the sales drop down to 1,000 units. So, the car owner reduces the price back to $19,000. And he observes that the sales increase from 1,000 to 10,000. Later, he again raises the price to $26,000.

Now, by analyzing the past price movements, we can predict with a high probability that the price will reduce yet again, as the previous time the price came to $25,000, the price dropped drastically. Thus, looking at the price of the car in June, we can see that the price did fall to $15,000.

Therefore, the above example, in a nutshell, is referred to as Technical Analysis.

Switching back to the Forex market, the analysis is done similarly. The only difference being the Forex market involves the trading of currency pairs, and the real market consists of the buying and selling of products.

Hence, from this, we can conclude that a market moves as per the historical price movements. The above example is just to give you a gist of how technical analysis work. There are many more complex ways to accurately predict the market using technical analysis. Price Action traders do their technical analysis using different types of charts (like candlesticks, bars, lines, area, etc.), timeframes, and indicators.

Hence, this brings us to the end of this lesson. In the lessons coming forward, we shall be discussing tons of stuff related to technical analysis. So, stay tuned.

[wp_quiz id=”56618″]