Categories
Forex Basic Strategies

The Best Tools to Trade Pullbacks Effectively

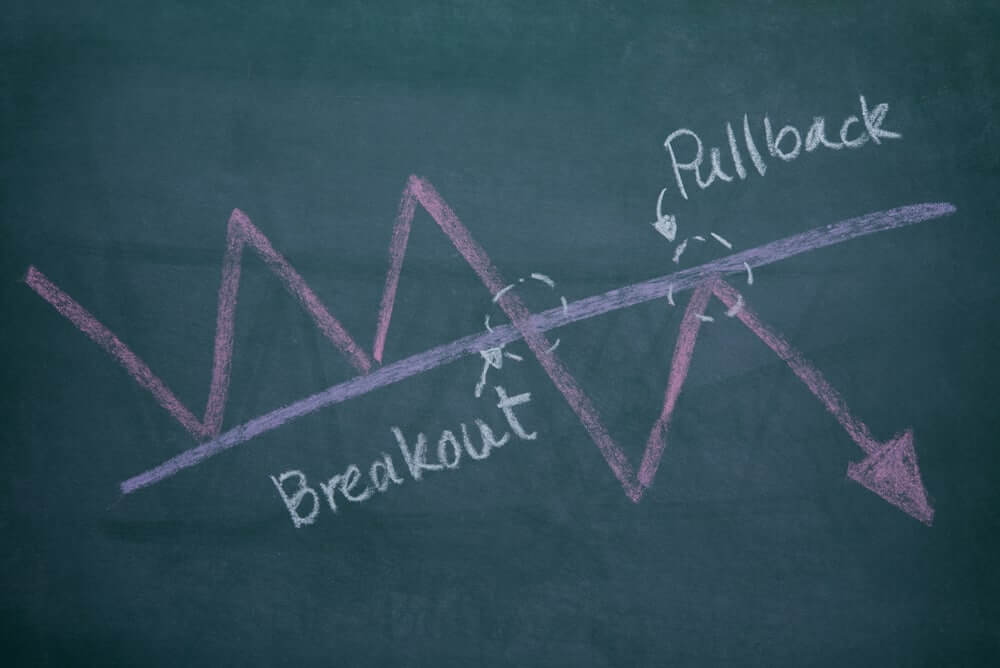
A Pullback is a pause, retracement, or consolidation of a price from the most recent peak during an ongoing trend. The pullback is widely seen as a trading opportunity after the underlying asset experienced a large upside or downside move. For example – Any forex pair is in a strong uptrend, and some healthy news came, and price action dropped back to the most recent support area that indicates the professional traders are booking the profits.

Pullbacks happen all the time, and if you learn how to trade them successfully, it can be a great skill as a trader. Trading the pullback is the easiest way to trade the market, sometimes you will recognize the high probability pullback trades and sometimes extreme volatile pullbacks, and you can enhance your repertoire and find many higher probability trades. If you are new in the market, then pullback trading is a fantastic and easy way to find superior risk-to-reward ratio trades. In this article, we will explore five trading strategies that provide excellent pullback trades.

Pullback Trading Strategies

Two-Legged Pullback To The MA 

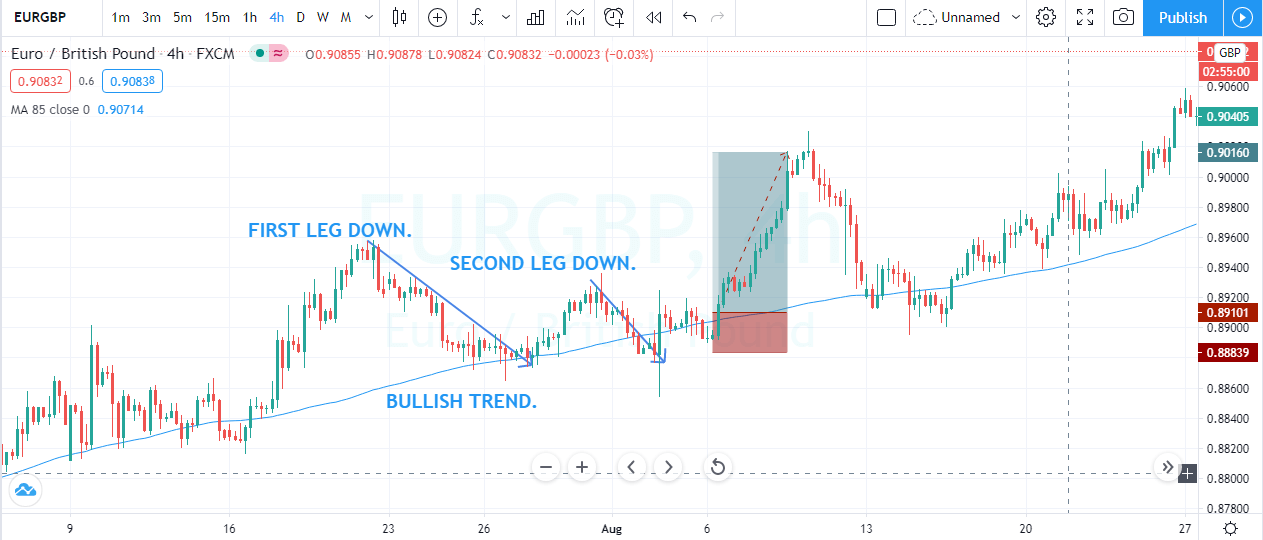
Al Brooks popularized the concept of two legs pullback in his price action books. He explained most of the time, price action print two legs to reach the moving average. We backtested his strategy and found out that his techniques work very well in the trending market, but sometimes in the strong trending market, you will only witness one leg.

This is because most market operators are in a hurry to move the market; this may be because of any fundamental news. To filter out all the low probability trades, it is advisable to find a trending market and then wait for the price action to print the two legs towards the moving average, and when all the moves complete, take the buy entry.

The image below represents the buying trade in the EURGBP forex pair. The moving average indicates the buying trend in the currency. Price action pulled back to the moving average, prices responded from the moving average and goes a bit higher and end up printing the second leg. The second leg goes down to the moving average, but the strong buyers smack back up and close above the moving average. Furthermore, the price slows down a bit, and we took buying entry with the stops below the entry, and for taking profit, we choose the brand new higher high.

Candlestick Pattern + MA

This method will use the bullish engulfing candlestick pattern with a moving average to successfully trade the market.

Here we need two ingredients.

  1. Price action pullback to the moving average.
  2. The market forms a bullish engulfing pattern.

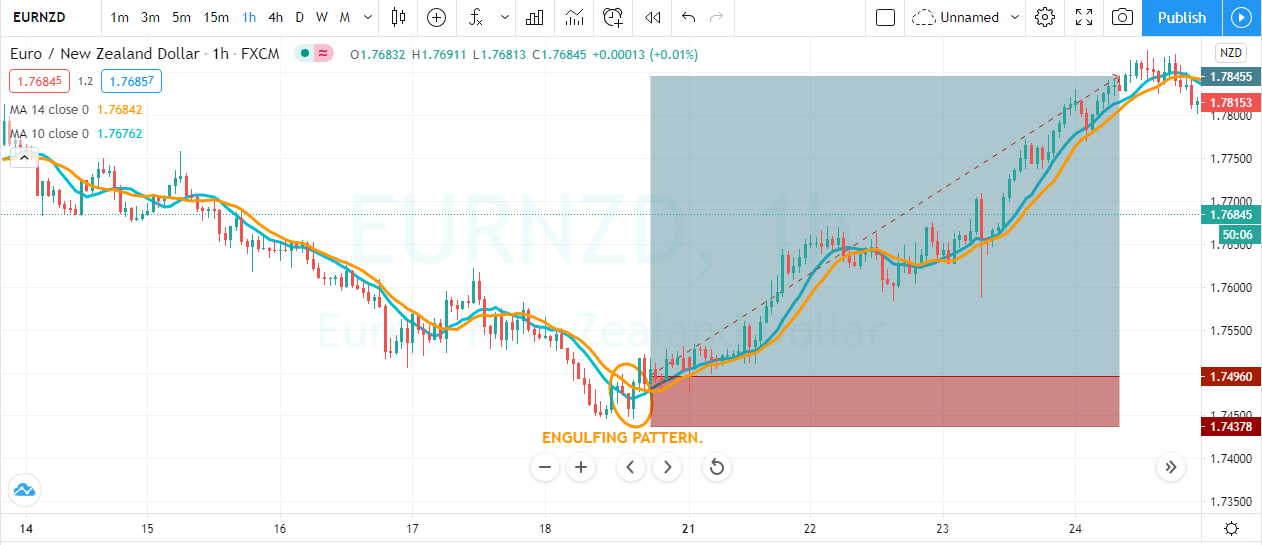
First of all, look for the strong trending market and wait for price action to approach the moving average. At this stage, if the price action prints the engulfing pattern,  it’s the right time for you to go for a buy entry. Otherwise, no entries are allowed for you. An  Engulfing Pattern indicates the sellers try to print the brand new lower low, but because of dynamic support of moving average prices pulled back and buyers end up eating all the sellers. As a result, we witnessed the Bullish Engulfing pattern.

The image below represents the buying trade in the EURNZD forex pair. As you can see, at the end of the downtrend, price action goes above the moving average, and we witnessed the engulfing pattern. The trading pattern closed above the moving average, which was a confirmation of buyers came back to the show and were expecting the brand new higher high.

Trendlines + Channel Trading

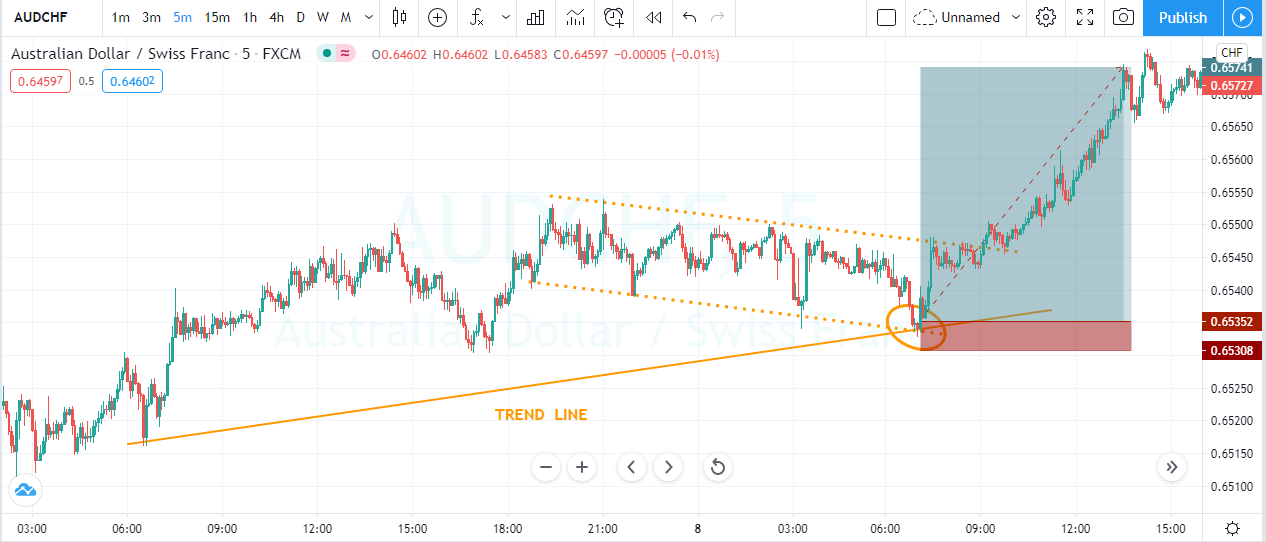
This one is the simple trading approach, which is not much popular, but it often generates wonderful trading results. First of all, you must draw the trend line to the ongoing trend, and when the price action pulls back enough, then draw the price channel to identify the oversold and overbought area. When price action approaches the trend line as well as the lower line of the price channel, it is an indication to go long.

The image below represents the buying entry in the AUDCHF forex pair. The trend line was the indication that the buyers are leading the show. During the pullback phase, when enough sellers approach the trend line and the lower channel line, it gave the strong buying candle. The reason we got the strong candle is because for the support and resistance trader, the zone was a dynamic support area to go long.

RSI + Stochastic Indicator

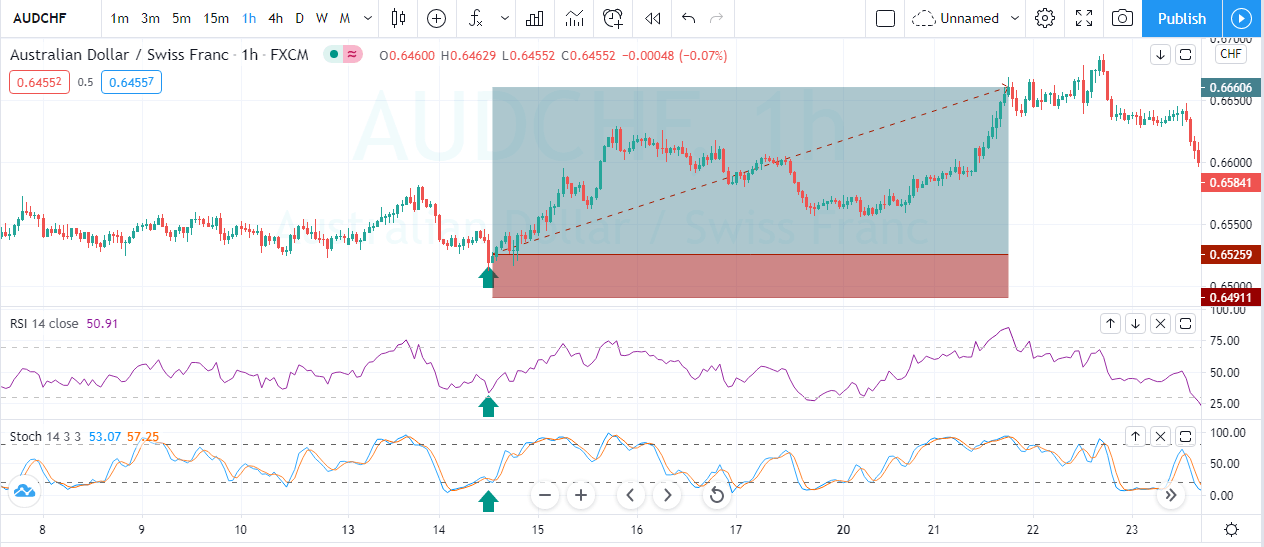
In this approach, we are using the two oscillators to trade the pullbacks. Stochastic and RSI both are oscillators, and they both oscillate between the significant levels. In an uptrend, wait for the price action to pull back. When the stochastic and RSI gave the oversold signal, it is a perfect time to go for a brand new higher high.

The image below indicates the buying trade in the AUDCHF forex pair. The pair was overall in an uptrend, and during the pullback, both of the indicators were showing the oversold signals, and the reversal at the oversold area was a great sign to go long. When both oscillators indicate the same sign, there is no point in going for more significant stops. When both oscillators gave the reversal signal at the significant resistance level, that’s a perfect time to close your trade.

Conclusion

All the pullback strategies share the same goal, which is to time the market. The better you master the skill of timing before the take-off, the more profits you will make. If you are a newbie trader, then master these strategies first on the demo and then apply to the live market because trying any of these strategies in the live market is dangerous without having any experience.

So never try anything on the live account. Instead, practice them on demo first and then make a profit on a live account. When you master these strategies, then you can very easily design a pullback strategy for yourself. Whichever strategy fits nicely into your trading approach, master it.

Categories
Forex Basic Strategies

How to Profit Using The ‘Gap and Leave’ Forex Trading Strategy

Introduction

Gap and Leave is an interesting trading strategy that utilizes one of the most distressing phenomena of the forex market, a weekly gap between the last Friday’s close and the current Monday’s open price. The gap takes its origin in the fact that the interbank currency market continues to react on the fundamental news during the weekend, which results in a kind of opening on Monday at the highest level of liquidity. Today’s strategy is based on the assumption that the gap is a result of speculations and excess liquidity. Therefore, a position in the opposite direction should become profitable after a few hours.

In the past few articles, we discussed strategies that were pertaining to ‘trend pullback.’ Now, we will shift our focus and talk about a strategy that is best suited for trading a ‘range.’

Time Frame

This strategy works well on the 15-minutes and 1-hour time frame. Traders looking to trade intraday should use the strategy on the 15-minutes time frame. While traders looking for swing trading opportunities should look at 1-hour charts.

Indicators

No indicators are being used in this strategy. It mostly relies on price action and market speculation.

Currency Pairs

This strategy is suitable for trading in currency pairs, which are volatile and liquid. Also, since the Asian market is the first one to open for trading after the weekend, we would suggest applying this strategy in currency pairs involving the Japanese yen, Australian dollar, and the New Zealand dollar.

Strategy Concept

Gap and Leave is an easy strategy that is based on simple price action and speculation. It is observed that events and occasions that occur during the weekend give rise to unfilled orders in the market, which leads to a gap on Monday. This gap is a result of speculation and sudden infusion of liquidity in the market, as an outcome of the event. Most of these events are not of great importance, which means they do not have long-lasting on the value of a currency.

This characteristic can be used to our advantage by entering at discounted prices. Here it is important to note that the gap should coincide with a technical level of support and resistance. As mentioned earlier, this is a ‘range’ trading strategy. The price must reach the extremes of the ‘range’ as a result of the ‘gap.’ The idea is to go ‘long’ at support and ‘short’ at resistance. But this is done by following all the rules of the strategy.

The strategy offers a high risk-to-reward since we are executing our trades at the lowest prices, keeping a target at the other end of the ‘range.’

Trade Setup

In order to explain the strategy, we shall consider an example where we will execute a ‘long’ trade-in GBP/NZD pair on the 15-minutes time frame. Here are the steps to execute the strategy.

Step 1

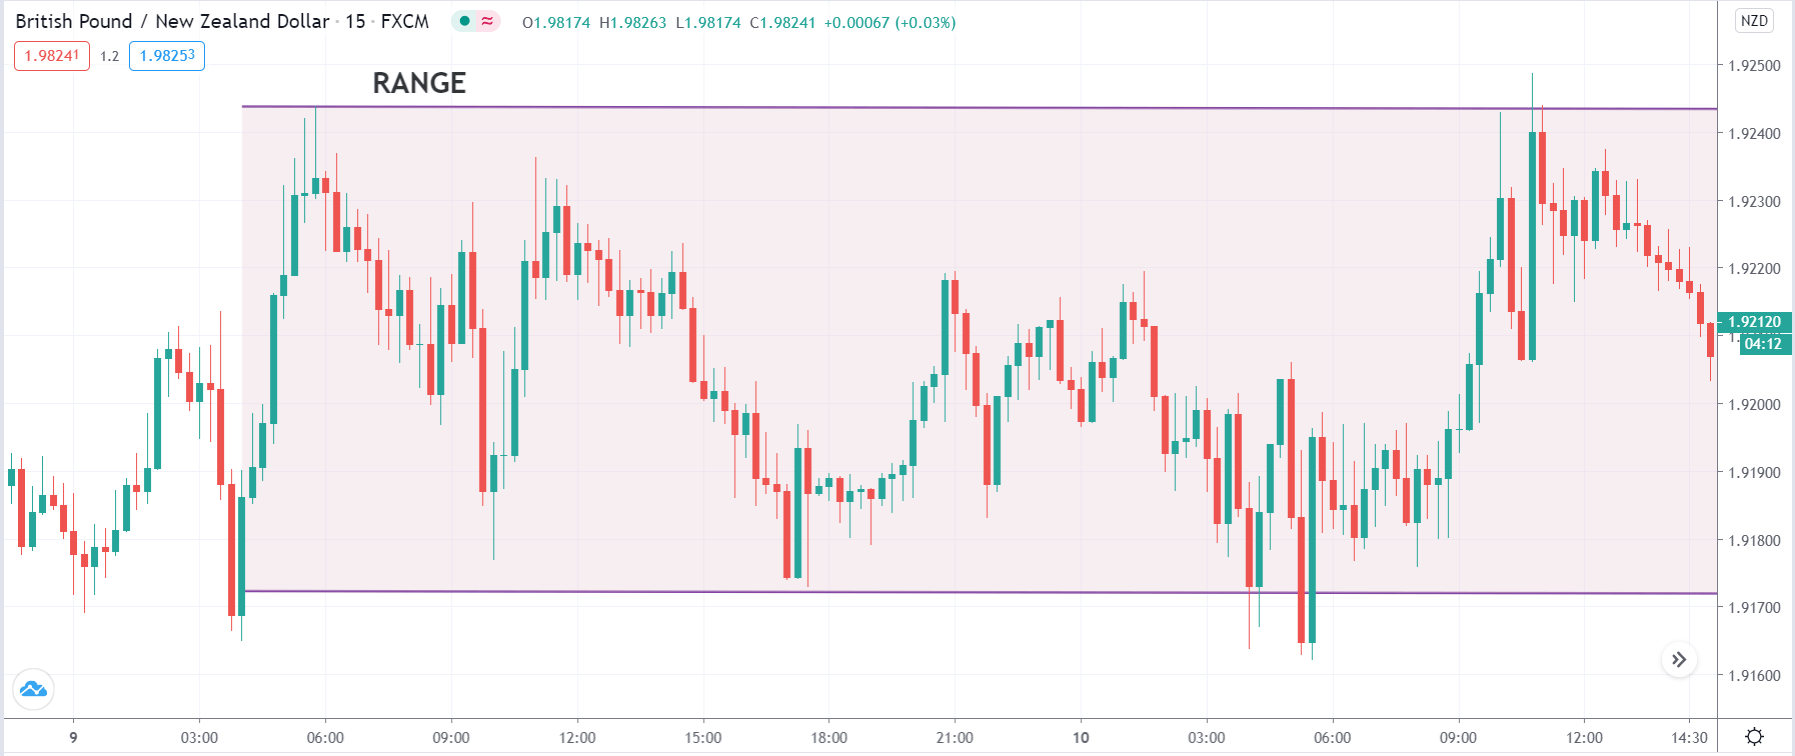
Firstly, we should identify a ‘range’ that is newly formed. By this, we mean, the price should have reacted from the top or bottom of the range at least twice and moved to the other end. At the same time, we need to also ensure that the ‘range’ is not very old. We should not be considering ‘ranges’ where the support and resistance levels have been respected more than 5-6 times.

In our example, we have identified a ‘range’ on the 15-minutes time frame where the price has reacted twice from the resistance and four times from the support.

Step 2

The next step is to watch for Friday’s closing price. The candle must close somewhere in the middle of the range. This is because if the market has to gap on Monday, the gap will take the price at one of the extremes of the range. If the candle closes at support or resistance on Friday, the price gap will lead to a breakout or breakdown that will violate the ‘range’ trade. Then we should look for a breakout strategy.

In the case of GBP/NZD, we can see that the price almost closes in the middle of the range.

Step 3

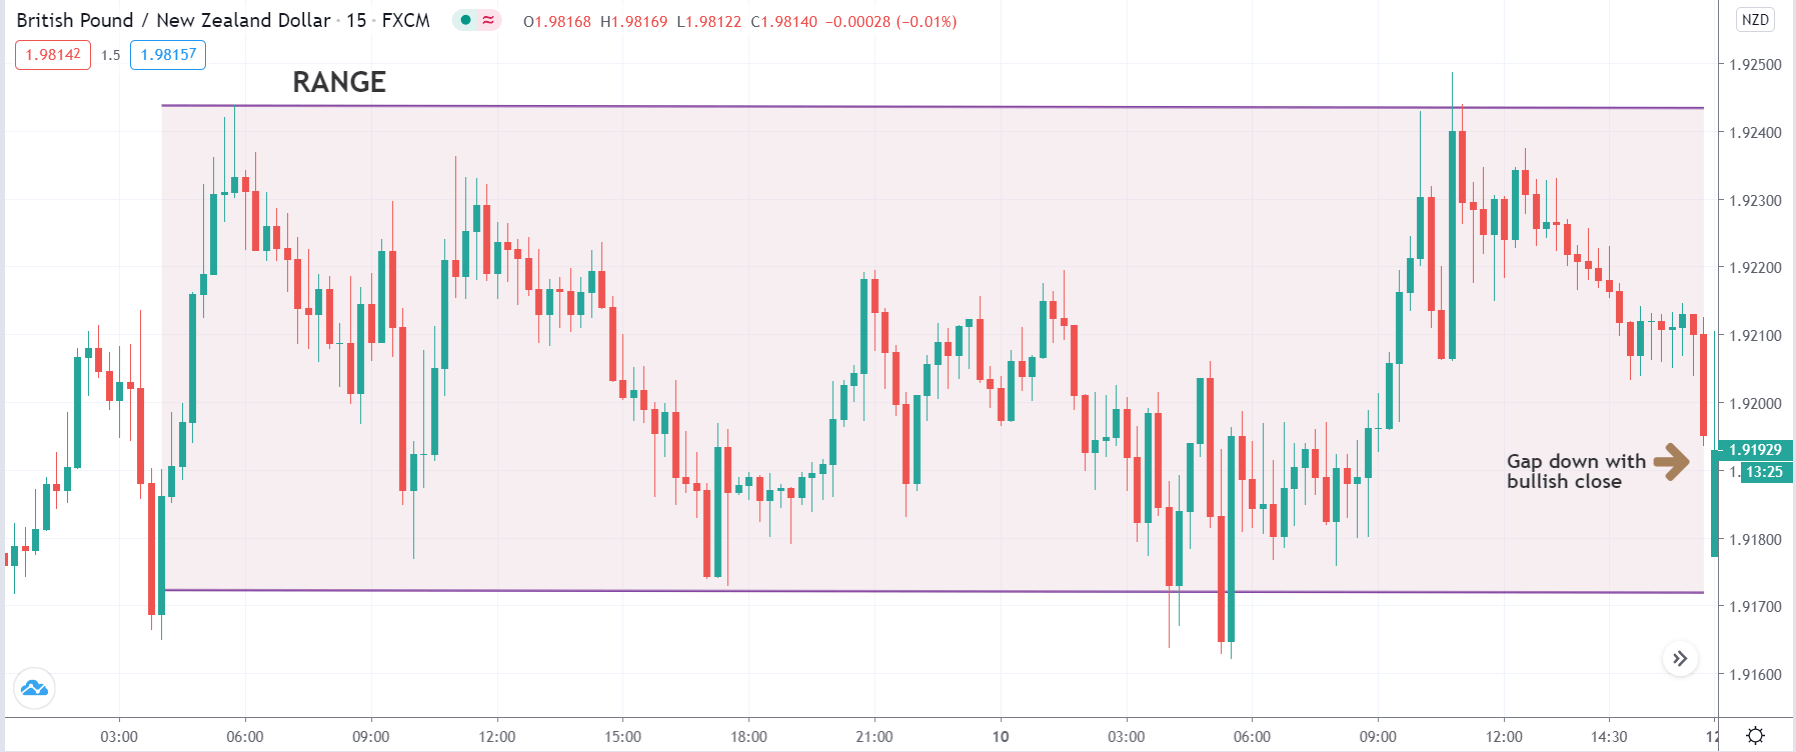
This is the most important step in the strategy. In this step, we watch the market’s behavior on Monday and see if it opens with a gap or not. If the market gaps down to the support of the range, we will look for taking a ‘long’ trade after a suitable confirmation. On the other hand, if the market gaps up to the resistance, we will take a ‘short’ trade provided we have followed all the steps discussed earlier. A bullish candle after ‘gap down’ is the confirmation for a ‘long’ trade, and a bearish candle after ‘gap up’ is the confirmation for a ‘short’ trade.

In the below image, we can see that the price forms a bullish candle after gapping down on Monday. Hence, we enter for a ‘buy’ at this close of the first candle.

Step 4

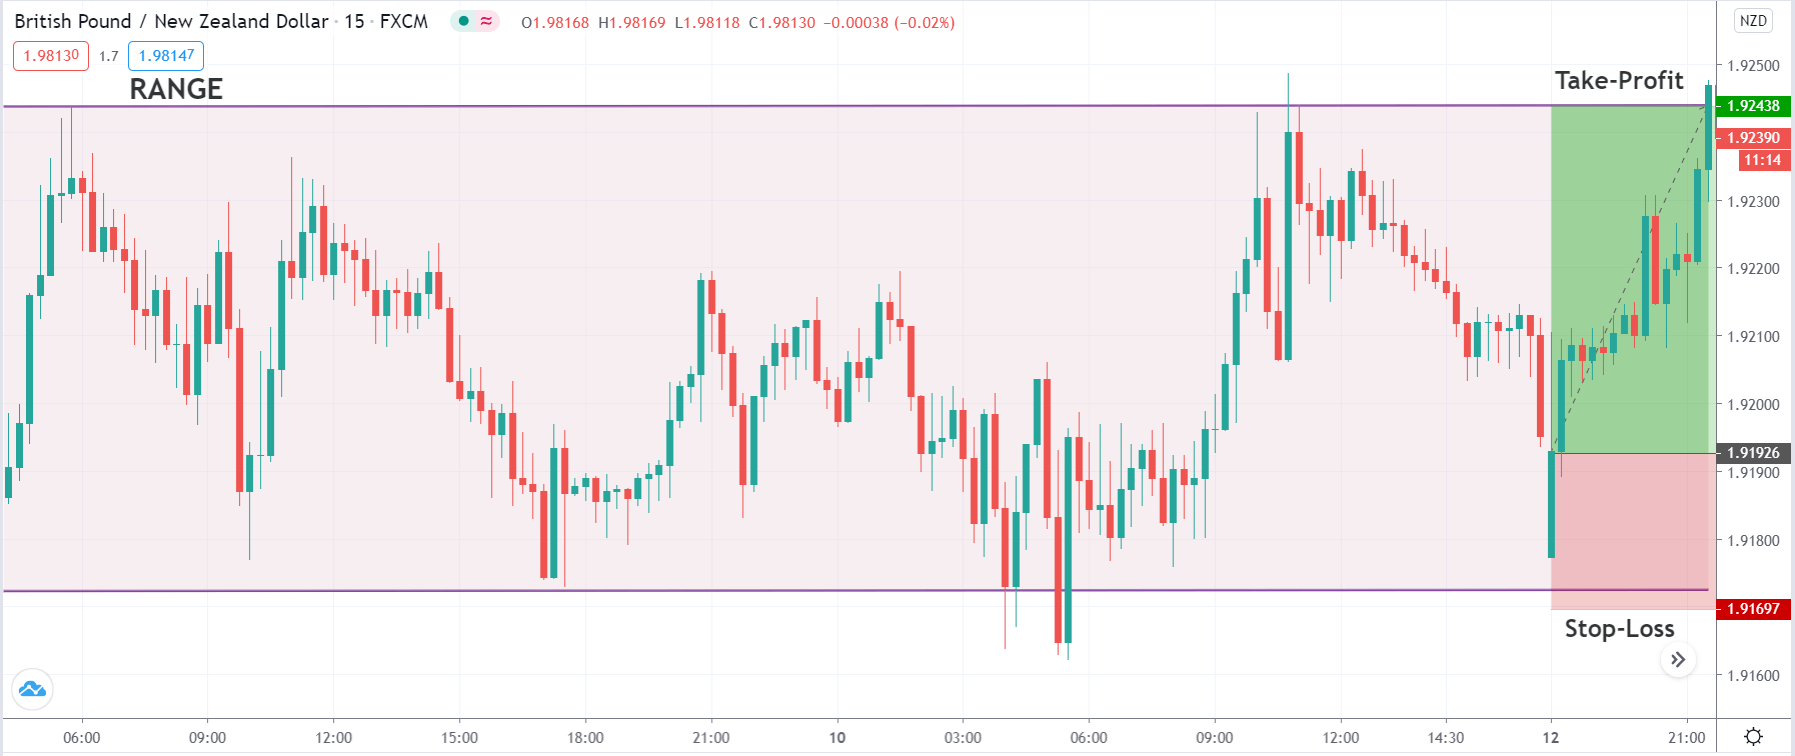
Lastly, we need to determine the stop-loss and ‘take-profit’ for the strategy. Stop-loss placement is pretty simple, where it is placed below the support when ‘long’ in the market and above the resistance when ‘short.’ We take our profits when the price reaches the other end of the range. This means at resistance when ‘long’ and at the support when ‘short.’ The risk-to-reward of trades using this strategy is above average, which is quite attractive.

Strategy Roundup

Gaps are one of the most common tools used by institutional traders due to the high probability of winning trades. This strategy is based on market movement that is only a consequence of speculation, which does not hold any value. If we are looking for a gap trading strategy in forex, the Gap and Leave strategy is a good one to start with because it is great for beginners who want a relatively easy entry, at a slow pace and not involving complex indicators.

Categories
Forex Basic Strategies

Exploring The Forex Market Opportunities With The Help of ‘Volume’

Introduction

In the Forex market, we don’t really have a centralised exchange as we’re trading over the counter. This is the reason why it is so difficult to determine exact trading volumes in Forex. Even though there is no centralised exchange to provide us with the volume data, many forex broker’s and trading platforms keep track of the average volumes in a pair. Each retail broker will have their own aggregate trading volume. Platforms like TradingView also have a volume attached to their chart. We all have realised over time that volume in the forex market is an important indicator, which is the reason why we need the best volume indicator.

The volume indicator used to read the volume in the forex market is the Chaikin Money Flow indicator (CMF.) The CMF was developed by Marc Chaikin, who is a trader himself, and was coached by the most successful institutional investors around the world. The reason Chaikin Money Flow (CMF) the best volume indicator is that is measures institutional accumulation and distribution.

Normally, on a rally, the Chaikin volume indicator should be below zero. Conversely, on sell-offs, the indicator should be below the ‘zero’ line.

Time Frame

The strategy works well on the 1-hour and 4-hour time frame only. Therefore, we can say that it is a swing trading strategy and is not suitable for trading intraday.

Indicators

We will be using just one indicator in this strategy, and that is the Chaikin Money Flow indicator (CMF.) The rest all is based on price action.

Currency Pairs

The strategy is suitable for trading in almost all currency pairs that are listed on the broker’s platform. But we need to make sure that the forex pair has enough trading volume.

Strategy Concept

Volume trading requires us to pay careful attention to the forces of demand and supply. Volume traders look for instances of increased buying or selling orders. They also pay attention to the current price movement and trend of the market. Generally, increased trading volume leans towards heavy buy orders. These positive volume trends will prompt us to open new positions on the ‘long’ side of the market, depending on the price action.

On the other hand, if trading volumes and cash flow decrease—it indicates a “bearish divergence. This may be appropriate to sell. We will pay attention to the relative volume—regardless of the number of transactions occurring in a trading period. By learning how to use the Chaikin money flow and other relevant indicators, we will be able to identify whether to ‘buy’ or ‘sell.’

With practice, the volume trading strategy can yield a win rate of 75%!

Trade Setup

In order to explain the strategy, we have considered the chart of EUR/USD, where we will be illustrating a ‘long’ trade using the rules of the strategy.

Step 1

Firstly, look for a price reversal in the market or a price action that reverses an established downtrend or uptrend. This is an easy and simple step that requires us to have a basic understanding of price reversal. This reversal should be accompanied by the rising Chaikin volume indicator that shoots up in a straight line from below zero to above the ‘zero’ line, during the reversal of a downtrend. In an uptrend, the slope should be downwards, i.e., from positive to negative.

When the volume indicator goes negative to positive in a strong fashion, it shows an accumulation of smart money.

Step 2

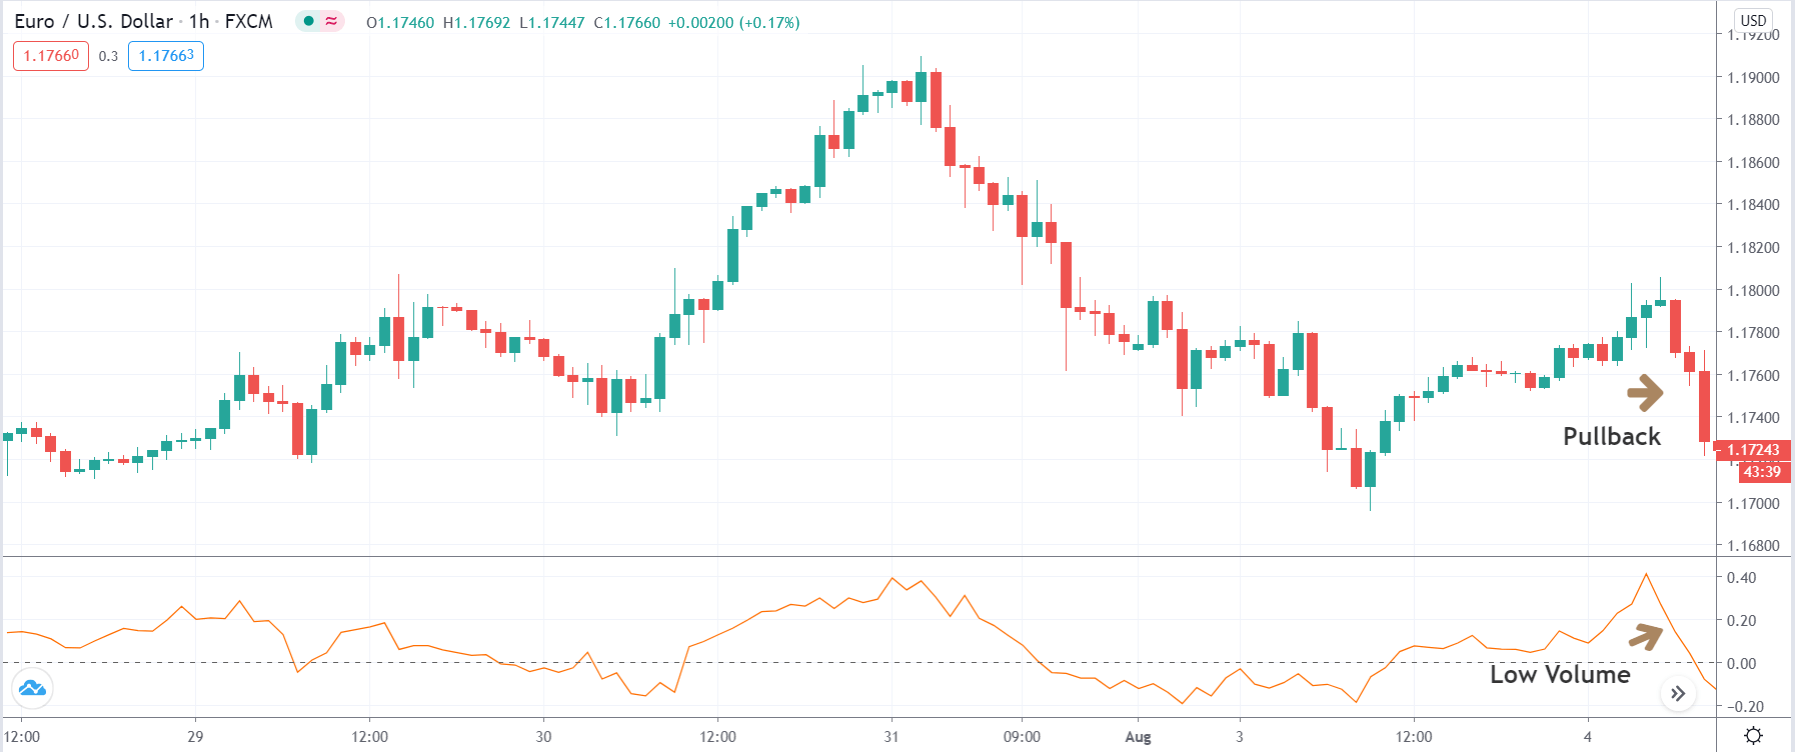
Wait for the price to pullback near the previous lower low after an upward reversal. Likewise, wait for the price to pullback near the previous higher high. The Volume Indicator should also pullback in a similar manner. If the pullback is coming in slowly, the trade has a higher probability of performing. If the pullback is strong, we will exercise some caution.

When the volume indicator is decreasing and drops below zero, we have to make sure that the price remains above the swing low. If the market is satisfying all the conditions of the strategy until now, we can move on to the next step.

Step 3

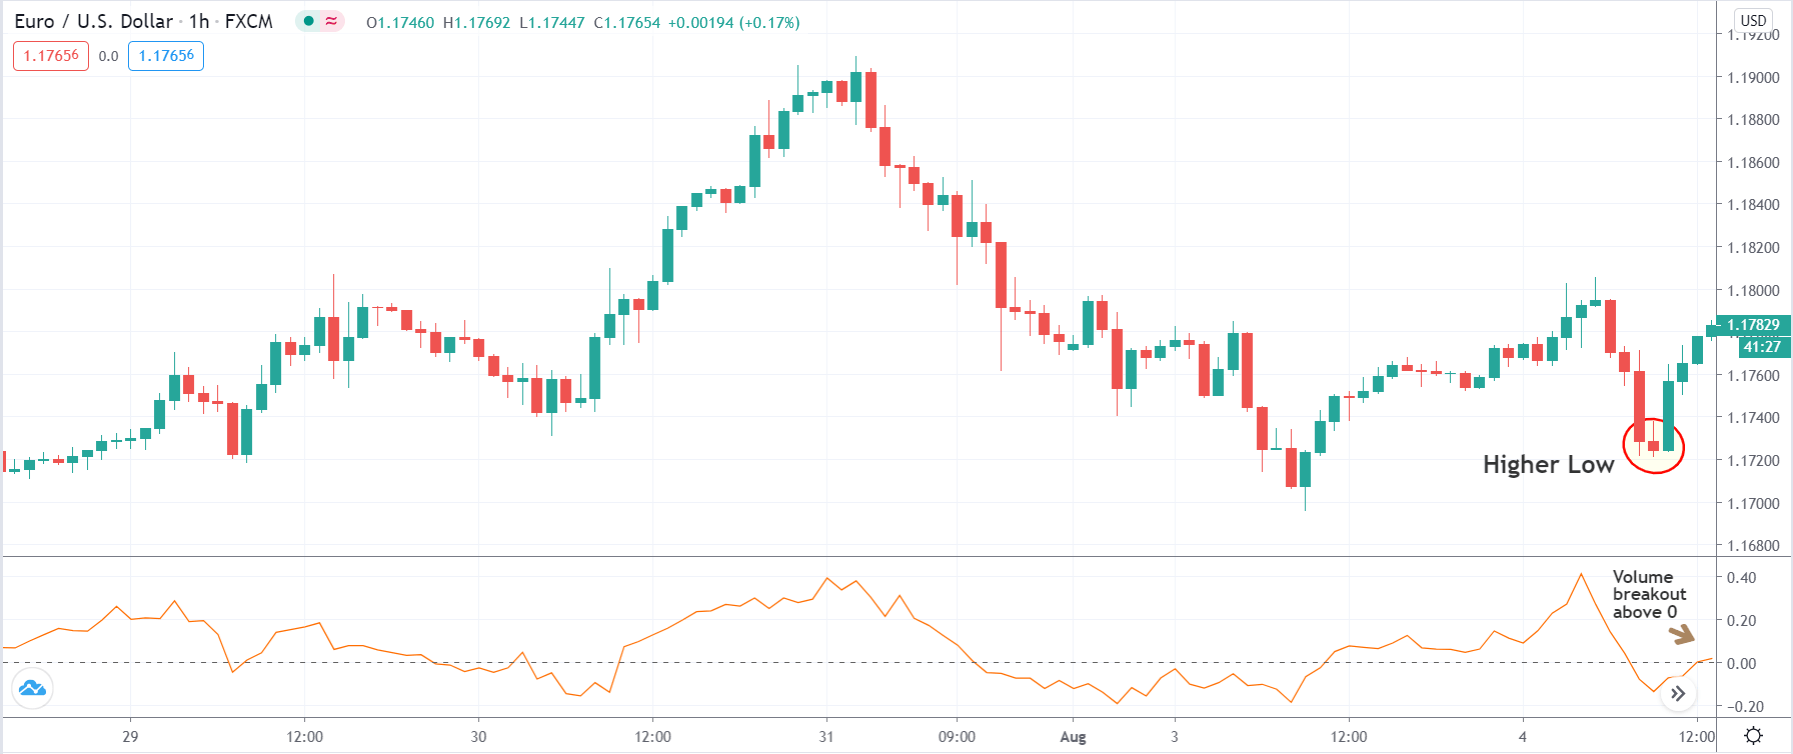
Wait for the Chaikin volume indicator to break back above the zero lines. We enter for a ‘buy’ once a ‘higher low’ is confirmed, and the price starts moving in the direction of the reversal. In a reversal of an uptrend, the Chaikin indicator should break below the ‘zero’ line. We enter for a ‘sell’ once a ‘lower high’ is confirmed, and the price starts moving lower. Once the institutional money comes back in the market, we wait for them to step back and drive the market.

The below image shows a ‘higher low’ being formed along with the volume breakout.

Step 4

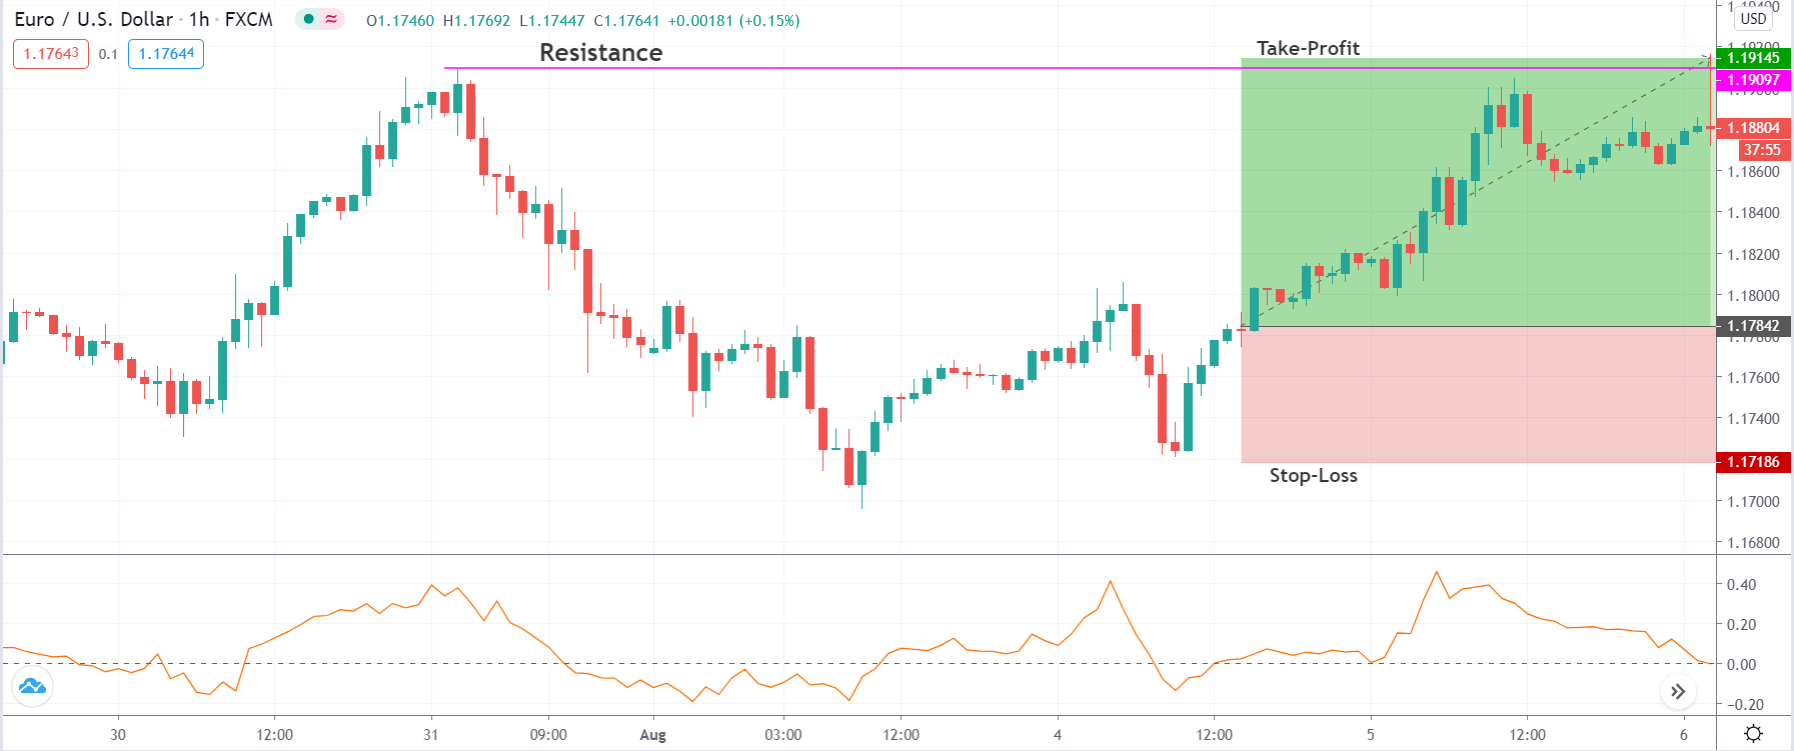
This brings us to the next important step, where we establish protective stop-loss and take-profit for the strategy. We place stop-loss below the ‘higher low’ that confirmed the reversal when ‘long’ in the pair and above the ‘lower high ‘when ‘short’ in the currency pair. This strategy indicates a strong reversal in the market that will change the trend of the market. This is why we set our ‘take-profit’ at the origin of the previous trend.

In our example, the risk-to-reward of the trade was over 1:2, which is great.

Strategy Roundup

The volume trading strategy will continue to work in the future; it is based on the activities of the smart money. Even though they hide all their operations, their footprints are still visible. We can read those marks by using proper tools. The Chaikin indicator will add value to our trading because it gives a window into the volume activity the same way we traded the stocks. Make sure to follow this step-by-step guide to trade properly using volume.

Categories
Forex Basic Strategies

Trading The CAD/JPY Pair Using ‘Commodity Correlation Strategy’

Introduction

Oil is one of the largest commodities in the world that is traded heavily. The reason for high liquidity is that it is a basic necessity. It is needed to run factories, machinery, ships, and cars. Canada is one of the largest exporters of Oil, and it forms a major part of the total volume of commodities exported. Due to these reasons, Canada is positioned in the world’s top ten oil-producing nations, and as a consequence, it’s economy is severely impacted when oil prices decline. Many traders today predict the movement of the Canadian dollar using the price of Oil.

When oil prices rise, the Canadian dollar tends to strengthen. Similarly, when oil prices are low, the Canadian dollar tends to weaken. Japan, in contrast, is considered as the net importer of Oil. So, when oil prices rise, Japanese yen weakens, and when oil prices drop, Japanese yen strengthens. Many traders are not very comfortable trading Oil due to the volatility it possesses.

An alternate and improvised way trading oil directly would be to utilize knowledge of oil prices to trade the CAD/JPY currency pair. As Canada is the net exporter and Japan is the net importer of oil, oil price becomes a major indicator for the movement of the CAD/JPY currency pair. That is why we have named this strategy a ‘Commodity Correlation Strategy.’ Let us dive into the strategy and explore the steps involved.

Time Frame

The commodity correlation strategy works well with the daily (D) and weekly (W) time frame charts. Swing trading is the most suitable trading style for this strategy as it has a long-term approach to the price. Therefore, the strategy cannot be used for day trading or on 4-hours’ time frame chart.

Indicators

We use just one technical indicator in this strategy, and that is the Average True Range (ATR) to set the stop loss for the trade. We don’t use any other indicator during the application of the strategy. If one is not familiar with the ATR indicator, it is recommended to refer our article on ATR before understanding the strategy.

Currency Pairs

This strategy can be used with CAD/JPY currency pair only, with the movement of oil prices as our leading indicator.

Strategy Concept

The price movement of crude Oil is used as a reference to catch a ‘trade’ in CAD/JPY currency pair. Key levels of support and resistance on the crude oil chart are used to spot long and short opportunities in CAD/JPY pair. If price closes above resistance on the oil chart, a long trade is activated on the CAD/JPY the following day. Similarly, if the price closes below support on the oil chart, a short trade is triggered on the CAD/JPY the following day. The risk to reward of trade taken based on this strategy is a minimum of 1:2, which is above normal. A bigger target can be achieved by allowing the trade to run.

Trade Setup

In order to explain the strategy, we focus on the price chart of crude Oil and CAD/JPY currency pair. We are not concerned with any other forex pair. The strategy can be easily understood by those who have basic knowledge of support and resistance.

Step 1

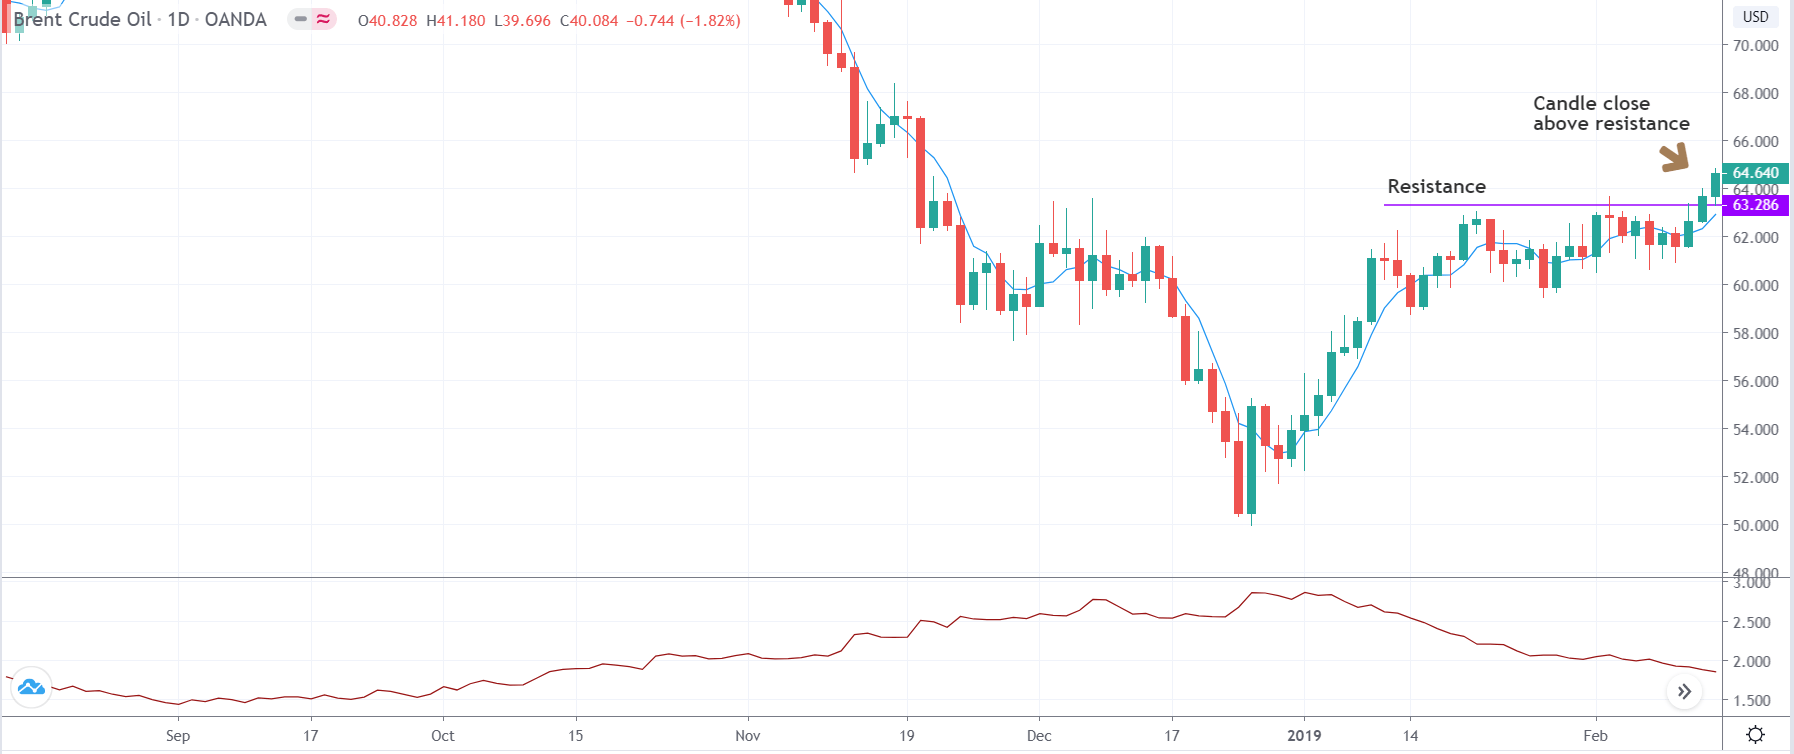
Firstly, we need to open the chart of crude Oil and then find key levels of support and resistance. After marking support and resistance levels, we wait for a breakout or breakdown of the range. After the breakout happens, make sure that the breakout is real and a faker. A close candle well above the resistance area gives us a confirmation of the breakout, and thus we can expect a continuation of the price in the direction of the breakout.

The below image shows how the breakout should be along with the confirmation candle.

Step 2

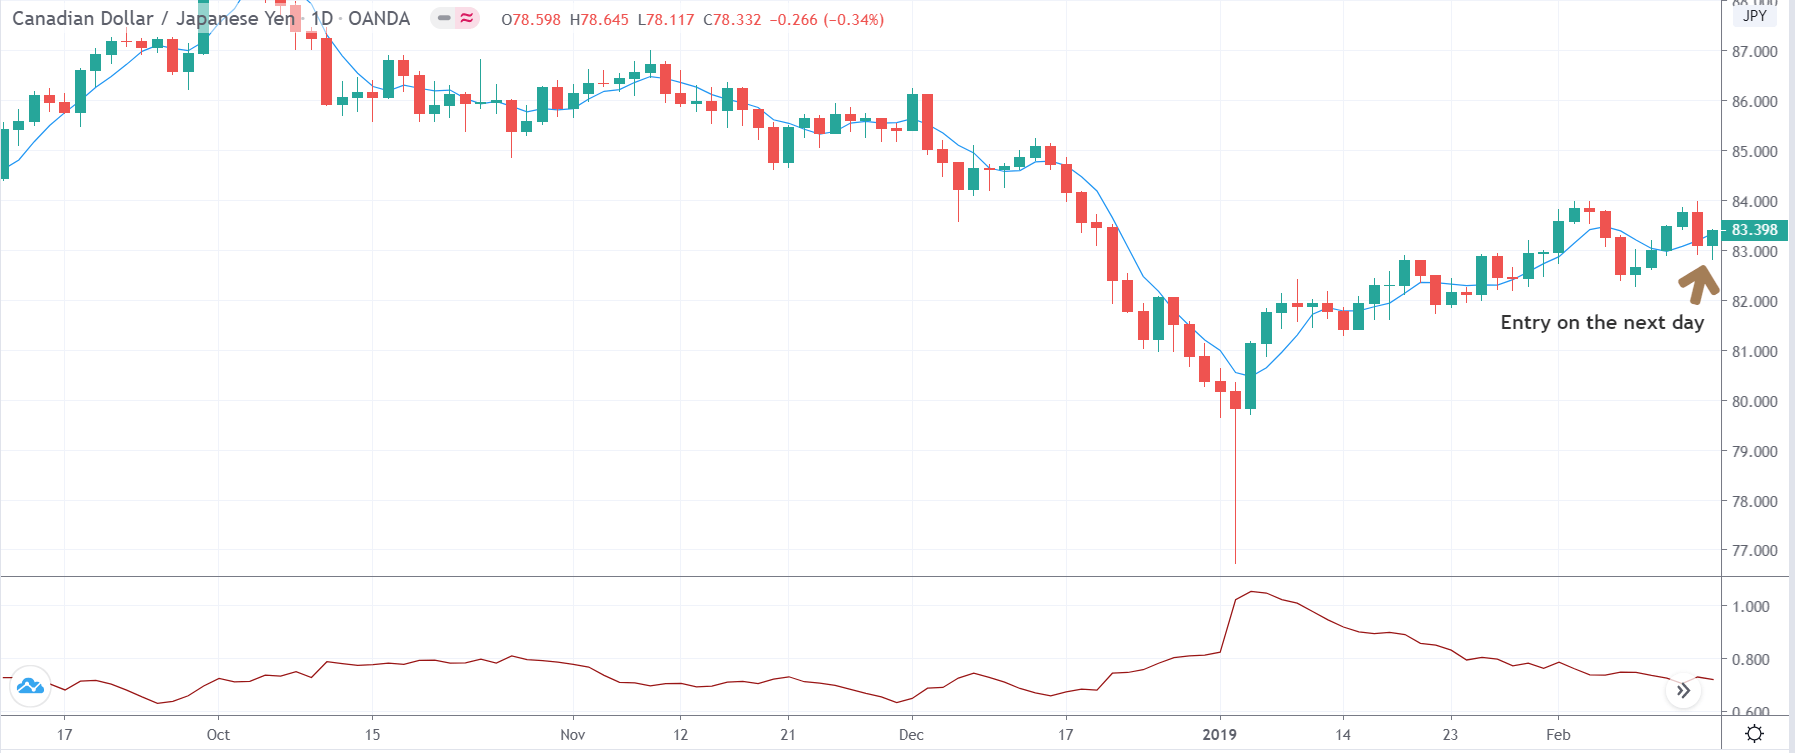
Now, we need to open the chart of CAD/JPY currency pair and locate the price on the day when the breakout took place on the oil chart. Since the breakout on the oil chart is above the resistance, we will ‘long’ in CAD/JPY currency pair after a suitable confirmation sign from the market. A bullish candle on the next day is the confirmation signal for going ‘long.’ In a case of a breakdown below the support, a bearish candle in the CAD/JPY pair on the next day of the breakdown is suitable for going ‘short’ in the pair.

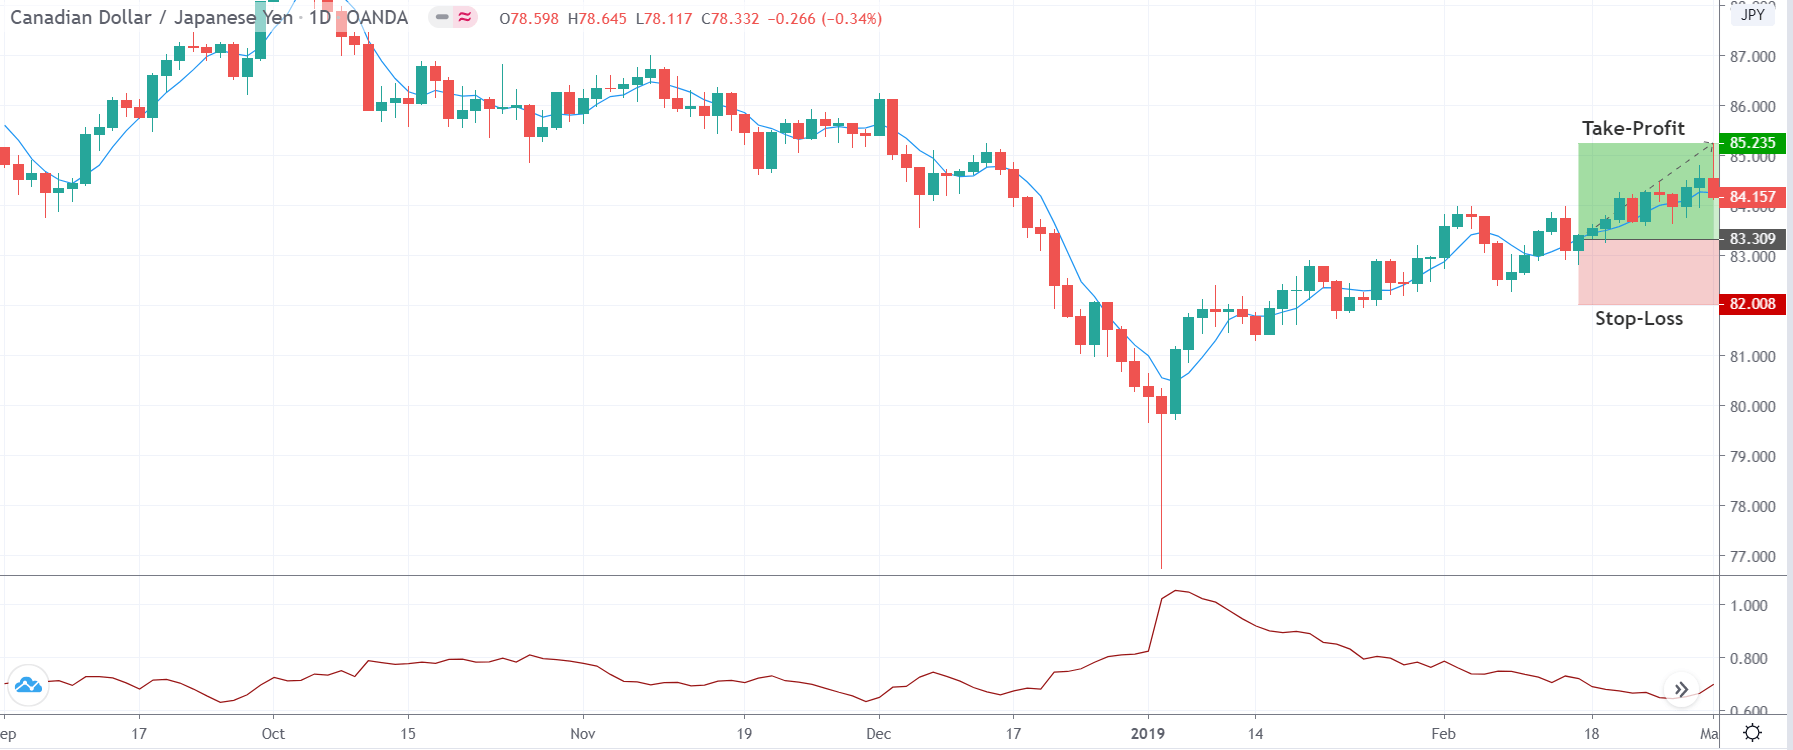
In the above example, we see the formation of a bullish candle on the following day, which triggers a ‘buy’ trade. Let us see what happens further.

Step 3

In this step, we determine take-profit and stop-loss levels for our strategy. The stop loss for this strategy is calculated by multiplying the value of ATR by 2. The stop loss is placed by the number of pips obtained after performing the calculation. The take-profit is placed at the price where the risk to reward of the trade will be at least 1:2. However, in most cases, the trade has the potential to provide move higher.

In this example, the risk to reward of the trade was 1.5 as the major trend was down.

Strategy Roundup

Using the Commodity Correlation Strategy, traders can take advantage of the positive correlation between Crude oil prices and the CAD/JPY currency pair. This strategy is especially suitable for traders who want to trade in Oil but do not enjoy the volatility associated with it. This strategy is also suitable for traders who do not have the time to day trade and prefer long-term positions in the pair.

Crude Oil has the highest correlation with CAD and JPY Forex pairs. Hence we have considered these asset classes. You can use this strategy for different Forex pairs depending on which commodities they are correlated with. We hope you found this strategy informative. All the best.