Categories
Forex Assets Forex Basic Strategies Forex Trading Strategies

Trading Strategy For the CAD/JPY Currency Pair

In this article what I want to tell you is one of my strategies that is working well in real life using the CAD/JPY pair. Why this pair? I have chosen this pair as an example but will show you different trading systems using different currency pairs.

What is the Strategy Based On?

In a very simple system, you will know that my systems are characterized by that. The reason is that they tend to be the ones that last the longest and the most robust. You’d be amazed to see the simple systems that exist that have been producing good results for years and years.

First of all, what I’m going to show you next is a profitable, not perfect Forex trading system. The curves without falls or volatility are left to the martingales and gurus.

1.1 Criteria for entry

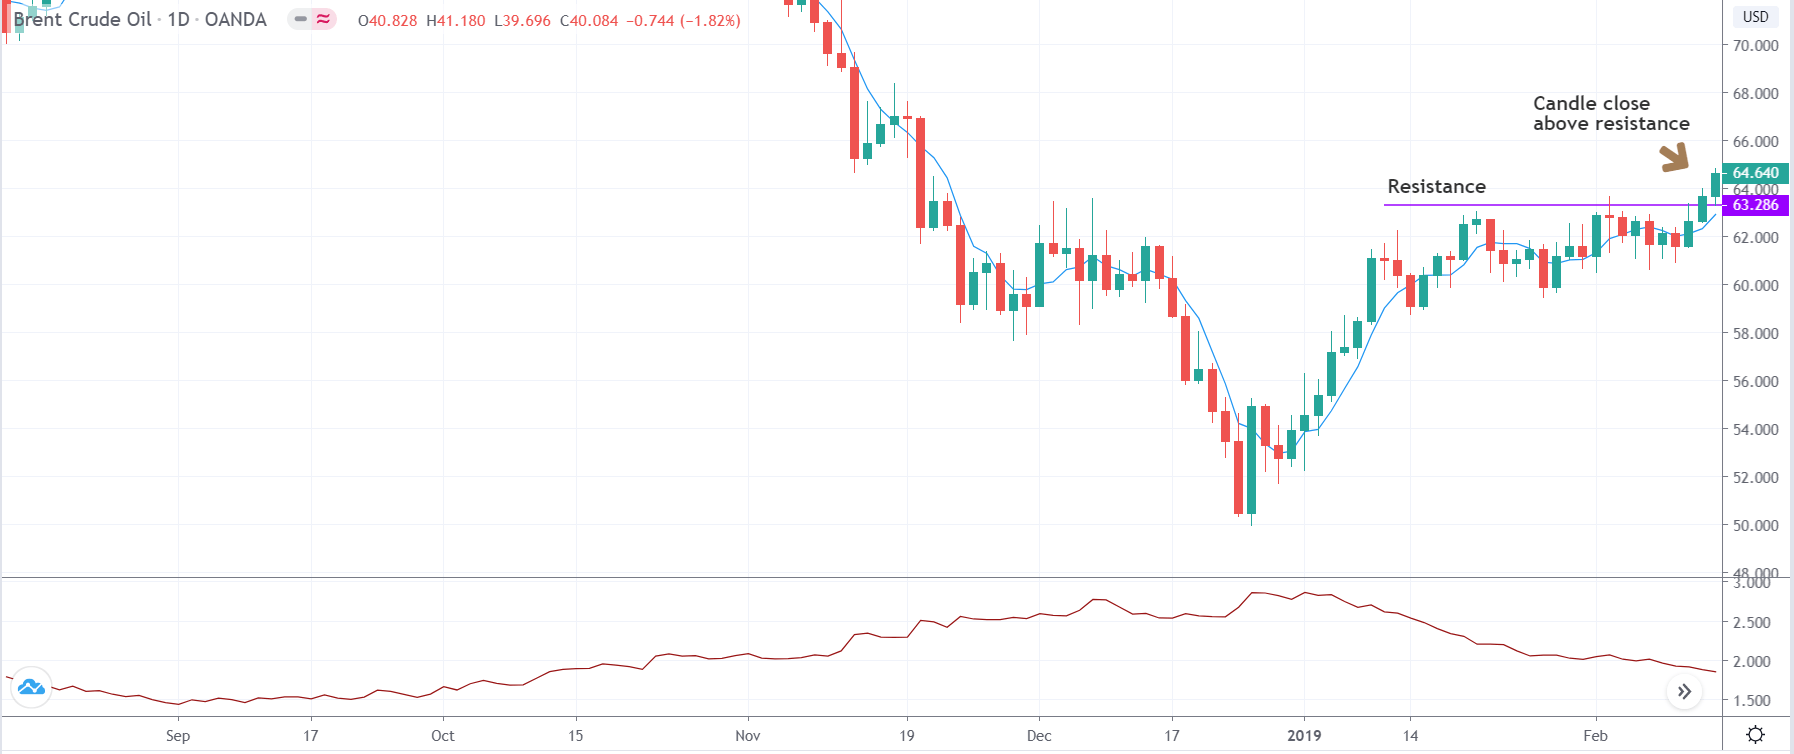
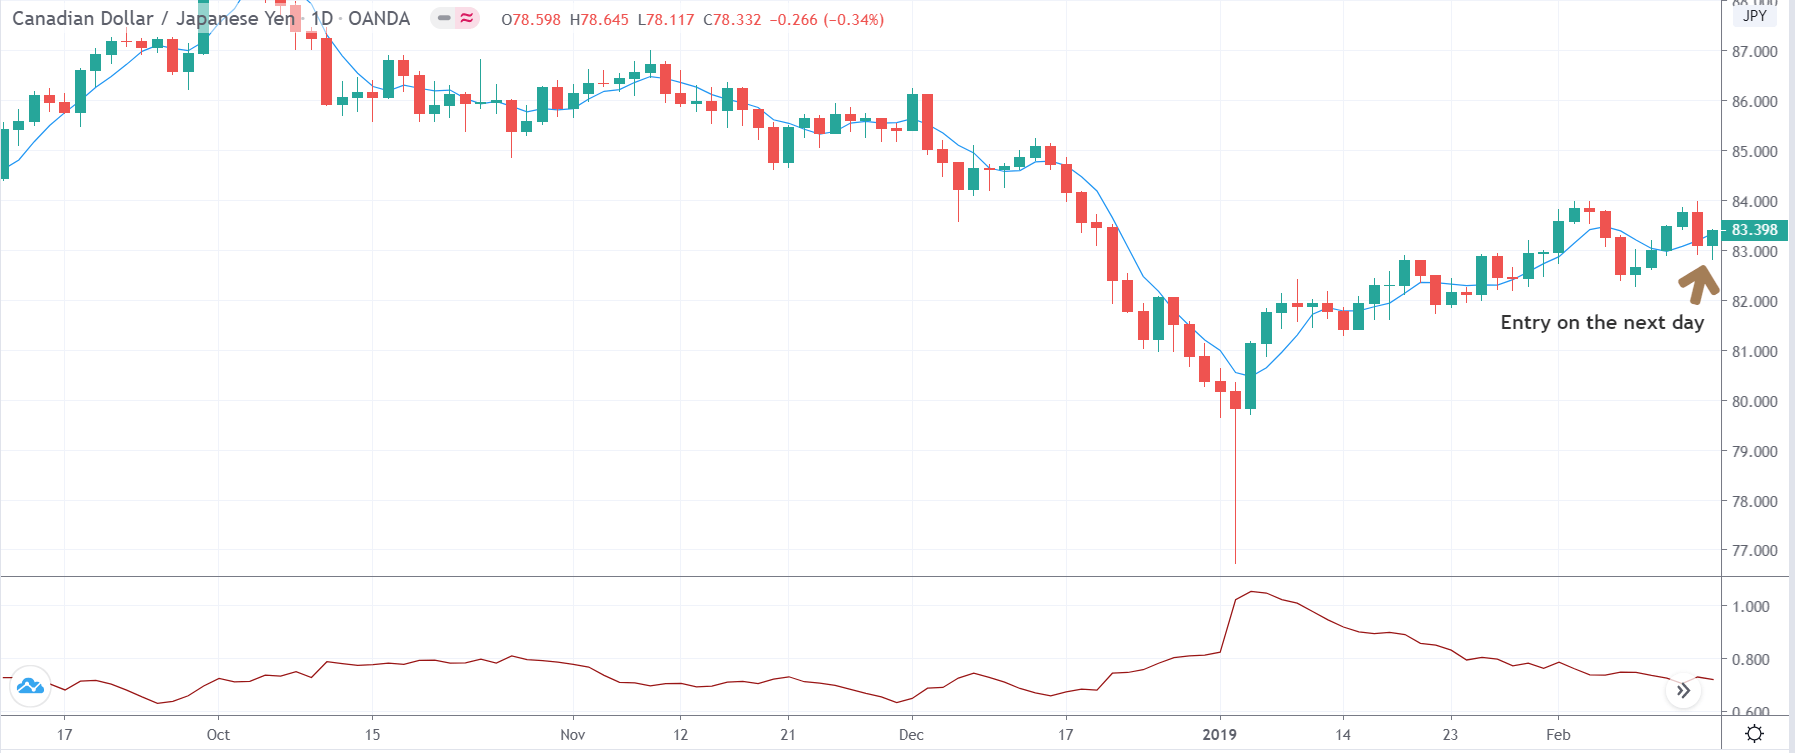
We will enter the market by purchasing in the CAD/JPY pair when there is an upward turn in the Accumulation Distribution indicator and the price opens below the simple moving average of 19 periods. We will do the opposite (we will enter shorts in CAD/JPY) when the AD spin is down and the price opens above the average. As I write this article we are short on this pair indeed.

1.2 Exit criteria

We will close the position we have taken provided one of these conditions is met:

1.2.1 Output per indicator

We leave the buying position when the Williams Percent Range indicator falls below the marked level (59, you can see in the chart above). We will also close our short position when it passes this level.

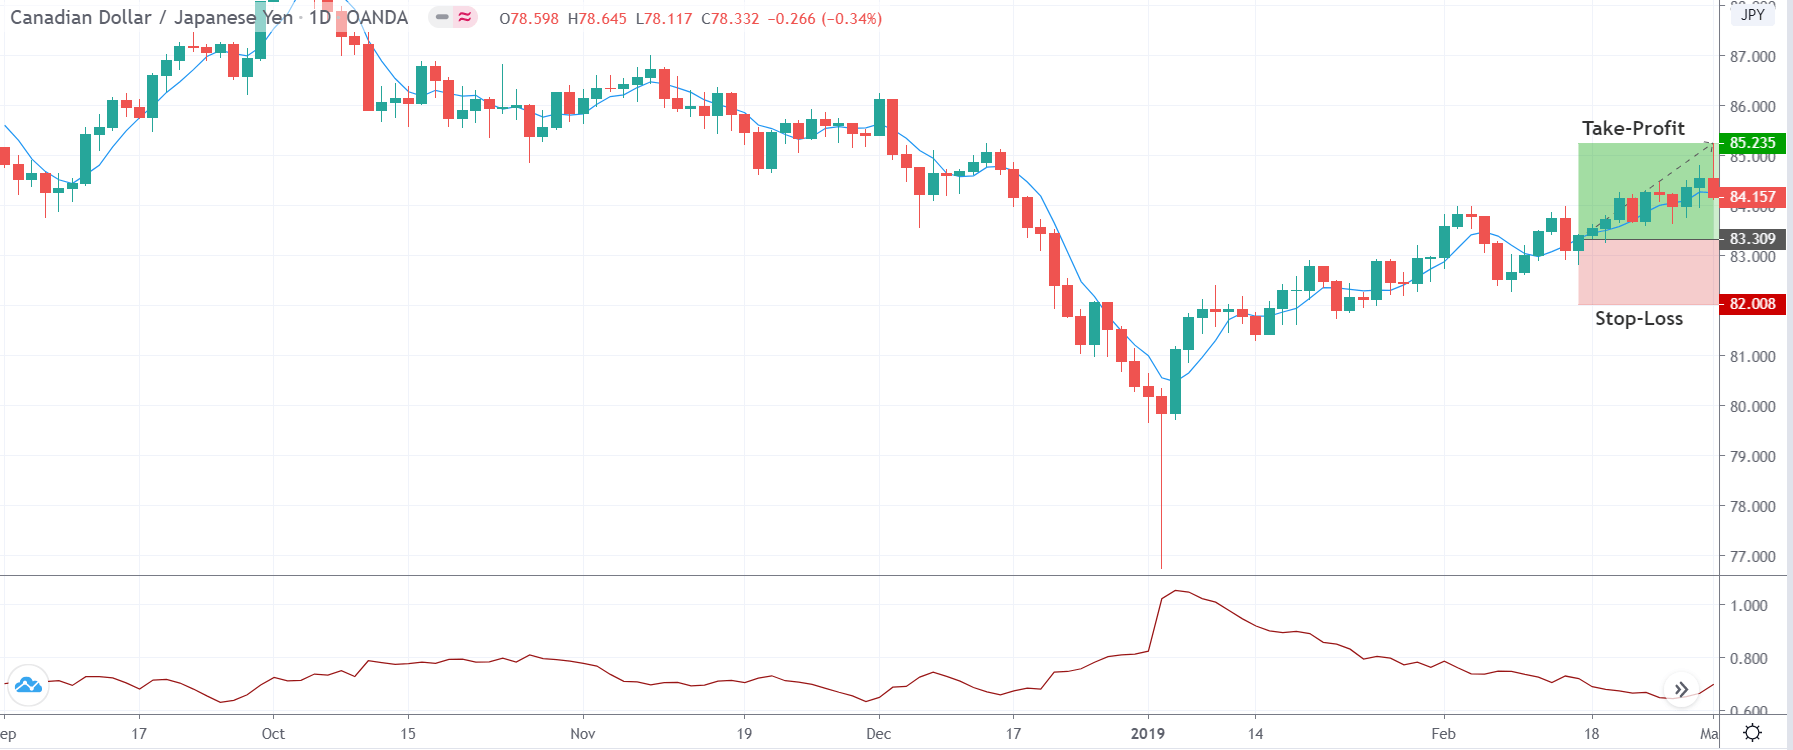
1.2.2 Exit by stop or profit

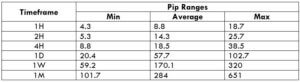
If the indicator has not already given us a sign of closure, we will do so when our operation reaches the loss limit of 60 pips (stop loss) or we have reached our profit target (take profit) of 220 pips. The interesting thing here is that a winning operation compensates us for more than three losing trades since when we achieve 220 pips we can lose three out of 60 and still not have lost money.

Statistics of the System

With the well-defined rules of our trading system, let’s see how it has behaved in recent years and what the main features are. Note that this system has not been optimized.

The stability in the balance line, as its name indicates, measures how the return curve behaves. Our goal is that it is as stable as possible and that there are no abrupt drops. The closer to 100 the better, so an 81.73 is good data. In addition, it is important to note that we have a sample of 300 trades so it is a significant sample. If I show you this strategy with 40 trades and it is winning, it can be a chance. Logic tells us that the larger the sample, the more reliable will be. Remember that we seek to minimize chance and bring statistics to our advantage.

It’s very important to know that you have up to 11 consecutive losing trades, but considering that the risk-to-profit ratio is 1:3, it is acceptable. One of my favorite parameters when choosing a trading strategy is the profit factor or profit factor. A PF above 1.5 is good. This ratio tells us how much our system earns when it pays compared to how much it loses when it loses. Simply put, our system on average earns more when it wins than it loses when it loses. And we’re very interested in this.

Another star point for me within a trading system is return/drawdown. Why? Because it is a yardstick to measure what has fallen the profit curve and that profit obtained. When you do real trading you don’t only care about the return, but you care about how to get that return and try to minimize these drops. A ratio of 7.48 is more than okay.

What Can We Expect from this Strategy?

Let’s see how this strategy behaves by comparing buying and short transactions. Not bad. Both when the CAD/JPY pair has maintained a trend and when the pair has steered without a clear direction the lengths and the shorts have remained stable. Now we see those falls as they are. There are no peaks too strong and they are also kept under control.

Is It a Forever Strategy?

This strategy is not the only strategy I apply and it will not last forever. It is a strategy of a portfolio of systems that I apply in an automated way in Forex. It is a portfolio that rotates with rules of connection and disconnection of systems depending on their behavior.

You must understand that there are trading systems whose statistical advantage disappears and that you must therefore stop trading. This is nothing else that stops being profitable because a certain pattern is no longer profitable. This happens on a day-to-day basis with some businesses, with trading also happening, for example, when a large number of traders exploit a method. The advantage disappears, therefore.

Instead of applying or learning the foolproof method of trading on Forex or any other asset, learn to measure what you are going to apply before, during, and after. If you can measure, you can improve, but above all, you can make informed decisions.

Is This the Best Strategy Ever?

The goal of this article is not to remove the arsenal. But it is a system that I have been applying in real life with good results. The important thing is that you understand that a simple strategy can work very well over time, that you need data to evaluate it and criteria to manage it. And that this is all just a work plan.

Categories
Forex Market Analysis

CAD/JPY: A massive round number holding the key

CAD/JPY produced a bullish inside bar yesterday. The price had a bounce at the same level earlier and made a bullish move. The daily chart suggests that the price has some space to travel towards the North. However, if a bullish inside bar is followed by a bearish engulfing candle, it ends up being prolific for the sellers. The H4 chart looks bullish. On the other hand, the H1 chart looks a bit bearish biased. Thus, traders are to be very watchful to trade in the pair. Let us now have a look at three vital charts.

Chart 1 CAD/JPY Daily Chart

The chart shows that it had a bounce at the level of 80.000 earlier. It is a massive round number. It pushed the price towards the North, and the price made a bearish move, closing within the level. Yesterday’s candle came out as a bullish inside bar. As far as the round numbered support is concerned, the price may make a bullish move. However, if the price gets bearish and ends up producing a bearish engulfing candle closing below 80.000, the sellers may go short in the pair aggressively and drive the price towards the level of 78.300. On the other hand, if the price gets bullish, it may find its next resistance around 81.400.

Chart 2 CAD/JPY H4 Chart

The chart shows that the price upon having a bounce at the level of 80.800 produced a spinning top and headed towards the North. It made a bullish breakout at the level of 80.600. The pair had a rejection at 80.800. It has been in a bearish correction. The level of 80.600 may work as a level of support. If the level ends up producing a bullish reversal candle, the buyers may go long above the level of 80.800. The price may find its next resistance around 81.400.

Chart 3 CAD/JPY H1 Chart

The price had a rejection at the level of 80.800 twice. It produced a bearish engulfing candle. The pair is trading around the neckline at 80.640. A bearish reversal candle may attract the sellers to go short in the pair and drive the price towards the South. The price may find its next support around 80.150. On the other hand, the buyers are to wait to go long above the level of 80.800.

The H1 chart looks bearish biased. However, the daily and the H4 chart look bullish. Considering these three charts, it seems that the pair may end up having another bullish day.

Categories
Forex Basic Strategies

Trading The CAD/JPY Pair Using ‘Commodity Correlation Strategy’

Introduction

Oil is one of the largest commodities in the world that is traded heavily. The reason for high liquidity is that it is a basic necessity. It is needed to run factories, machinery, ships, and cars. Canada is one of the largest exporters of Oil, and it forms a major part of the total volume of commodities exported. Due to these reasons, Canada is positioned in the world’s top ten oil-producing nations, and as a consequence, it’s economy is severely impacted when oil prices decline. Many traders today predict the movement of the Canadian dollar using the price of Oil.

When oil prices rise, the Canadian dollar tends to strengthen. Similarly, when oil prices are low, the Canadian dollar tends to weaken. Japan, in contrast, is considered as the net importer of Oil. So, when oil prices rise, Japanese yen weakens, and when oil prices drop, Japanese yen strengthens. Many traders are not very comfortable trading Oil due to the volatility it possesses.

An alternate and improvised way trading oil directly would be to utilize knowledge of oil prices to trade the CAD/JPY currency pair. As Canada is the net exporter and Japan is the net importer of oil, oil price becomes a major indicator for the movement of the CAD/JPY currency pair. That is why we have named this strategy a ‘Commodity Correlation Strategy.’ Let us dive into the strategy and explore the steps involved.

Time Frame

The commodity correlation strategy works well with the daily (D) and weekly (W) time frame charts. Swing trading is the most suitable trading style for this strategy as it has a long-term approach to the price. Therefore, the strategy cannot be used for day trading or on 4-hours’ time frame chart.

Indicators

We use just one technical indicator in this strategy, and that is the Average True Range (ATR) to set the stop loss for the trade. We don’t use any other indicator during the application of the strategy. If one is not familiar with the ATR indicator, it is recommended to refer our article on ATR before understanding the strategy.

Currency Pairs

This strategy can be used with CAD/JPY currency pair only, with the movement of oil prices as our leading indicator.

Strategy Concept

The price movement of crude Oil is used as a reference to catch a ‘trade’ in CAD/JPY currency pair. Key levels of support and resistance on the crude oil chart are used to spot long and short opportunities in CAD/JPY pair. If price closes above resistance on the oil chart, a long trade is activated on the CAD/JPY the following day. Similarly, if the price closes below support on the oil chart, a short trade is triggered on the CAD/JPY the following day. The risk to reward of trade taken based on this strategy is a minimum of 1:2, which is above normal. A bigger target can be achieved by allowing the trade to run.

Trade Setup

In order to explain the strategy, we focus on the price chart of crude Oil and CAD/JPY currency pair. We are not concerned with any other forex pair. The strategy can be easily understood by those who have basic knowledge of support and resistance.

Step 1

Firstly, we need to open the chart of crude Oil and then find key levels of support and resistance. After marking support and resistance levels, we wait for a breakout or breakdown of the range. After the breakout happens, make sure that the breakout is real and a faker. A close candle well above the resistance area gives us a confirmation of the breakout, and thus we can expect a continuation of the price in the direction of the breakout.

The below image shows how the breakout should be along with the confirmation candle.

Step 2

Now, we need to open the chart of CAD/JPY currency pair and locate the price on the day when the breakout took place on the oil chart. Since the breakout on the oil chart is above the resistance, we will ‘long’ in CAD/JPY currency pair after a suitable confirmation sign from the market. A bullish candle on the next day is the confirmation signal for going ‘long.’ In a case of a breakdown below the support, a bearish candle in the CAD/JPY pair on the next day of the breakdown is suitable for going ‘short’ in the pair.

In the above example, we see the formation of a bullish candle on the following day, which triggers a ‘buy’ trade. Let us see what happens further.

Step 3

In this step, we determine take-profit and stop-loss levels for our strategy. The stop loss for this strategy is calculated by multiplying the value of ATR by 2. The stop loss is placed by the number of pips obtained after performing the calculation. The take-profit is placed at the price where the risk to reward of the trade will be at least 1:2. However, in most cases, the trade has the potential to provide move higher.

In this example, the risk to reward of the trade was 1.5 as the major trend was down.

Strategy Roundup

Using the Commodity Correlation Strategy, traders can take advantage of the positive correlation between Crude oil prices and the CAD/JPY currency pair. This strategy is especially suitable for traders who want to trade in Oil but do not enjoy the volatility associated with it. This strategy is also suitable for traders who do not have the time to day trade and prefer long-term positions in the pair.

Crude Oil has the highest correlation with CAD and JPY Forex pairs. Hence we have considered these asset classes. You can use this strategy for different Forex pairs depending on which commodities they are correlated with. We hope you found this strategy informative. All the best.

Categories
Forex Assets

Analyzing The CAD/JPY Forex Asset Class

Introduction

CADJPY is the abbreviation for the currency pair, the Canadian dollar against the Japanese yen. This pair is one of the most extensively traded cross currency pairs. In CADJPY, CAD is referred to as the base currency and JPY as the quote currency.

Understanding CAD/JPY

The value of CADJPY is the value of JPY, which is required to purchase one CAD. It is quoted as 1 CAD per X JPY. For example, if the current market price of this pair is 82.651, then these many units of Japanese yen are needed to buy one Canadian dollar.

Spread

The bid price is the price used to sell a currency, and ask price is the price used to buy a currency. There is always a difference between the two prices. This difference is called the spread. It varies from broker to broker and also the type of their execution model.

ECN: 1.1 | STP: 2

Fees

Similar to stockbrokers, there are forex brokers who charge a few pips of fee on each position a trader opens and closes. This fee is no different from the commission brokers levy. On STP accounts, the fee is nil, while on ECN accounts, it is between 6-10 pips depending on the broker one is using.

Slippage

Slippage in trading is the difference between the price requested by the trader and the price he actually received. The two factors responsible for slippage are,

  • The volatility of the market
  • Broker’s execution speed

Trading Range in CAD/JPY

A trading range is a tabular representation of the number of pips a currency pair moved in a given timeframe. It represents the minimum, average as well as the maximum pip movement in six different timeframes. These values prove to be important for assessing one’s risk on a trade. For example, if the minimum pip movement in CADJPY on the 4H timeframe is ten pips, then a trader can expect to lose $917 in about 4H.

Procedure to assess Pip Ranges

  1. Add the ATR indicator to your chart
  2. Set the period to 1
  3. Add a 200-period SMA to this indicator
  4. Shrink the chart so you can determine a large period
  5. Select your desired timeframe
  6. Measure the floor level and set this value as the min
  7. Measure the level of the 200-period SMA and set this as the average
  8. Measure the peak levels and set this as Max.

CAD/JPY Cost as a Percent of the Trading Range

As already mentioned, there is a fee for every trade you take. And knowing the percent fee on the trades you are taking is important, as it depends on the volatility of the market and the timeframe you are trading.

Below is a representation of the total cost variation on trade in terms of percentages. Since costs on ECN accounts are different from STP accounts, we have two separate tables for this concept.

ECN Model Account

Spread = 1.1 | Slippage = 2 |Trading fee = 1

Total cost = Slippage + Spread + Trading Fee = 2 + 1.1 + 1 = 4.1

STP Model Account

Spread = 2 | Slippage = 2 | Trading fee = 0

Total cost = Slippage + Spread + Trading Fee = 2 + 2 + 0 = 4

The Ideal way to trade the CAD/JPY

Before getting right into it, let us comprehend the above tables. The higher the values of the percentages, the higher are the costs on the trade. It is pretty evident from the table that, percentage values are on the higher side in the min column and comparatively lower in the max column. This means that the costs are high when the volatility of the market is low and vice versa. Also, the trades that are taken based on a long term perspective, the costs are considerably low.

One may trade the high volatility markets to minimize your costs, or trade during low volatility by paying high costs. However, it is ideal to enter during those times of the day when the volatility is close to the average values. During these times, one can expect comparatively low costs with enough volatility as well.

On a further note, another simple and effective way to reduce costs is by trading using limit orders. This entry method will take slippage out of the total costs and bring down its value considerably. An example of the same is given below.

Spread = 2 | Slippage = 0 | Trading fee = 0

Total cost = Slippage + Spread + Trading Fee = 2 + 0 + 0 = 2