Categories
Forex Elliott Wave Forex Market Analysis Forex Technical Analysis

Would you Trade this CADJPY Pattern?

The CADJPY cross moved up in the Tuesday trading session, boosted by the stock market’s risk-on sentiment. Although the cross advances 2.25% during the current month, the price is under -4% (YTD).

Technical Overview

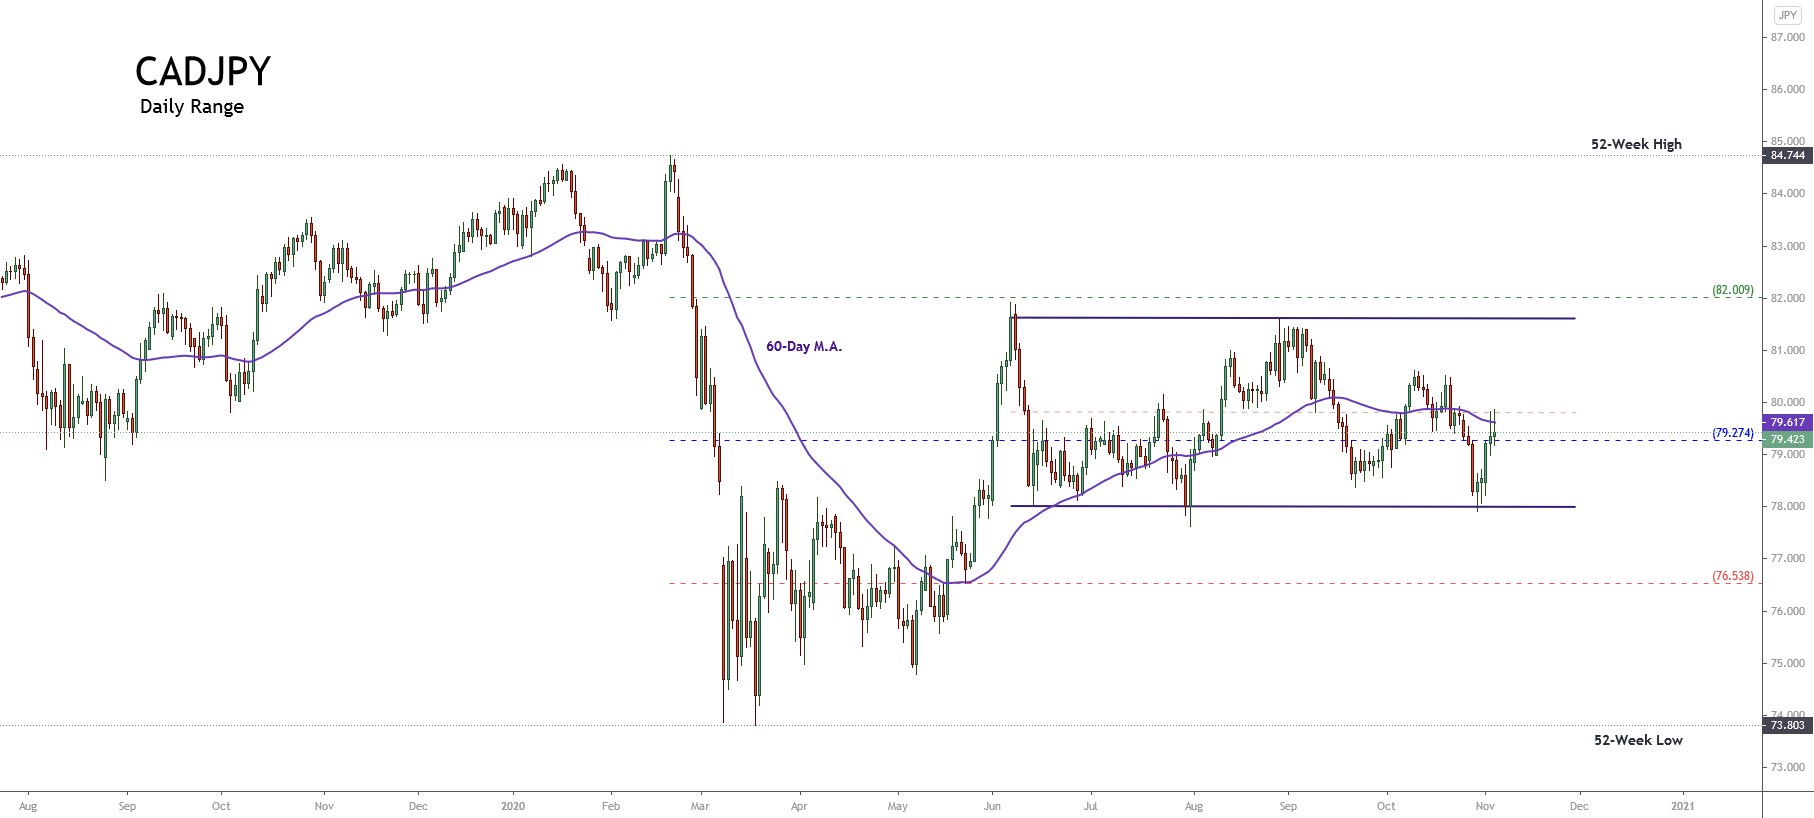
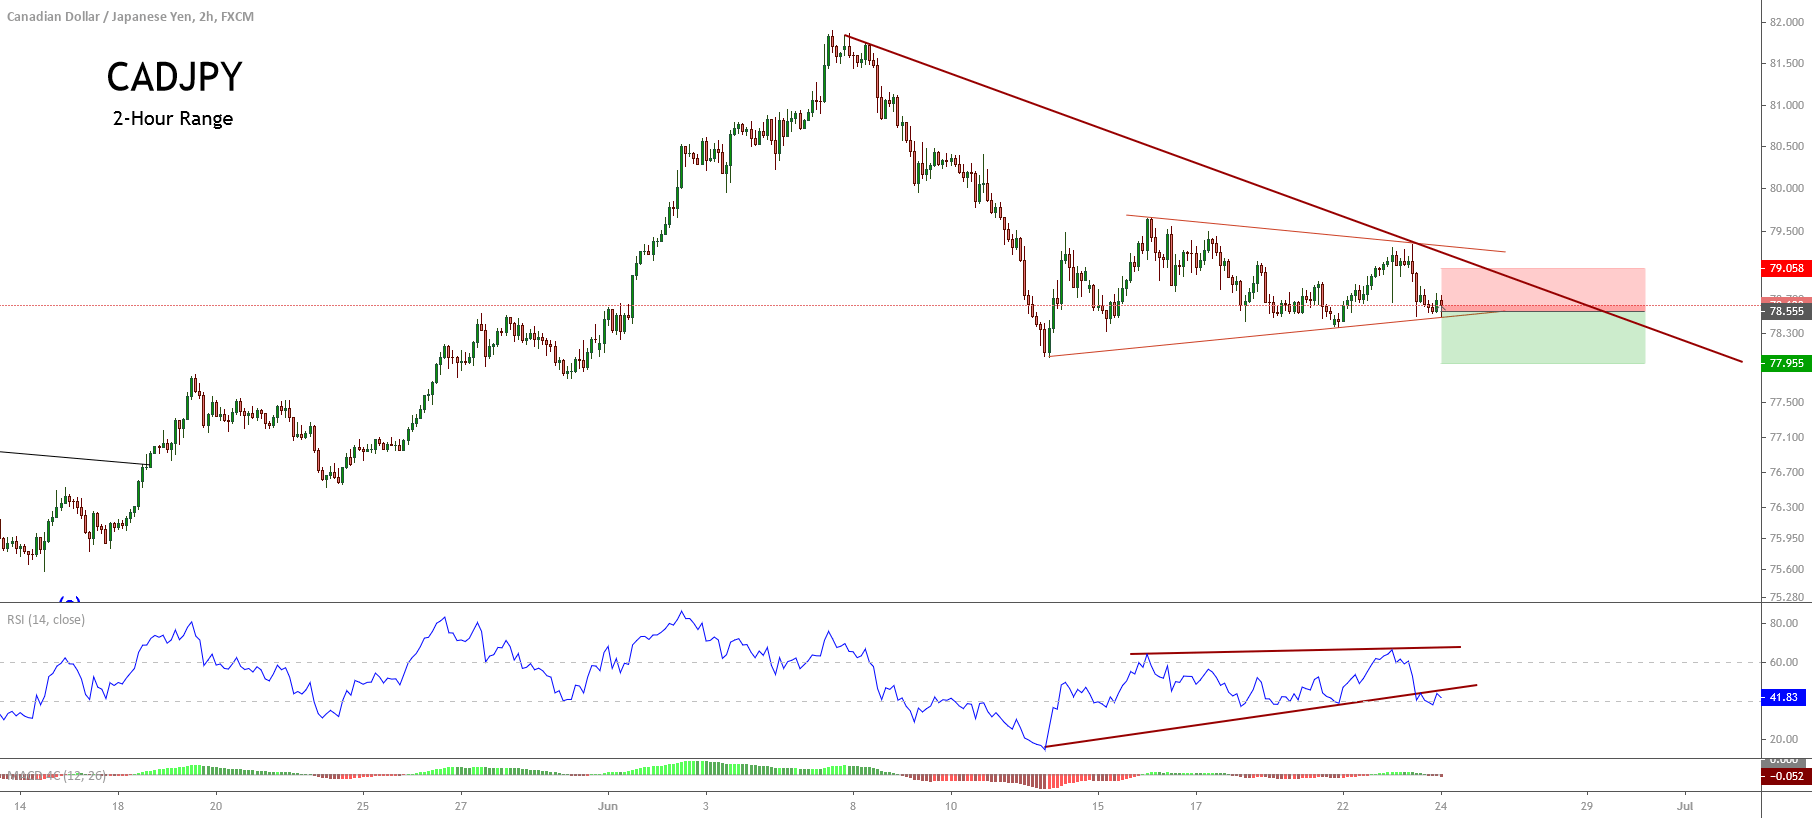
The CADJPY prices represented in the next 12-hour chart reveal the short-term market participants’ sentiment moving in the 90-day high and low range. The figure illustrates the cross advancing mostly upward in the bullish sentiment zone.

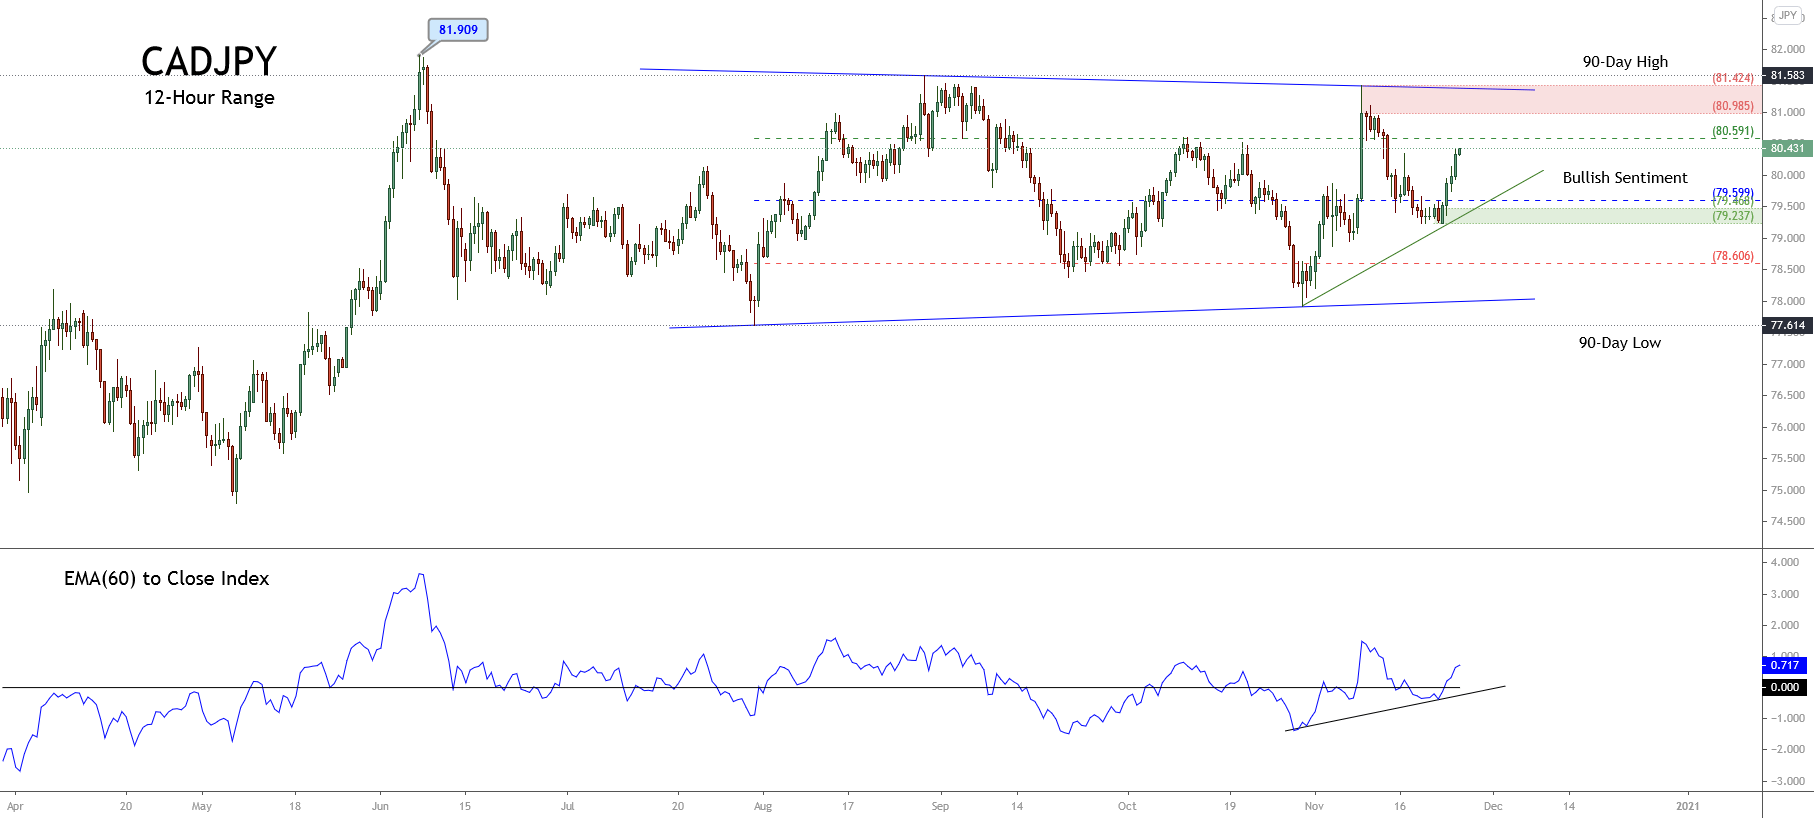
On the other hand, the previous chart presents a contracting triangle, which began in early June when CADJPY found fresh sellers on 81.909, followed by a first support level at 77.614. According to the classic chartist theory, the triangle pattern distinguishes itself as a continuation formation. In this case, this contracting triangle suggests further upsides.

In this regard, the likely next move could lead to a test of its intraday resistance of 80.591: this level corresponds to the bullish sentiment zone’s resistance, as well. If the price overcomes it and extends its upward advance, the cross could reach its supply zone between 80.985 and 81.424, a level that matches the triangle pattern’s upper trendline.

Conversely, a downward correction could drop it to its demand zone between 79.468 and 79.237.

Short-term Technical Outlook

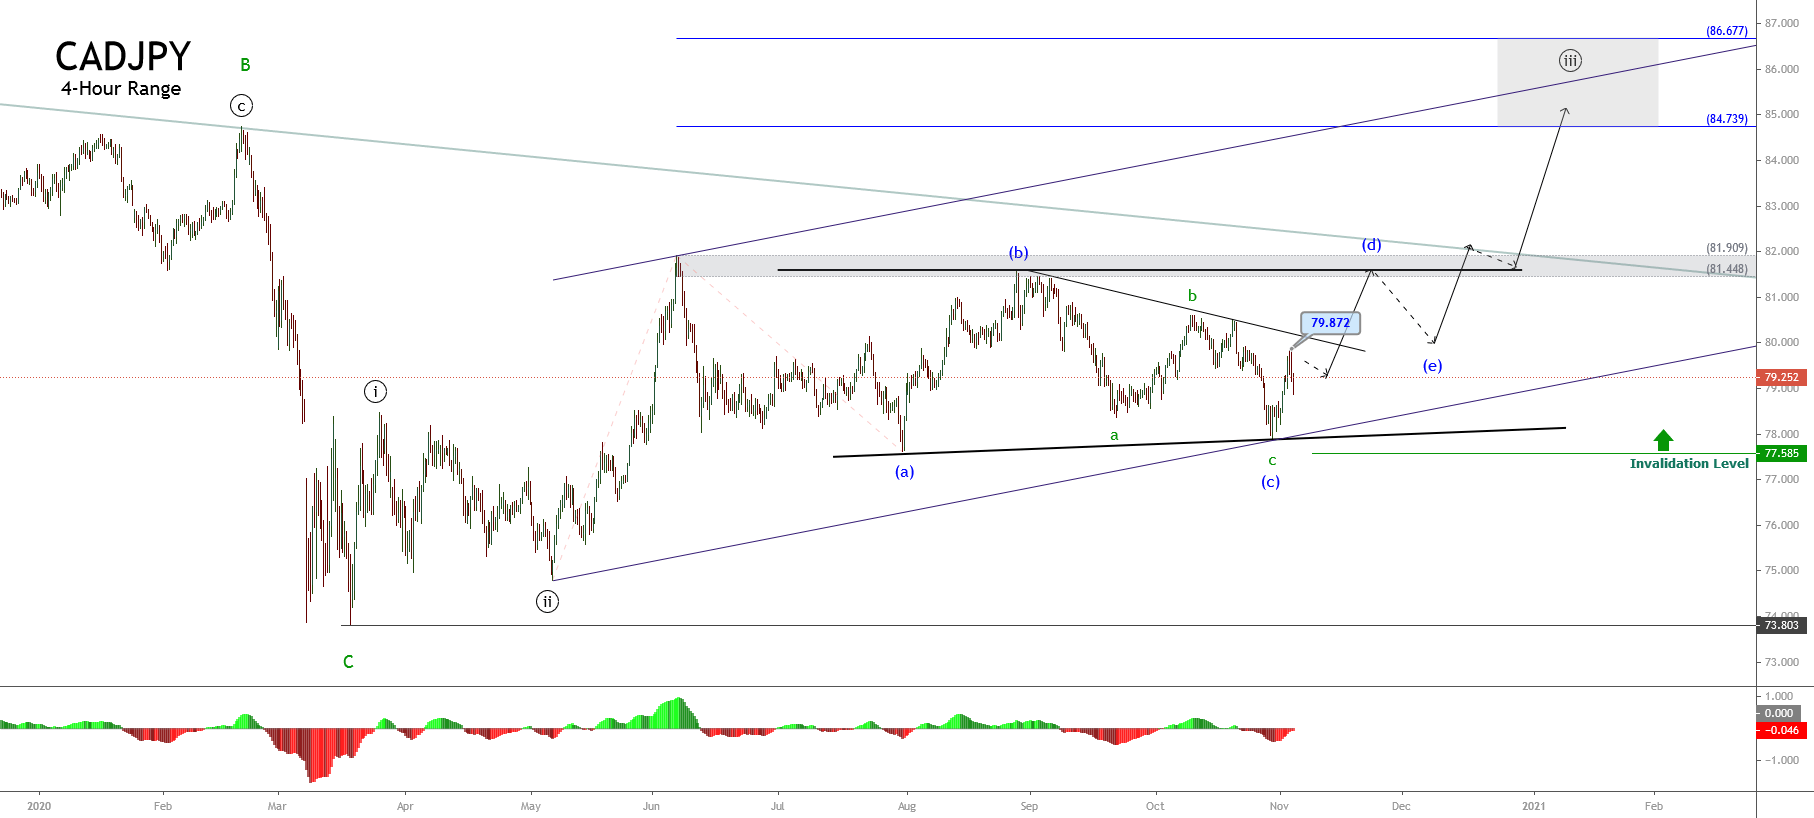
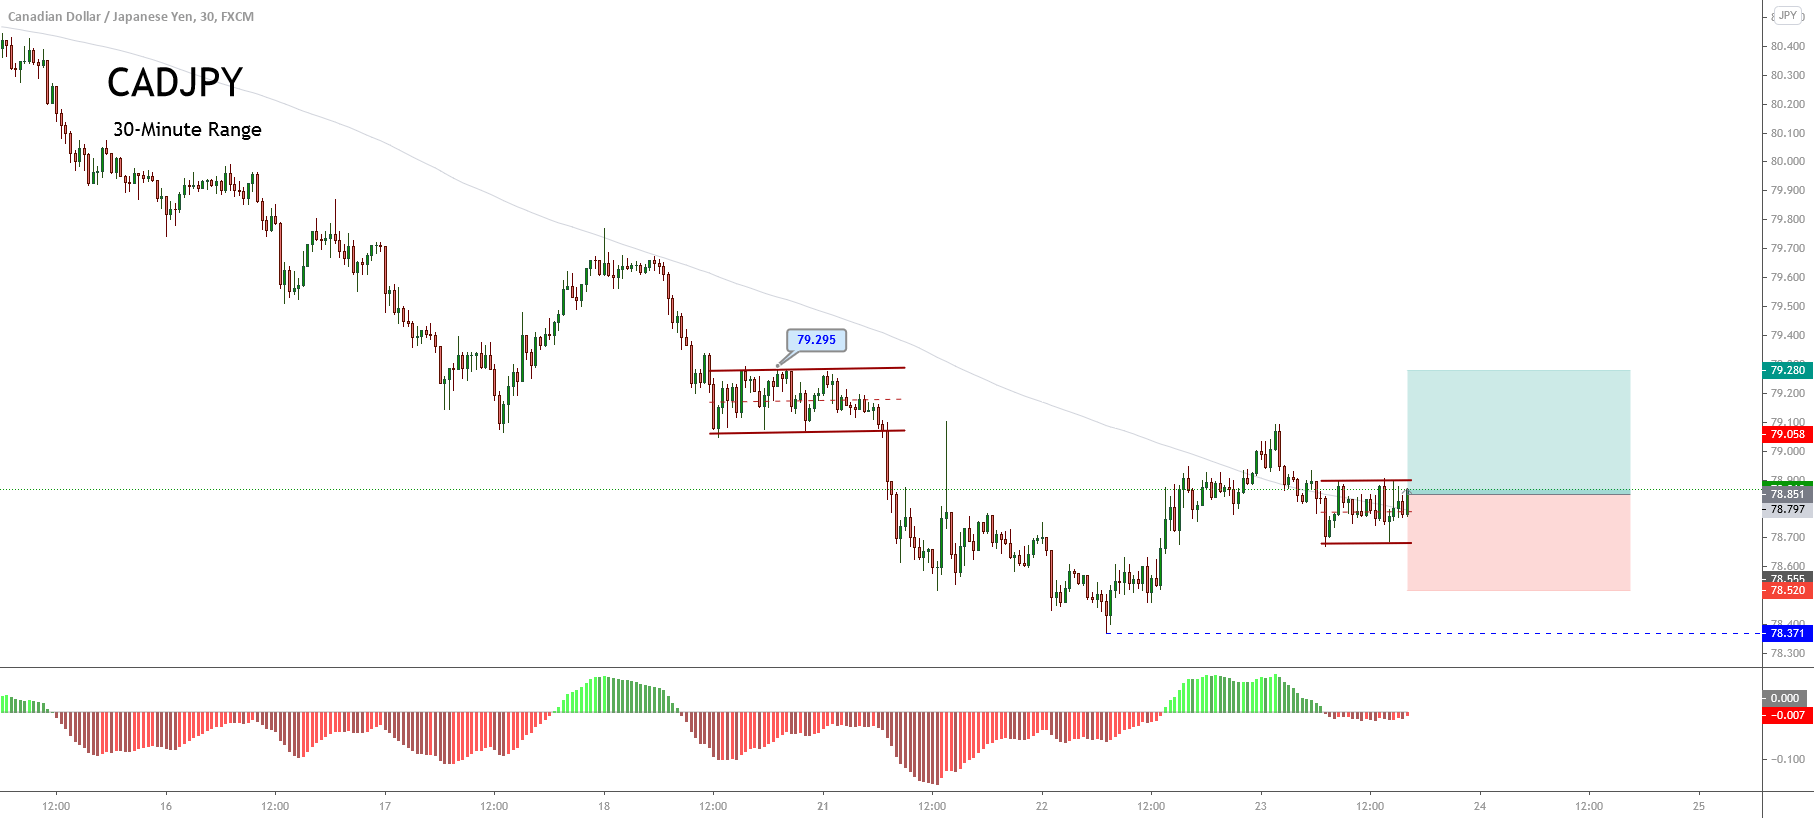
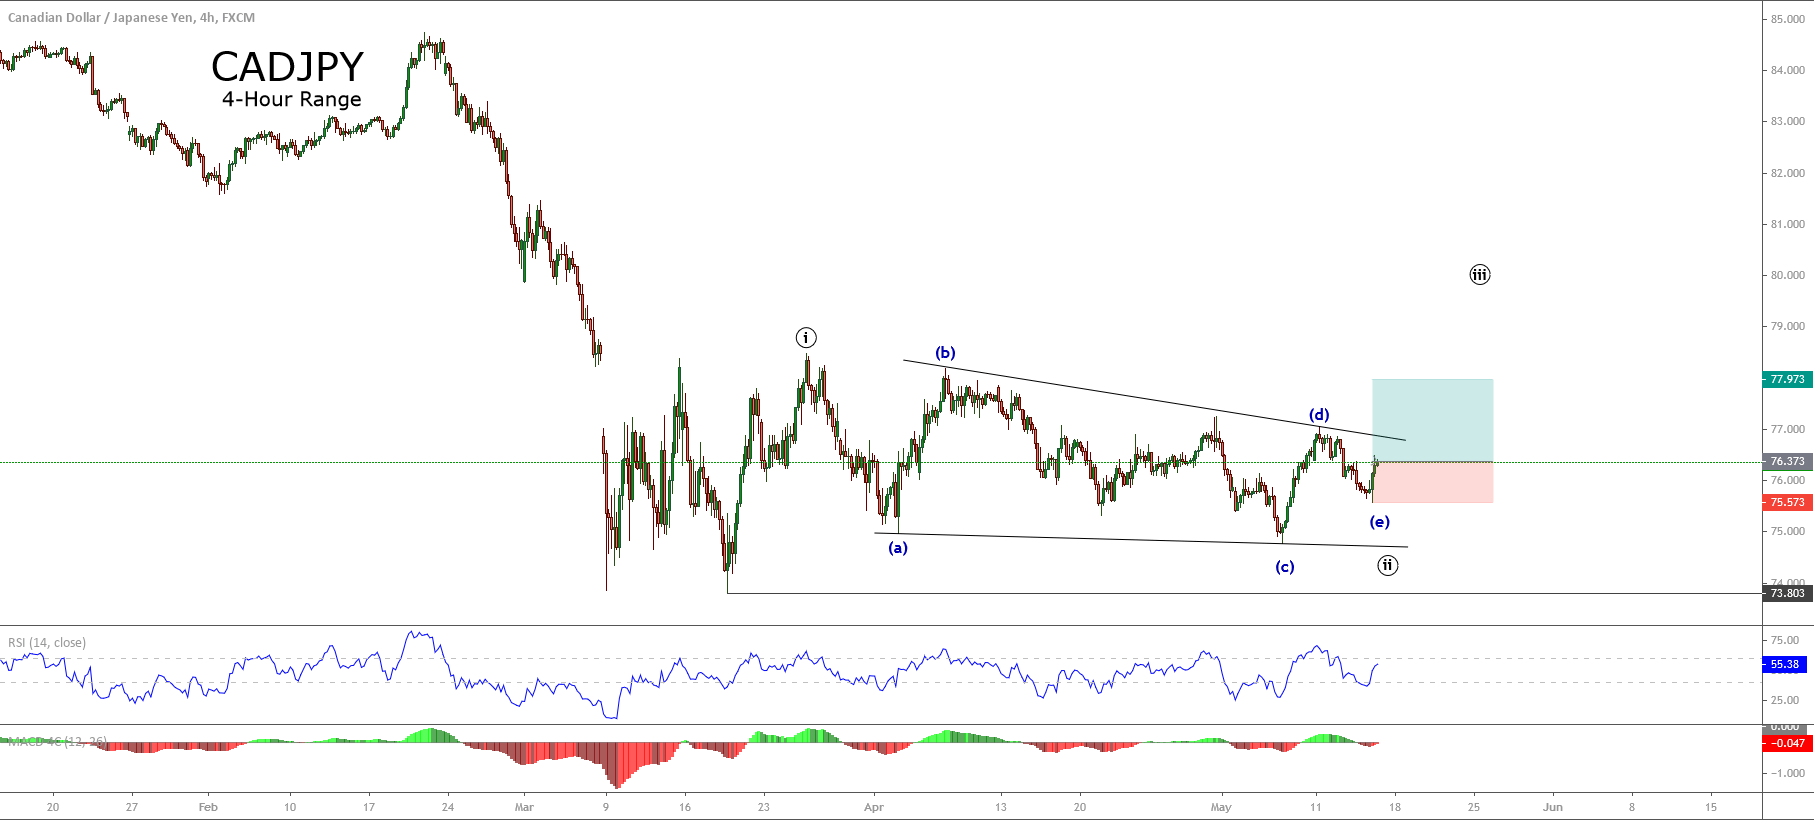
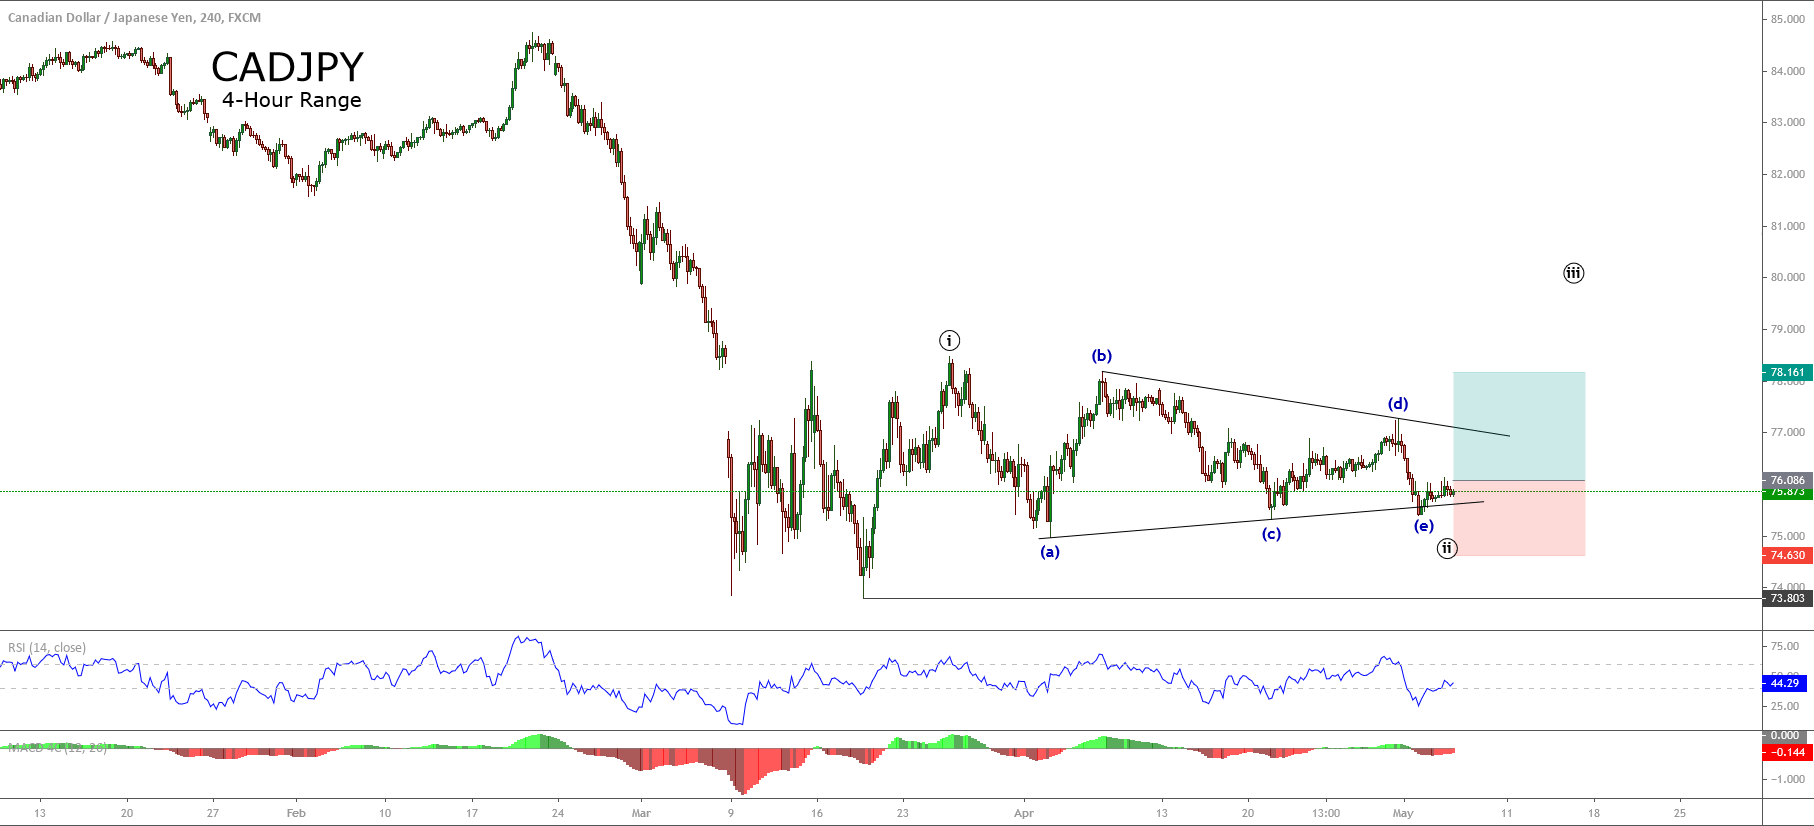
The short-term Elliott Wave view for the CADJPY cross displayed in the next 4-hour chart reveals the advance in an incomplete internal structural series of a contracting triangle pattern, which currently advances developing its wave (e) of Minuette degree, labeled in blue.

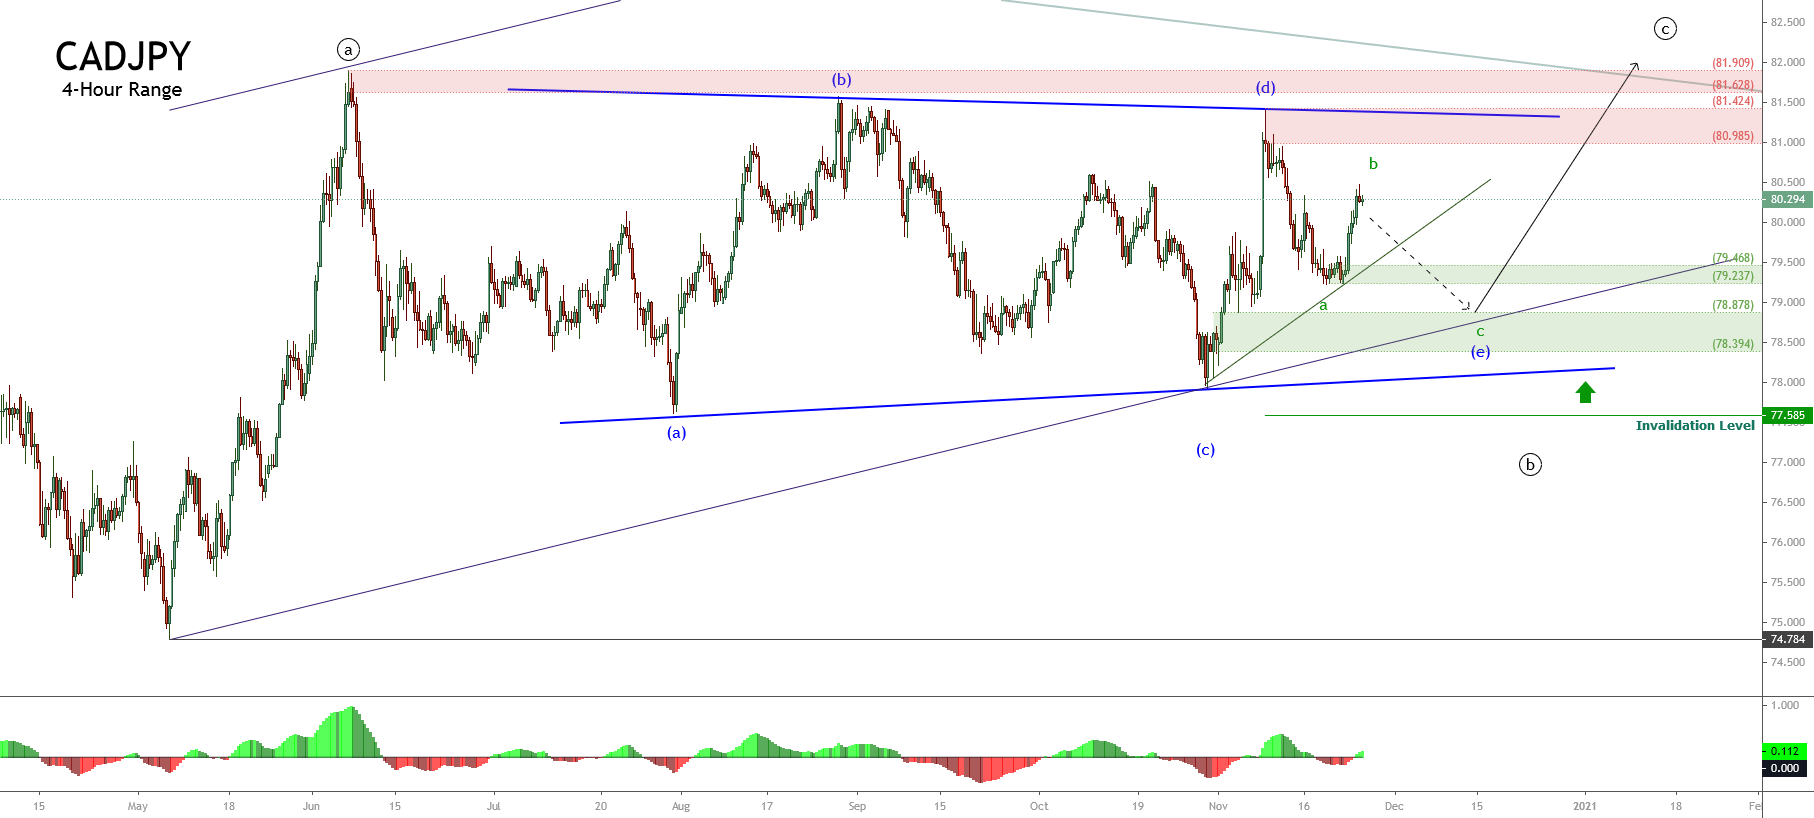
The previous chart presents the price advancing in the wave b of Subminuette degree, identified in blue, which belongs to wave (e), also in blue. According to the Elliott Wave theory, the triangle pattern follows an internal sequence subdivided into 3-3-3-3-3 waves. In this context, and observing its advance in the triangle formation, the cross could develop its latest decline before starting a rally that corresponds to wave ((c)) of Minute degree, labeled in black.

The current downward move, corresponding to wave c, in green, could reach two potential demand zones. The first one is located between 79.468 and 79.237, whereas the second one is seen from 78.878 to 78.394.

Once CADJPY starts to get fresh buyers, the cross could experience a strong rally and test June’s high zone of 81.909.

Finally, the bullish scenario has its invalidation level below the wave (a) of Minuette degree in blue located at 77.585, under the contracting triangle pattern limits.

Categories
Forex Forex Elliott Wave Forex Market Analysis

Is CADJPY Ready for a New Rally?

Overview

The CADJPY cross advances mostly sideways in an incomplete triangle pattern. The corrective structure that remains in progress suggests the possibility of further upsides in the coming trading sessions.

Market Sentiment

The market sentiment on the CADJPY cross looks neutral, although during the overnight trading session, although the US presidential election is driving up volatility.

The following daily chart shows the long-term market participants’ sentiment unfolded between the 52-week high and low range. The figure reveals the price action currently moving on the neutral zone, which moves near the level of 79.274. 

In this context, the neutral sentiment is confirmed by the sideways channel, which began in early June, and the price action moving below the 60-day moving average Nevertheless, the bullish wide range candle of November 02nd leads to expect further upsides in the following weeks.

Technical Big Picture

The CADJPY cross moves in a sideways upward structure that belongs to an incomplete upward sequence that began last March 17th when the price found fresh buyers at 73.803.

The 2-day chart shown below illustrates the big picture of CADJPY under the Elliott Wave analysis perspective. The figure reveals the pair’s action advancing in an incomplete third wave of Minute degree labeled in black.

The consolidation structure of the CADJPY cross, in progress, suggests the possibility of a bullish continuation. Likewise, in terms of the Elliott Wave theory, if the current upward sequence corresponds to an incomplete impulsive sequence, the price could develop an extended wave. Nevertheless, a signal of confirmation of the potential new rally will occur if the price breaks and closes above the pivot level located at 79.823.

The short-term supports and resistance levels are as follows:

  • Resistance 1: 80.542
  • Resistance 2: 81.448
  • Resistance 3: 82.634

Pivot Level: 79.823

  • Support 1: 78.502
  • Support 2: 77.573
  • Support 3: 76.526

Short-term Technical Analysis Outlook

The CADJPY cross in its 4-hour chart unveils the course in a corrective structure that resembles a triangle pattern (subdivided into 3-3-3-3-3). This potential triangle pattern remains unfinished and could be developing its wave (d) of Minuette degree labeled in blue.


From the previous chart, both the breakout and close above the descending trendline connect the top of wave (b) of Minuette degree with the end of wave b identified in green as the close above the level 79.872 could confirm the turning bias from neutral to bullish.

The advance in its wave (d) identified in blue could find resistance between 81.448 and 81.909. Once the potential triangle pattern completes, the price could advance toward 84.739 and even extend its gains until 86.677.

Finally, the upward scenario’s invalidation level is located below the end of wave (a) of the Minuette degree labeled in blue.

Categories
Forex Signals

CADJPY Swing Failure Sell

Categories
Forex Signals

CADJPY Shows Intraday Bounce Signals

Description

The CADJPY cross exposes an intraday bounce structure that suggests the possibility of an upward movement, which could surpass the Wednesday trading session high at 79.09, leading to the price toward a new intraday high.

From the 30-minute chart, we observe the low of the week’s bullish reaction at 78.371 from where the price action reacted mostly upward. The price looks stopping the bearish pressure during the current trading session, developing an intraday double bottom pattern, which remains in progress.

On the other hand, the extreme bearish sentiment in the stock market leads us to expect an upward turn in the downward intraday session, increasing the possibility of weakness in the Japanese currency.

Our bullish scenario foresees an upward movement toward the September 18th consolidation high located at level 79.295, from where the price should find resistance. The invalidation level of our outlook locates at 78.52.

Chart

Trading Plan Summary

Check out the latest trading signals on the Forex Academy App for your mobile phone from the Android and iOS App Store.

Categories
Forex Market Analysis

CAD/JPY: A massive round number holding the key

CAD/JPY produced a bullish inside bar yesterday. The price had a bounce at the same level earlier and made a bullish move. The daily chart suggests that the price has some space to travel towards the North. However, if a bullish inside bar is followed by a bearish engulfing candle, it ends up being prolific for the sellers. The H4 chart looks bullish. On the other hand, the H1 chart looks a bit bearish biased. Thus, traders are to be very watchful to trade in the pair. Let us now have a look at three vital charts.

Chart 1 CAD/JPY Daily Chart

The chart shows that it had a bounce at the level of 80.000 earlier. It is a massive round number. It pushed the price towards the North, and the price made a bearish move, closing within the level. Yesterday’s candle came out as a bullish inside bar. As far as the round numbered support is concerned, the price may make a bullish move. However, if the price gets bearish and ends up producing a bearish engulfing candle closing below 80.000, the sellers may go short in the pair aggressively and drive the price towards the level of 78.300. On the other hand, if the price gets bullish, it may find its next resistance around 81.400.

Chart 2 CAD/JPY H4 Chart

The chart shows that the price upon having a bounce at the level of 80.800 produced a spinning top and headed towards the North. It made a bullish breakout at the level of 80.600. The pair had a rejection at 80.800. It has been in a bearish correction. The level of 80.600 may work as a level of support. If the level ends up producing a bullish reversal candle, the buyers may go long above the level of 80.800. The price may find its next resistance around 81.400.

Chart 3 CAD/JPY H1 Chart

The price had a rejection at the level of 80.800 twice. It produced a bearish engulfing candle. The pair is trading around the neckline at 80.640. A bearish reversal candle may attract the sellers to go short in the pair and drive the price towards the South. The price may find its next support around 80.150. On the other hand, the buyers are to wait to go long above the level of 80.800.

The H1 chart looks bearish biased. However, the daily and the H4 chart look bullish. Considering these three charts, it seems that the pair may end up having another bullish day.

Categories
Forex Signals

CADJPY Structure Suggests Bearish Continuation

Description

The CADJPY cross in its 2-hour chart moves in a mid-term sideways structure identified as a contracting triangle pattern. The technical formation suggests the bearish continuation of the bearish sequence started on June 05th, when the price topped at 81.905.

Both the bearish trendline as the RSI oscillator confirms that the bearish trend remains intact. In this context, the RSI reveals a breakdown that suggests the possibility of a bearish movement. At the same time, the re-test of the base-line of the contracting triangle leads us to expect a new decline in the CADJPY cross.

An intraday bearish movement could drag the price from the current zone until the consolidation zone developed on May 29th at 77.955. The invalidation level of our bearish scenario locates at 79.058.

Chart

Trading Plan Summary

Categories
Forex Elliott Wave Forex Signals

CADJPY Moves in an Elliott Wave Triangle

Description

The CADJPY cross, in its 4-hour chart, shows a triangle pattern that should continue the upward movement of the previous impulsive move in the following trading sessions.

The Elliott wave perspective of CADJPY reveals the price action is running in a descending triangle, which could be ended its wave (e) of the Minuette degree labeled in blue. At the same time, CADJPY should be ending its wave ((ii)) of Minute degree in black.

The upward movement developed in the Thursday trading session, warns us that CADJPY could resume its advances in a wave ((iii)) of Minor degree.

Our bullish scenario considers an upside entry from the current zone at 76.373. In a conservative outlook, we expect a potential profit target at 77.973.3

Finally, the upward scenario will be invalid if the price action declines below 75.573.

Chart

Trading Plan Summary

  • Entry Level: 76.373
  • Protective Stop: 75.573
  • Profit Target: 77.973
  • Risk/Reward Ratio: 2 
  • Position Size: 0.01 lot per $1,000 in trading account.
Categories
Forex Signals

CADJPY triple bounce off the upper linear regression channel boundary

The Setup

Fig 1 – CADJPY triple bounce off the upper linear regression channel boundary

CADJPY has been obeying a slightly descending linear regression channel. On the 60 min chart, the ± 2 sigma lines are shown in blue, whereas the regression line, is shown in dotted white. In that chart, we can observe that the price has bounced three consecutive times off that line, and now, in its third bounce, it also pierced its 50-hour SMA to the downside.

A trade can be created with an entry at the current price and a target neat the bottom of the channel, for an excellent reward to risk factor. The rationale for this type of trade is the following. On channels like that, the odds of a reversal from a 2 sigma line is high, at least 95% of the time. The issue here is the reversal is strong enough to reach our target? Usually, it is highly likely a movement to touch the mid of the channel, but, since here the channel is descending, the odds of it moving to the bottom is higher. We will follow this trade, though, and adapt our stop-loss level and take profit as we see how the bearish momentum evolves.

Key Levels

  •         Entry: 76.495
  •  Stop-Loss: 76.895
  • Take-profit: 75.295
  • Reward/Risk: 3

Dollar Risks and Rewards

Risk: 40 pips = $372 per lot, or $37.2 per mini lot.

Reward: 120 pips = $1,117 per lot, or 111,7 per mini lot


Categories
Forex Signals

CADJPY – Contracting Triangle Suggests Fresh Upsides

Description

The CADJPY cross, in its 4-hour chart, exposes a contracting triangle pattern that belongs to the second wave of Minute degree identified in black.

According to the alternation principle and the extensions of the Elliott wave theory, this complex structure should precede the extended impulsive wave.

On the other hand, the last rally developed by the Oil group could support the bullish sentiment in favor of the Canadian currency.

A buy-side position will activate if the CADJPY cross soars above 76.08. In our conservative scenario, we foresee a rally at least until the level 78.16; however, we don’t discard an upside till level 80. 

The bullish scenario will be invalid if the price drops below the level 74.63.

Chart

Trading Plan Summary

Categories
Forex Signals

CADJPY Could Develop a New Bullish Leg

Description

The CADJPY cross, in its 4-hour chart, illustrates a consolidation structure after the price developed an impulsive bullish movement from the March 18th low at 73.803, which finished when the cross topped at 78.479 on March 25th.

The consolidation structure realized by CADJPY looks like a corrective formation in three-waves, which could bounce from the current zone that coincides with the 61.8% of Fibonacci retracement of the previous impulsive movement.

A buy-side position would trigger from the current area. In our conservative bullish scenario, we expect a bounce that could reach the previous high at 77.04 as a psychological resistance. 

The bullish scenario will be invalid if the price drops and closes below the level 74.75.

Chart

Trading Plan Summary

Categories
Forex Market Analysis

Daily Review -US-EU Negotiations, Brexit Deal, UK Wages Hike, NAFTA Discussions


NEWS COMMENTARY


Markets stalled on Tuesday as uncertainty over a trade dispute between Washington and Beijing kept investors on edge.

U.S. President Donald Trump wants to impose tariffs on almost all imported Chinese goods .China’s foreign ministry said on Monday that it would respond to any new steps on trade.

.


US Trade Representative Robert Lighthizer just finished a meeting with European Trade Commissioner Cecilia Malmstrom in Brussels yesterday. Malmstrom said in a tweet that “Lighthizer discussed how the EU-US achieves concrete results in the short to medium term towards a free trade agreement.” And they’ll meet again at the end of September.

Lighthizer’s office described the talks as constructive. Also, work would be done in October to identify tariff and non-tariff barriers that could be cut. And trade chiefs of EU and US will follow up in November to finalize certain results.

However, a deal is not likely to be reached as soon as the White House administration would like


The euro rose on Tuesday as easing concerns about Italian debt boosted the single currency for a second day,

The euro was strengthened by a fall in Italian government borrowing costs this week after Economy Minister Giovanni Tria on Monday predicted yields would drop as the government lays out its much-anticipated budget for 2019


More upbeat talk from the EU negotiator sent sterling higher


Barnier said in a forum in Slovenia that “if we are realistic we are able to reach an agreement on the first stage of the negotiation, which is the Brexit treaty, within 6 or 8 weeks.” And, “taking into account the time necessary for the ratification process, the House of Commons on one side, the European Parliament and the Council on the other side … we must reach an agreement before the beginning of November. I think it is possible.”

What enhances the pound further that wages came strong at 2.6% higher than expected 2.4%, so it would be a confidence builder for pound longs


Canada and the US will restart high-level trade talks in Washington today. Whether it’s still NAFTA or not, the two sides reached a deadlock in three key issues, Canadian dairy market access, cultural exemption for Canada and Chapter 19 dispute resolution mechanism. Not much news is released regarding the discussions as both sides agreed not to negotiate in public.

Canadian Prime Minister Justin Trudeau just reiterated yesterday that “we continue to work hard and we are positively optimistic that we can get a win-win-win for all three countries.” Foreign Minister Chrystia Freeland, who’ll be in Washington today, said last week that the negotiation has entered into a “very intense phase” and the officials have been working 24-7.


CHART ANALYSIS


DAX

On the daily chart, we can see that the price had a bearish rally for the past six weeks until it reached the key support zone of 11900.8-11742.4

It’s also the lower side of the descending channel along with 88.6% Fibonacci

The price is technically expected to have its way up back again to the key resistance level 12582.46 which is the top of descending channel and the broken ascending trend


OIL

On the daily chart, the price is moving sideways between the support area 66.2-64.15 and the resistance area 74.45-72.45

After breaking the ascending trend, the price turned back to this support zone with bounce from an ascending trend as shown

The price now is retesting this zone with price action “pin bar”, to have a bullish movement again

So, it’s expected to go up to the resistance zone of 72.45-74.45


CADCHF

On the daily chart, the pair is facing a punch of support levels

Firstly the key support level of 0.732, secondly the ascending trend from the low of 2016, third the Gartley harmonic pattern, forth the wedge reversal pattern, and finally the oversold on RSI

So, the price is supposed to get back up again to the resistance 0.762


CADJPY

On the daily chart, the pair was moving bearish on the last two weeks, down from a strong resistance zone

Until it reached the key support of 83.75, followed by the ascending trend line from the low of 2018

After forming pin bar followed by bullish candle, the price is expected to hike again to the zone 86.15-86.9


Categories
Forex Educational Library

Forex.Academy 2018-2019 Outlook – CAD Group


Summary


Forex Daily News: In this post, we analyse the Canadian Dollar group against their main currencies. As a summary, the second half of the year and 2019, we foresee a corrective movement in the Canadian currency, which could come supported for a correction in oil prices to, then, give way to a new rally. After this correction, our central vision for the Canadian Dollar is a new appreciation scenario.

Additionally, we observe that it is likely that GBP and EUR would show the best performance against the CAD; on the opposite side, the Japanese currency and the Swiss Franc could have the worst performance against the Canadian Dollar.


USDCAD

The USDCAD is developing a complex corrective structure of a second bullish impulsive wave. The corrective structure has a bearish bias, which could find support in the area between 1.29607 to 1.28371. The key level to watch out is 1.2884, this level should convert on a critical pivot level (HHL).


EURCAD

EURCAD cross in the short-term has a bearish bias, probably could see new lows in 1.50 zone. In the mid-term, the cross moves sideways as a complex corrective. In the long-term, we foresee that the EURCAD could find fresh lows in the area between 1.47822 to 1.45662, from where the cross could start a new rally as a fifth bullish wave. Invalidation level is at 1.4442.


GBPCAD

Probably the GBPCAD cross shows the clearest movement of the CAD Group. The price is moving in a bearish A-B-C sequence, which could find support at 1.6410 level, from where the price could create a new connector and then initiate a rally. The new bullish sequence has a target the area between 1.8533 and 1.9266. Invalidation level is at 1.5837.


CADJPY

The CADJPY cross has been commented in a previous analysis, and we maintain the main idea which consists in to seek only long positions with a long-term profit target in the area between 94.69 and 95.30. Is probably that the cross makes a retrace to the area between 85.45 to 83.73 from where we could find new opportunities to incorporate us into the trend. Invalidation level is located at 82.17.


CADCHF

In the CADCHF cross, the lemma is “Buy the Dips” or “Watch the Breakout.” CADCHF is running sideways in an upper degree consolidation structure. The key level to control is 0.7636, after the breakout of this level, we expect more upsides to the zone between 0.7992 and 0.8245. In case that the price makes a false breakdown to the area between 0.7394 and 0.7289, it could be an attractive opportunity to look for the long side. Invalidation level is at 0.7124.


NZDCAD

In the long-term, NZDCAD is running sideways and making lower highs. The long-term pivot level is at 0.8640. For this cross, we expect only short positions; if the price makes a bullish move, the potential movement is limited to the area between 0.9253 to 0.9461. The long-term target area is between 0.8401 to 0.8098.


AUDCAD

Probably the AUDCAD cross is the less attractive to trade. As we can see in the weekly chart, it is running sideways since the second half of 2013. The price is moving inside a bearish cycle, which could find support in the “long-term pivot level” at 0.8919, from where AUDCAD could start to bounce. The invalidation level for the bearish cycle is at 1.0397.


Forex Daily News: Finally, as a technical note, considering that the AUDCAD is mostly bearish, by correlation, the CAD should perform better than the AUD for the period foreseen.

Categories
Forex Market Analysis

U.S CPI, NATO Meeting


News Commentary


Markets rose as investors pushed back trade concerns and looked ahead to earnings results.

Unemployment claims fell to a nine-week low of 214,000, while While U.S. consumer prices advanced less than expected in June among falling utility prices and a record drop in hotel costs, the gauge excluding food and energy costs rose 0.2%.

But the annual consumer inflation rate rose to 2.9% in June. To support the argument for a faster pace of monetary tightening by the Federal Reserve.

President Donald Trump claimed a personal victory at the NATO summit on Thursday after telling European allies to increase spending or lose Washington’s support, which forced leaders huddle in a crisis session with the U.S. president.

Trump declared his commitment to a Western alliance built on U.S. military might that has stood up to Moscow since World War Two.


Chart Analysis


US INDEX

On the daily chart, the price has returned to the red resistance zone with shaping before the reversal double top.

Price has formed another reversal pattern to assure the bearish bias with the wedge.

Followed by a break beneath an ascending trend on RSI, the index is supposed to have its way back to the support zone 93.2-92.6.


AUD/USD

On the daily chart, the pair bounced back from the resistance 0.7455, to retest the green support zone again.

Followed by divergence on RSI, our bullish view is still the same: Heading towards the combination of levels of descending trend, ascending channel and resistance zone at 0.7655-0.774.


CAD/JPY

On 4-hour chart, as we expected before, the price broke the resistance and the neckline of the head & shoulders pattern at 84.35, to assure the bullish momentum also powered by wedge & Gartley harmonic patterns.

The price is expected to target the resistance 87.


NZD/USD

On the daily chart, the price retested the green support zone 0.682-0.6775, followed by divergence in RSI.

An AB=CD harmonic pattern has been shaped to reinforce the bounce.

The price is supposed to head back to the top of the descending channel with the resistance zone at 0.697-0.703.


Categories
Forex Market Analysis

Daily Market Update: NFP Report, Brexit View


News Commentary


The dollar was heading up three-week lows against a currency basket after the latest U.S. jobs report on Friday showed wages grew less than expectation in June with 0.2% (forecast was 0.3%), even as the economy created more jobs than expected with 213K (forecast was 195K).

The average hourly earnings pointed to sustain inflation pressures that hold expectations back for a fourth rate hike by the Federal Reserve this year.


Brexit secretary David Davis resigned unexpectedly last night, to send a blow to Prime Minister Theresa May, as she struggles to end conflicts among her ministers who felt her plan to press for the closest possible trading ties with the European Union had betrayed their desire for a clean break with the bloc.

The pound had fallen responding to the following the reports, before having another turnaround amid indications that May would not face major trouble against her Brexit policy and hopes that a softer Brexit may be on the cards moving forward.


The Euro was boosted after data showing that German exports rose by more than imports in May, indicating that the euro area’s largest economy remains solid despite global trade tensions.


Chart Analysis


USD INDEX

As we expected on the daily chart, the price had bounced from the key resistance at 95.5, powered by divergence on RSI and a break beneath an ascending trend line.

The price also had shaped a reversal double top pattern.

So, the index is supposed to get back down to the support zone again of 93.2-92.6.


USD/JPY

On the daily chart, the pair retested the key resistance of 111.1 again and the descending trend from the high of 2017 to shape a double top reversal pattern.
So, the price is expected to assure the next bearish move that leads the price to the support zone of 108.65-108.15.


AUD/USD

On the daily chart, as we expected, the price has reversed from the support zone of 0.7325-0.7365.

The pair is supposed to go on in its bullish momentum powered by divergence on RSI to reach the key resistance of 0.758, where the descending trend from the high of February is located.


AUD/JPY

As we expected before, the price has reached and bounced from the support zone 81.2-80.5 as the price is moving sideways.

So, the price is expected to retest the head of the pattern to again reach the levels of 84-84.4.


CAD/JPY

On the 4 hour chart, we can see a break above the descending wedge along with shaping a head & shoulders pattern.

A GARTLEY harmonic pattern has enhanced the bullish bias before 84.35.

Watch the neckline of the H&S which is located at the mentioned resistance (84.35) with moving average 200 too.

A break above these levels would take the price up to the key resistance 87.


Categories
Forex Market Analysis

Daily Market Update: Trade Tariffs Begin, FOMC Meeting, NFP Data


News Commentary


The trade conflict between the US and China has just been put into action today when U.S. tariffs on $34 billion worth of Chinese goods went into effect at 04:00 GMT. An additional tariffs on another $16 billion is expected to take place in the upcoming two weeks. Meanwhile U.S. President Donald Trump has given instructions to identify a further $300 billion on possible Chinese goods.

China has also vowed to reply with tariffs on $34 billion of American goods. Beijing had previously said it would impose tariffs on U.S. agricultural products, crude imports, and vehicle products.


Yesterday, Federal Reserve policymakers enhanced the view of further increases in interest rates as the U.S. economic growth continued “above trend”.

“Participants generally expected that further gradual increases in the target range for the federal funds rate would be consistent with the solid expansion of economic activity, strong labour market conditions, and inflation near the Committee’s symmetric 2 per cent objective over the medium term,” the Fed said in the minutes.

The Fed’s statement to continue tightening monetary policy was boosted by a continued rally in inflation and a solid labour market, despite concerns about the impact of rising trade tensions on spending and business sentiment.


Today’s big data will be at 12:30 GMT with NFP. The expectation goes for 195K, less than the previous reading 223K

Also keep an eye on average hourly earnings, which is expected to remain the same as the last reading with 0.3%


 Chart Analysis


USD INDEX

As we expected on the daily chart, the price had reached the key resistance at 95.5 and bounced back from it, powered by divergence on RSI.

The price also had shaped a reversal double top pattern.

So, the index is supposed to get back down to the support zone of 93.2-92.6 again, then start its journey to the C wave.


USD/JPY

On the daily chart, the pair retested the key resistance of 111.1 again and the descending trend from the high of 2017 to shape a double top reversal pattern.
So, the price is expected to assure the next bearish move that leads the price to the support zone of 108.65-108.15.


AUD/USD

On the daily chart, the price has reached the support zone of 0.7325-0.7365.

The pair is supposed to find some breath powered by divergence on RSI to reach the key resistance of 0.7515, where the descending trend from the high of February is located.


AUD/JPY

As we expected before, the price has reached the support zone 81.2-80.5 as the price is moving sideways.

So, the price is expected to retest the head of the pattern to reach the levels of 84-84.4 again.


CAD/JPY

On the 4 hour chart, we can see a break above the descending wedge along with shaping head & shoulders pattern.

A GARTLEY harmonic pattern has enhanced the bullish bias before 84.35.

Watch the neckline of the H&S which is located at the mentioned resistance (84.35) with moving average 200 too.

A break above these levels would take the price up to the key resistance 87.


Categories
Forex Market Analysis

Daily Market Update: RBA Remains Rates On Hold, German Politics Eased


News Commentary


Trade tensions remain on fire as the U.S. government has blocked China Mobile from offering services to the U.S. telecommunications market, recommending its application be declined.

“We urge the relevant side in the United States to abandon Cold War thinking and zero-sum games.” Said the Chinese foreign ministry spokesman Lu Kang

That move by U.S. President Donald Trump’s administration comes amid growing trade tensions between the two countries. The U.S. is probably set to impose tariffs on $34 billion worth of goods from China on Friday, which Beijing is expected to respond to with tariffs of its own, to remain in a tit for tat circle.


The euro has been supported as political risk in Germany calmed, after Chancellor Angela Merkel reached a deal on immigration policy with coalition partners, resolving a row that had put into doubt the future of the government.


The Reserve Bank of Australia left interest rates steady at 1.5%. The statement had come to a rather neutral to dovish tone as it declared inflation is likely to remain slow for some time, wage growth also remained slow and household consumption remains a source of uncertainty.

The statement came similar to the June statement with main data remaining the same as well as the tone.


Trading is expected to be thin ahead of the U.S. independence day holiday, with markets closing early at 17:00 GMT.


Chart Analysis


USD INDEX

As we expected on the daily chart, the price had reached the key resistance at 95.5 and bounced back from it, powered by divergence on RSI.

The price also had shaped a reversal double top pattern.

So, the index is supposed to get back down to the support zone of 93.2-92.6 again, then start its journey to the C wave.


USD/JPY

On the daily chart, the pair retested the key resistance 111.1 again and the descending trend from the high of 2017.

So, any bounce here will lead the price to the first support of 108.15.


AUD/USD

On the daily chart, the price has reached the support zone of 0.7325-0.7365

The pair is supposed to find some breath powered by divergence on RSI to reach the key resistance of 0.7515, where the descending trend from the high of February is located.


AUD/JPY

As we expected before, the price has reached the support zone 81.2-80.5 as the price is moving sideways.

So, the price is expected to retest the head of the pattern to again reach the levels of 84-84.4.


CAD/JPY

On the daily chart, as we expected, the price has risen from the support of 81.15, near the green support zone.

The pair bounces with two engulfing bars from the 78.6% Fibonacci level.

A Gartley harmonic pattern has been shaped at these same levels, with an oversold area on RSI.

All these factors enhance the continuation of bullish movement to reach firstly the resistance at 85.5, then the retest at 86.95


Categories
Forex Market Analysis

Daily Market Update: EU To Impose Tariffs On US, Great Britain Higher Manufacturing PMI


 News Commentary


The European Union has threatened to impose new tariffs worth $300 billion if the U.S. moves forward with tariffs on European cars.

President Donald Trump, who has criticised the EU of its trade surplus with the U.S. before, and for its higher import duties on cars, said last week that the government was completing its study and suggested the U.S. would take action soon.

The latest update in the global trade war comes on Friday when the U.S. moved to impose $34 billion of tariffs on Chinese exports. China is expected to respond with tariffs of its own on U.S. goods.


The Euro had been boosted on Friday after the European Union’s leaders reached a deal on migration, easing pressure on Merkel. However, the Euro came under pressure after Germany’s interior minister asked to resign over immigration policy, throwing into doubt the future of Angela Merkel’s coalition government.


In the UK, British factories kept up a steady growth in June but worries about global trade and Brexit still hit confidence about the outlook to a seven-month low.

But the better than expected Manufacturing PMI (54.4 versus forecast at 54.1) will provide additional optimism for the hawkish members on the committee to raise the rates.

All eyes will be on US manufacturing PMI which is expected to reach 58.2.


Chart Analysis


USD INDEX

As we expected on the daily chart, the price had reached the key resistance at 95.5 and bounced back from it, powered by divergence on RSI.

The price also had shaped a reversal double top pattern.

So, the index is supposed to get back down to the support zone again of 93.2-92.6, then start its journey to the C wave.


USD/JPY

On the daily chart, the pair retested the key resistance of 111.1 and the descending trend from the high of 2017.

So, any bounce here will lead the price to the first support of 108.15.


AUD/USD

On the daily chart, the price has reached the support zone of 0.7325-0.7365.

The pair is supposed to find some breath powered by divergence on RSI to reach the key resistance of 0.7515, where the descending trend from the high of February is located.


AUD/JPY

As we expected before, the price has reached the support zone 81.2-80.5 as the price is moving sideways.

So, the price is expected to retest the head of the pattern to again reach the levels of 84-84.4.


CAD/JPY

On the daily chart, as we expected, the price has risen from the support of 81.15, near the green support zone.

The pair bounces with two engulfing bars from the 78.6% Fibonacci level.

A Gartley harmonic pattern has been shaped at these same levels, with an oversold area on RSI.

All these factors enhance the continuation of bullish movement to reach first the resistance at 85.5, then the retest at 86.95.


Categories
Forex Market Analysis

Daily Market Update: Euro CPI, Great Britain & Canadian GDP


News Commentary


The Euro CPI Flash Estimate is set to exceed the last reading at 1.9%, to reach the ECB target of 2.0%.

This could give much volatility to the Euro after the negative market reaction to the last ECB meeting.


In Great Britain, the focus will be on the final release of the Q1 UK GDP. There is a chance it may get revised up closer to the Bank of England forecast of 2.3% vs 2.1% actual.


According to a report by Reuters, Canada is set to announce financial aid for their steel industry and workers on Friday.

“Canada will hit back against U.S. tariffs on its steel and aluminium by offering affected companies and workers up to C$800 million ($603 million) in aid”, a source familiar with the matter said on Thursday.

This could shake the market and affect the US dollar badly, as all sides stick to tit for tat tariffs.


Chart Analysis


AUD/USD

On the daily chart, the price has reached the support zone of 0.7325-0.7365.

The pair is supposed to find some breath powered by divergence on RSI to reach the key resistance of 0.7515, where the descending trend from the high of February is located.


USD/JPY

On the daily chart, as we expected, the pair bounced from the descending trend from the high of 2017 and the key resistance of 111.1.

As you can see on the chart, the price is moving according to Elliot waves. By forming the A & B waves, we are waiting for the next move down to hit the C level which is located at the support of 106.9 and also to meet the ascending trend from the low of 2016.

So, a possible bounce has started and on its way.


USD/CAD

As we expected before, the price has reached the key resistance level of 1.334.

We can see the price has reversed from a very strong selling area according to many factors, including key resistance level, 78.6% Fibonacci, the upper level of the reversal wedge, forming the Gartley harmonic pattern, and overbought in RSI.

So, with this engulfing bar, the price will be led down to the support zone at 1.309-1.299.


CAD/JPY

On the daily chart, the price had a bearish rally from the key resistance of 86.95 to reach the support of 81.15, near the green support zone.

The pair bounces with an engulfing bar from the 78.6% Fibonacci level.

A Gartley harmonic pattern has been shaped at these same levels, with an oversold area on RSI.

All these factors enhance the bounce bias for the price to reach firstly the resistance at 85.5, then the retest at 86.95